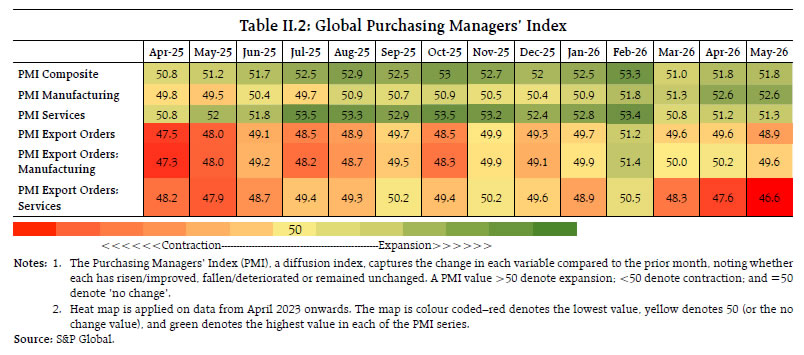
Geopolitical tensions and trade disruptions persisted, despite the recent interim peace deal in West Asia. Amidst the challenging global environment, the Indian economy grew at 7.8 per cent in Q4:2025-26, supported by private consumption and fixed investment. High-frequency indicators during the first two months suggest sustained economic momentum in 2026-27. Despite a pick-up in May, CPI-inflation remained anchored. India’s external sector remained resilient, supported by FDI inflows and adequate foreign exchange reserves. Introduction Geopolitical tensions and trade disruptions have been testing the resilience of the global economy. Extended supply-side pressures have led to sustained rise in commodity prices and broader inflationary expectations till early June. In the backdrop of geopolitical tensions in West Asia, the World Bank in its latest report1 downgraded the global gross domestic product (GDP) growth projections, while raising its inflation projections. Even so, the recent de-escalation of West Asia tensions and the interim peace deal between the US and Iran, signed in the third week of June, have provided a vital opening towards normalisation. Global Purchasing Managers’ Index (PMI) saw a widespread moderation across major economies in May. However, with anticipated opening of the Strait of Hormuz and gradual restoration of supply chains, crude oil prices have exhibited significant correction in June so far. Taking cues from developments in West Asia, US Treasury yields softened amidst easing inflationary concerns, after remaining elevated till early June. Emerging market bond spreads and risk sentiment fluctuated, reflecting the uncertainties. Equity markets gained on the back of strong AI and technology sector and progress in the negotiations. The Indian economy displayed strength in terms of the provisional GDP estimates for 2025-26. GDP growth during Q4:2025-26 remained robust at 7.8 per cent, driven by private consumption and fixed investment. High-frequency indicators point towards sustained economic activity in May. Domestic demand conditions remained resilient, supported by urban demand. According to the revised series of the Index of Industrial Production (IIP), industrial growth strengthened in April, driven by the manufacturing sector. Merchandise trade deficit largely remained unchanged in May 2026 over the previous month but widened year on year mainly on account of higher crude oil prices. Consumer price index (CPI) inflation increased in May 2026 to 3.9 per cent from 3.5 per cent in previous month, driven by broad-based increases across food, fuel and core components. The rise in transport fuel prices reflects the latest adjustment of retail prices by oil marketing companies. Core inflation (CPI excluding food and fuel) also edged up. The Monetary Policy Committee in its bi-monthly review of June 2026, unanimously decided to keep the policy repo rate unchanged at 5.25 per cent and retained a “neutral” stance while waiting for more clarity on the West Asia conflict situation and the risks from a likely sub-normal south-west monsoon and El Niño event.2 The provisional accounts of the Central Government for 2025-26 strengthened the credibility of Centre’s fiscal consolidation path, with the gross fiscal deficit (GFD) at 4.4 per cent of GDP. The deficit indicators of the states, however, worsened modestly. Surplus liquidity in the banking system moderated in the second half of May and June so far, reflecting an increase in currency in circulation and elevated government cash balances. The weighted average call rate (WACR) edged up and remained in the upper half of the policy corridor. The yields on 91-day treasury bills, 3-month commercial papers (CPs) and certificates of deposit (CDs) moderated after firming up in May. G-sec yields softened, supported by measures announced by the Government and the Reserve Bank to attract foreign capital. Corporate bond yields also eased, although the spreads generally widened. The total financial resource flows increased during 2026-27 (up to May 31), over the corresponding period of the previous year, driven by a pickup in non-food bank credit and rise in foreign direct investment (FDI) to India. The bank credit growth picked up further in May 2026. The policy rate transmission in the credit market moderated during March-April, with some hardening in deposit and lending rates. Indian equity markets weakened till early June due to concerns over West Asia conflict, before witnessing recovery on news related to US-Iran interim peace agreement. India’s external sector continues to exhibit resilience in terms of contained current account deficit and foreign exchange reserve buffers. Among capital flows, FDI inflows gained strength, while foreign portfolio investment (FPI) recorded net outflows since March 2026. Recent policy measures, including the expansion of the Fully Accessible Route (FAR) to longer-tenor government securities and tax exemptions for foreign investors in government securities, are expected to strengthen demand for Indian sovereign debt and support capital inflows. The remainder of the article is presented in four sections. Section II covers the evolving developments in the global economy. Section III provides an assessment of domestic macroeconomic conditions. Section IV presents the financial conditions prevailing in India, while Section V offers concluding observations. II. Global Section In the backdrop of geopolitical tensions in West Asia, the World Bank, in its latest Global Economic Prospects, has projected the global growth to slowdown in 2026 with recovery expected in 2027 (Table II.1). While risks to the outlook remain skewed to the downside, wider adoption of AI and productivity-enhancing reforms could support medium-term growth. The recent de-escalation of West Asia tensions and the interim peace deal between the US and Iran, signed in the third week of June, have provided a vital opening towards normalisation of the situation in West Asia. The global macroeconomic environment remained fragile. While the emerging economy equity markets faced a rise in volatility, advanced economies like the US and Europe reflected improved confidence and a fall in risk premia. The interim peace deal in West Asia eased concerns over energy supply disruptions (Chart II.1a and b). The global composite PMI remained in the expansionary zone and maintained its value in May over April, partly driven by front-loading of demand for inventory keeping in view expected price rises and supply disruption. The manufacturing sector outperformed services for the third consecutive month with the rise in production volumes across the consumer, intermediate and investment goods industries. International trade flows, however, continued to decline, with new export orders contracting for the third month in a row (Table II.2). | Table II.1: World Bank: GDP Growth Projections of Select AEs and EMDEs | | Projection for | 2026 | 2027 | | Month of Projection | January 2026 | June 2026 | January 2026 | June 2026 | | World* | 3.2 | 2.9 | 3.3 | 3.4 | | Advanced Economies (AEs) | 1.6 | 1.5 | 1.6 | 1.8 | | US | 2.2 | 2.2 | 1.9 | 2.1 | | Euro area | 0.9 | 0.8 | 1.2 | 1.3 | | Japan | 0.8 | 0.7 | 0.8 | 0.9 | | Emerging Market and Developing Economies (EMDEs) | 4.0 | 3.6 | 4.1 | 4.2 | | Russia | 0.8 | 0.8 | 1.0 | 0.7 | | India# | 6.5 | 6.6 | 6.6 | 7.2 | | China | 4.4 | 4.2 | 4.2 | 4.3 | | Latin America and the Caribbean | 2.3 | 2.2 | 2.6 | 2.5 | | Mexico | 1.3 | 1.3 | 1.8 | 1.7 | | Brazil | 2.0 | 1.9 | 2.3 | 2.0 | | Middle East and North Africa | 4.3 | 1.6 | 4.3 | 5.0 | | Saudi Arabia | 4.3 | 3.1 | 4.4 | 4.9 | | Sub-Saharan Africa | 4.3 | 4.0 | 4.5 | 4.4 | | South Africa | 1.4 | 1.0 | 1.5 | 1.5 | Notes: 1. *: Projections by the World Bank are PPP weighted.
2. #: India’s data is on a fiscal year basis (April-March), while for all other countries it is for calendar years.
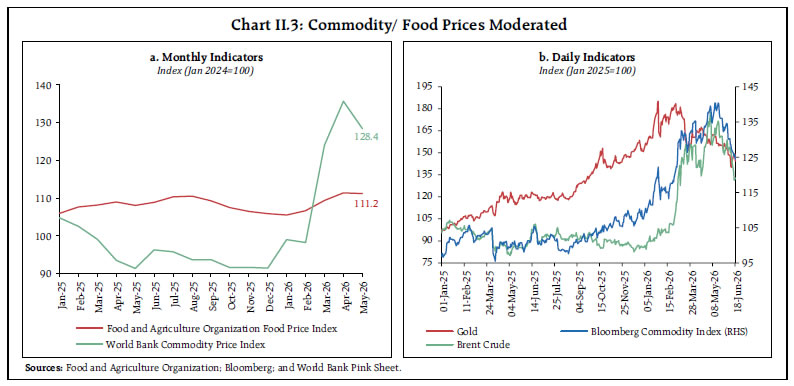
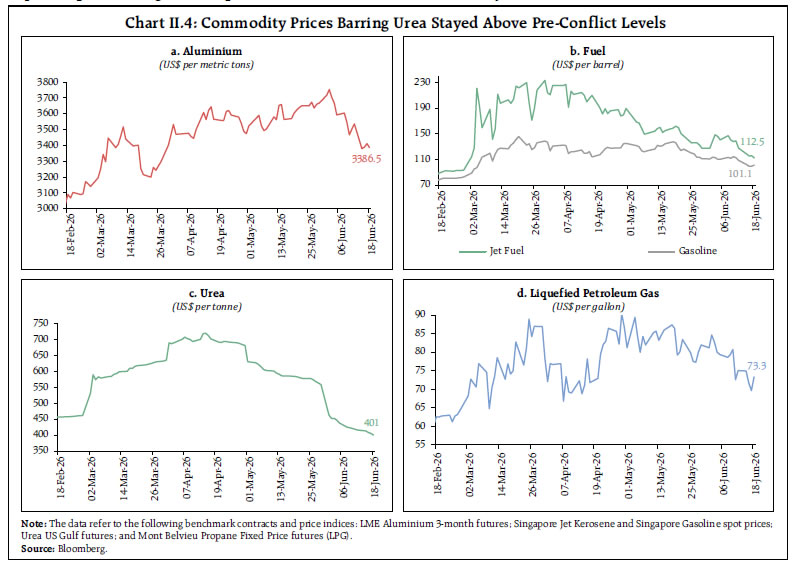
Source: Global Economic Prospects, World Bank, June 2026. | Business expectations varied across major advanced economies (AEs) and emerging markets and developing economies (EMDEs). Among major AEs, the composite PMI expanded in the US and Japan, while it contracted in Euro area and the UK (Charts II.2a). Within EMDEs, business activity continued to expand in India and China. New export orders, however, continued to moderate in May. Major AEs, except Japan and the UK, recorded a contraction in export orders. A dip in export orders was also observed in major EMDEs except India (Chart II.2b). Despite sustained supply chain pressures, the World Bank Commodity Price Index softened in May due to decline in Brent crude oil prices from its highly elevated levels in April. Brent crude oil prices sharply corrected to below US$ 80 after the announcement of West Asia peace deal in the third week of June. The FAO food price index remained stable, as the increase in price of cereals and sugar was offset by declines in vegetable oils and dairy products (Chart II.3a). The Bloomberg Commodity Index remained volatile in early May, before falling in the latter part of the month and early June. The correction was driven by moderation in prices of agricultural commodities, energy and precious metals. Gold prices extended their decline in June so far, as sustained selling pressure was reinforced by expectations of monetary policy tightening by the major central banks (Chart II.3b). 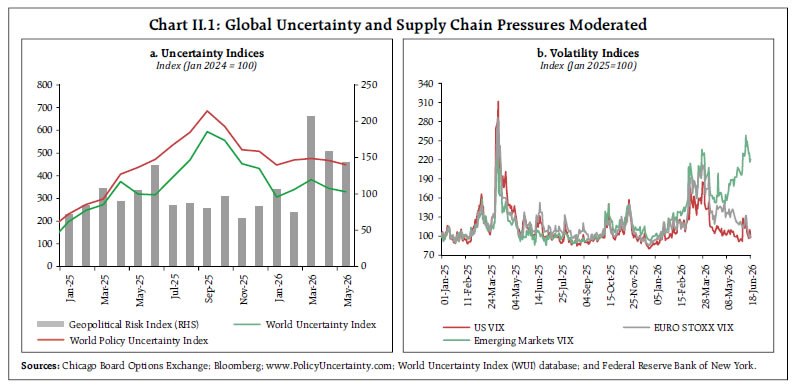
 The aluminium prices surged to its highest level since March 2022 in the first week of June but retreated subsequently. Gasoline and jet fuel prices softened from their conflict peaks with interim peace deal. The urea prices corrected sharply back to pre-war levels due to easing of export restrictions in China and reduced demand from major importing countries at the end of the spring planting season. Liquified petroleum gas (LPG) prices also declined in June after a surge in mid-May amidst the improving US inventory levels (Chart II.4). 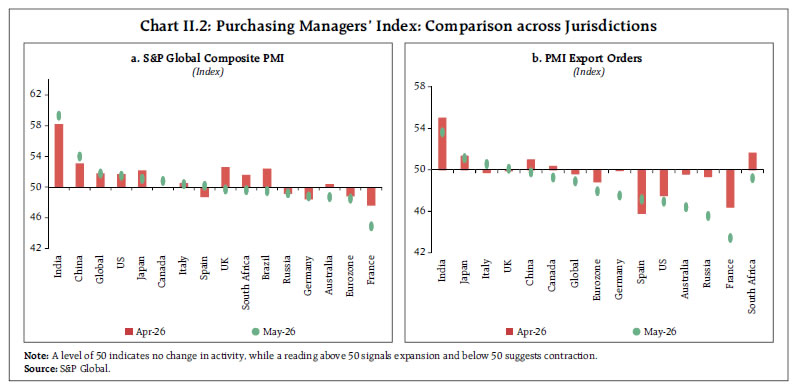
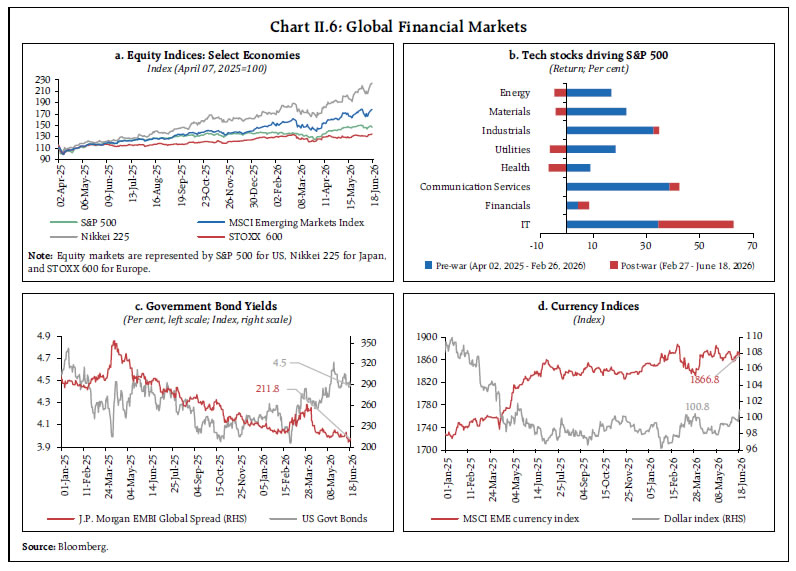
 In May, headline inflation generally edged up across major AEs and EMDEs. Among major AEs, inflation in the US surged to its highest level in three years, driven by a sharp increase in fuel prices. In the Euro area also, headline inflation rose led by energy and services. In Japan, inflation witnessed an uptick after the expiration of government fuel subsidy, while it remained steady in the UK due to moderation in food inflation which was offset by the rise in transport costs (Chart II.5a). EMDEs, in general, saw rising inflation concerns. In Brazil, food and beverages pushed up inflation, whereas in South Africa it was driven by fuel. Inflation, however, declined in Russia largely on account of fall in food prices while it remained steady in China (Chart II.5b). Equity markets gained in May led by tech stocks and growing optimism of diplomatic breakthrough in West Asia. It was, however, followed by pull backs in the beginning of June amidst concerns over the overvaluation of tech stocks and strong non-farm payroll data in the US moderating the probability of monetary accommodations. Markets recovered in mid-June after the US-Iran peace deal announcement, supported by lower oil prices, and renewed risk appetite. A strong first-quarter corporate earnings and hopes of progress in ceasefire talks sustained the equity market sentiments in the US. However, major equity indices slipped with the hawkish Fed statement. Euro area stocks remained broadly stable on the back of higher sensitivity to energy prices and subdued investor sentiment. Japanese equities edged higher, driven by AI and semiconductor-related stocks. Emerging market equity performance was driven primarily by a few Asian technology heavy markets (Chart II.6a). Technology stocks have been the primary driver of the S&P 500, substantially outshining other sectors in recent times (Chart II.6b). The 10-year US treasury yield hardened in May due to inflationary concerns and diminishing rate cut expectations. However, it remained range-bound in mid-June on easing geopolitical tensions and moderating energy prices. The emerging market bond yield spread narrowed by mid-June, with the ceasefire talks tempering the risk perceptions (Chart II.6c). The US Dollar Index remained steady for most of May, underpinned by robust US economic data, before strengthening later in May amidst higher inflation and Fed tightening expectations. It traded with a depreciating bias in first half of June on easing geopolitical tensions, though it strengthened later on Fed’s hawkish stance (Chart II.6d). Portfolio flows to emerging markets reflected large equity outflows despite continued debt inflows (Chart II.7). 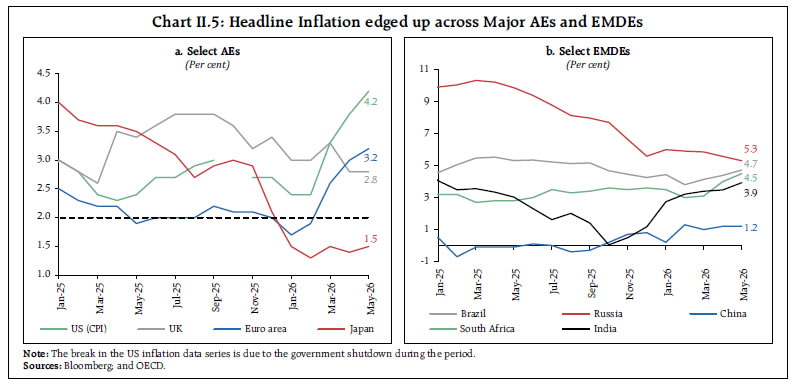
 In June, major central banks adopted a cautious monetary policy stance amidst challenging growth-inflation trade-offs. Amongst major AEs, while the Euro area and Japan pivoted to rate hikes in response to inflationary pressures, the US, the UK, along with other systemically important central banks held rates unchanged. Within EMDEs, Russia and Brazil cut rates to support growth, while acknowledging that geopolitical tensions could worsen inflation, whereas Philippines raised interest rate due to strong inflationary pressures arising from elevated global oil and fertiliser prices. Indonesia aggressively raised its benchmark rate for the second consecutive month in a bid to anchor inflation and stabilise exchange rate (Chart II.8).
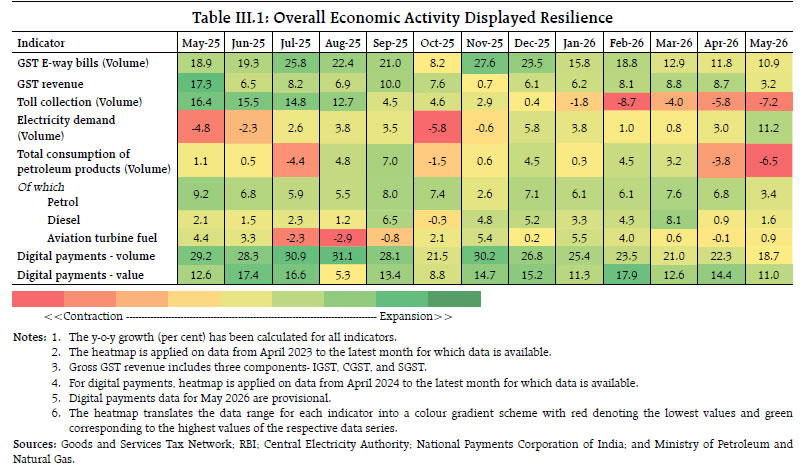
III. Domestic Developments The quarterly estimates of GDP indicated strong growth in the last quarter of 2025-26 despite facing headwinds from the West Asia conflict. The high-frequency indicators for May also suggest buoyant economic activity. Industrial activity remained robust and the services sector showed resilience. Record buffer stocks of rice and wheat are likely to provide cushion against any adverse impact of El Niño. The Monetary Policy Committee (MPC), in its review of June 2026, voted unanimously to keep the policy repo rate unchanged at 5.25 per cent. The MPC continued with the neutral policy stance emphasising the need to wait for greater clarity to assess the unfolding of the West Asia conflict and its spillover effects on the economy as also the risks from a likely sub-normal south-west monsoon and El Niño weather patterns. The provisional accounts of the Union Government for 2025-26 reaffirmed a continued fiscal consolidation with GFD to GDP remaining lower than that of 2024- 25. The provisional accounts of consolidated state government finances, however indicated some slippage for 2025-26. Aggregate Demand The annual real GDP growth accelerated to 7.7 per cent as per the provisional estimates for 2025-26, over 7.1 per cent recorded in 2024-25 (Annex Table 1). The quarterly growth at 7.8 per cent in Q4:2025- 26 displayed a sustained momentum despite the breakout of the West Asia conflict. The strong performance was primarily supported by robust private consumption and double-digit expansion in fixed investment activity. On the external front, net exports contributed positively to real GDP growth (Chart III.1). High-frequency indicators point towards resilience of economic activity in May. E-way bills continued to achieve double-digit growth. Goods and Services Tax (GST) revenue growth moderated sequentially in May after recording strong growth in April.3 While petrol, diesel and aviation turbine fuel consumption recorded a positive growth in May, that of total petroleum products dipped due to a sharp fall in the consumption of LPG, petroleum coke and naphtha.4 Electricity demand clocked a double-digit growth (y-o-y) in May driven by heat wave. The monthly number of toll transactions continued to decline after the introduction of the FASTag Annual Pass scheme in August 2025.5 Digital payments registered steady growth in both value and volume terms (Table III.I). 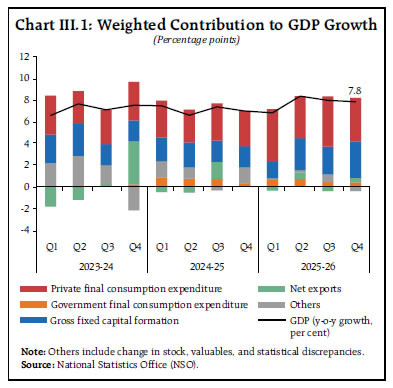
 Domestic demand remained strong in May, supported by pick-up in urban demand. Y-o-y growth in the domestic air passenger traffic recouped in May after contracting for three consecutive months. Growth in passenger vehicle sales accelerated with new product launches and healthy booking. Electric vehicle (EV) penetration increased across vehicle categories.6 On the other hand, the rural demand witnessed some moderation in terms of retail automobile sales (Table III.2). The latest round of Consumer Confidence Survey7 showed a weakening sentiment arising from the evolving macroeconomic conditions besides uncertainties emanating from the ongoing conflict in West Asia. The Current Situation Index in urban areas remained in pessimistic zone driven primarily by deterioration in sentiments with respect to general economic condition, employment scenario and spending. Future Expectations Index also moderated while remaining in optimistic zone. Similar trends were observed for rural areas (Chart III.2). In May, the all-India unemployment rate measured by current weekly status, witnessed an increase driven by rural areas, while the urban unemployment rate declined.8 The labour force participation rate and worker population ratio fell in both rural and urban areas. PMI employment indicators for both manufacturing and services remained healthy in May, although the pace of hiring moderated. It was partly corroborated by the sequential moderation in whitecollar hiring as reflected in Naukri JobSpeak Index. The growth in hiring was driven by gains in insurance, BPO/ITES, and healthcare, while moderation was observed in banking and financial services, telecom, and IT sector. The demand for work under the Mahatma Gandhi National Rural Employment Guarantee Scheme9 (MGNREGS) continued to decline for the eleventh consecutive month (Table III.3).
Government Finances The provisional accounts (PA) of the Central Government for 2025-26 released on June 01, 2026, reaffirmed fiscal consolidation as envisaged in the Union Budget 2026-27. The GFD for 2025-26 stood at 4.4 per cent of GDP, lower than both 2024-25 and the revised estimates (RE) of 2025-26 (Table III.4). The growth (y-o-y) of non-debt total receipts outpaced that of the total expenditure.10 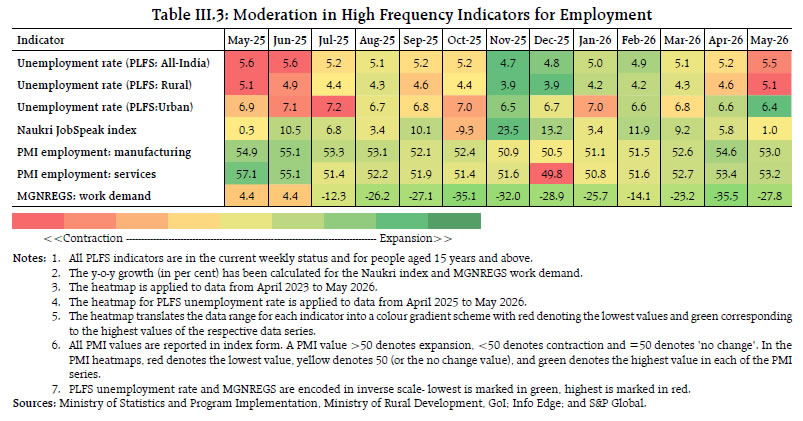
| Table III.4: Key Fiscal Indicators of the Union Government | | (as per cent of GDP) | | Item | 2024-25 Actuals | 2025-26 | 2026-27 BE | | RE | PA | | (1) | (2) | (3) | (4) | (5) | | Gross Fiscal Deficit | 4.9 | 4.5 | 4.4 | 4.3 | | Revenue Deficit | 1.8 | 1.5 | 1.5 | 1.5 | | Primary Deficit | 1.4 | 0.8 | 0.8 | 0.7 | | Gross Tax Revenue | 11.9 | 11.8 | 11.6 | 11.2 | | Non-Tax Revenue | 1.7 | 1.9 | 2.0 | 1.7 | | Total Expenditure | 14.6 | 14.4 | 14.2 | 13.6 | | Revenue Expenditure | 11.3 | 11.2 | 11.1 | 10.5 | | Capital Expenditure | 3.3 | 3.2 | 3.1 | 3.1 | | of which Capital Outlay | 2.7 | 2.6 | 2.5 | 2.4 | Notes: 1. RE: Revised Estimates, PA: Provisional Accounts, and BE: Budget Estimates.
2. GDP used for 2026-27 (BE) is as per Union Budget 2026-27. For 2025-26 (RE), the GDP is as per Second Advance Estimates released by NSO on February 27, 2026. For 2025-26, the GDP used is as per the Provisional Estimates released by NSO on June 05, 2026.
Sources: Controller General of Accounts, Ministry of Statistics and Programme Implementation, and Union Budget documents. | The revenue receipts posted a healthy growth led by expansion of net tax revenue and non-tax revenue.11 Expansion in gross tax revenue was largely driven by double-digit growth in corporation tax, customs duties, and union excise duties.12 Total expenditure (as per cent of GDP) moderated marginally in 2025-26 (PA), as compared to both 2024- 25 actuals and 2025-26 (RE). Revenue expenditure growth accelerated in 2025-26 (PA) over 2024-25 led by higher growth rates in both interest payments and major subsidies.13 Capital expenditure recorded moderate growth in 2025-26 (PA) after five consecutive years of double-digit growth.14 All the key deficit indicators of the Centre as per cent of the budget estimates (BE) were higher in April:2026-27, as compared to April:2025-26.15 The higher GFD was on account of expansion in total expenditure, while the non-debt total receipts contracted in April:2026-27.16 The contraction in revenue receipts was primarily driven by decline in net tax revenue and non-tax revenue.17 The growth in total expenditure was primarily driven by revenue expenditure.18 In contrast to the Centre, the provisional accounts (PA) of State Governments for 2025-26 point to some slippages. The revenue deficit (RD), GFD, and primary deficit (PD), increased compared to the previous year. The rise in the consolidated GFD to gross state domestic product (GSDP) ratio was mainly attributable to slower revenue receipts growth, driven by a shortfall in tax revenue and reduced grants from the Centre. Although revenue expenditure growth moderated, the decline was insufficient to offset the revenue receipts shortfall. Capital expenditure as a per cent of GSDP also declined. For 2026–27, States have budgeted a lower fiscal deficit of 3.0 per cent of GSDP and a higher capital outlay19 (Table III.5). | Table III.5: Key Fiscal Indicators of the State Governments | | (as per cent of GSDP) | | Item | 2024-25 | 2025-26 | 2026-27 | | Accounts | PA | BE | | Revenue Receipts | 12.8 | 12.3 | 13.7 | | Tax Revenue | 10.3 | 9.9 | 10.6 | | Non-Tax revenue | 1.0 | 1.0 | 1.2 | | Grants from the Centre | 1.5 | 1.3 | 1.9 | | Capital Receipts | 0.04 | 0.04 | 0.1 | | Revenue Expenditure | 13.1 | 13.0 | 13.7 | | Of which: Interest Payments | 1.5 | 1.6 | 1.5 | | Capital Expenditure | 2.7 | 2.6 | 3.2 | | Of which: Capital Outlay | 2.5 | 2.4 | 3.0 | | Revenue Deficit | 0.3 | 0.7 | -0.1 | | Gross Fiscal Deficit | 3.0 | 3.3 | 3.0 | | Primary Deficit | 1.4 | 1.7 | 1.4 | Notes: 1. PA: Provisional Accounts, BE: Budget Estimates;
2. Data for 2024-25 (Accounts), and 2026-27 (BE) pertain to 25 States/ UTs.
3. Data for 2025-26 (PA) pertain to 27 States/UTs.
Sources: Budget documents of States, Comptroller and Auditor General (CAG). | Trade In May 2026, merchandise trade deficit widened (y-o-y), but was largely unchanged from April 2026 (Chart III.3).20 The higher deficit (y-o-y) was mainly on account of higher crude oil prices. Import growth in May 2026 was driven by petroleum crude and products; electronic goods; and gold.21 Exports in May 2026, at US$ 45.2 billion, is the highest ever in recent years.22 Apart from higher crude oil prices, which drove petroleum product exports, export diversification also supported export growth.23 While exports to the US remained unchanged y-o-y, exports to China continued to grow in double-digits.24 Following a hike in gold and silver import duty in May 2026, imports of both gold and silver declined in value terms sequentially in May 2026.25
Net services exports recorded a robust growth in April (Chart III.4).26 Services exports were led by software and business services, while services imports grew mainly due to business and transport services. Aggregate Supply The growth remained broad-based from the supply side, with real gross value added (GVA) at basic prices firming up to 7.9 per cent in 2025-26 from 7.3 per cent in the previous year with both industry and services growing at 9.0 per cent each (Annex Table 2). Quarterly real GVA growth remained robust at 7.9 per cent in Q4:2025-26. An expansion across major services sub-sectors and improved agricultural sector performance coming from a strong rabi harvest, helped in sustaining the momentum. In contrast, manufacturing activity exhibited some signs of softening primarily on account of rising energy prices and input cost pressures (Chart III.5). Agriculture The foodgrains production27 for 2025-26, as per third advance estimate, reached 376.6 million tonnes, which was 5.3 per cent higher than the final estimate (FE) for 2024-25, driven by record production of rice, wheat, and maize. Among non-foodgrains, production of oilseeds and sugarcane increased while that of cotton fell (Chart III.6). The production of horticultural crops for 2025-26, as per the second advance estimate, touched a record level of 378 million tonnes, which was 1.9 per cent higher than the FE for 2024-25.28 As per the updated forecast of the India Meteorological Department (IMD) (released on May 29, 2026), the south-west monsoon (SWM) rainfall is likely to be below normal this year.29 The SWM arrived over Kerala on June 04, three days later than the normal date of onset (June 01). While the SWM has covered southern and parts of eastern regions so far, the cumulative rainfall (June 01-21) at the country level has been significantly lower than the normal. The reservoir position has slipped below last year; however, it remains above the decadal average (Chart III.7).
Given the good harvest last year, the public procurement of wheat has been robust.30 The public stock of rice and wheat with the Food Corporation of India (FCI) is well above the buffer norms31 which may serve as a strategic cushion against any supply disruption or spike in prices triggered by a likely El Niño weather phenomenon. Monthly Indicators of Industrial Activity Based on high frequency indicators, industrial activity remained robust, despite ongoing West Asia conflict. The index of eight core industries witnessed an uptick in April, supported by cement and steel production. Manufacturing PMI rose for the second consecutive month in May, driven by faster growth in output and new orders as well as supported by resilient domestic demand. Automobile production registered higher growth (y-o-y) in May as compared to last year, aided by lower GST rates. Electricity generation surged in May driven by higher peak power demand due to severe heat wave conditions. The growth (y-o-y) in IIP, under the new series with revised base year32, strengthened in April as compared to the previous month, led by strong growth in manufacturing sector. However, Index of eight core industries witnessed a moderation in May, driven by refinery products and coal (Table III.6). 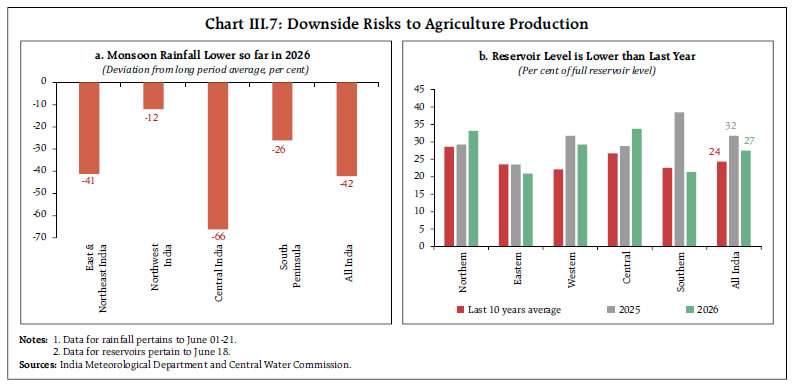 The Pulse Survey conducted by the Reserve Bank during May 202633 shows headwinds for manufacturing activity amidst the West Asia conflict. Over 80 per cent of firms reported an increase in input costs, with a significant proportion indicating adverse impact on production. Profitability was reported to have come under pressure with nearly 70 per cent of the respondents reporting contraction in profit margins (Chart III.8).
India’s solar energy sector continues to expand, supported by strong growth in both installed capacity and electricity generation.34 India has become world’s second-largest solar market35 after China on account of high annual solar energy capacity additions in 2025.36 Under the PM Surya Ghar: Muft Bijli Yojana, a record 3.16 lakh rooftop solar installations were added in May 2026, with the total installations crossing over 33 lakh which has added more than 12 GW of solar power capacity since its inception in February 2024 (Chart III.9). Monthly Indicators of Services Activity India’s services sector remained resilient in May. Services PMI strengthened further in May, supported by healthy demand conditions, and continued rise in new business. Steel consumption strengthened in May, reflecting sustained demand from infrastructure and construction sectors. Port cargo traffic growth (y-o-y) accelerated while international air passenger traffic continued to contract, albeit at a lower rate as compared to the previous month, reflecting weak external demand. Growth in foreign tourist arrivals fell for the second consecutive month in April amidst persistent geopolitical tensions.37 Retail commercial vehicle sales growth moderated (Table III.7).
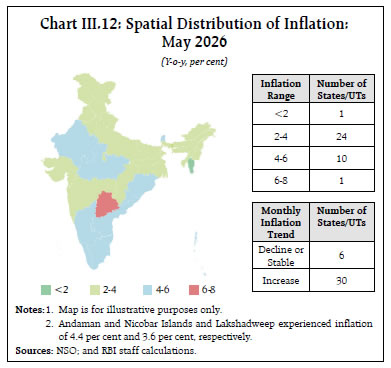
Inflation CPI headline inflation38 inched up sequentially to 3.9 per cent (y-o-y) in May 2026 from 3.5 per cent in the preceding month39 driven by broad-based increases in all the three categories - food & beverages, fuel40 and core41 components. Rise in inflation of food and beverages was across classes/sub-classes, barring pulses. CPI fuel inflation also increased significantly over the previous month on account of rise in retail prices of petrol, diesel and compressed natural gas (CNG)42 [Chart III.10]. Core inflation edged up to 3.9 per cent (y-o-y) in May 2026 from 3.7 per cent in the previous month, primarily driven by precious metals. Excluding precious metals, core inflation inched up to 2.3 per cent from 2.2 per cent during this period, indicating that the underlying price pressures continued to remain contained. The passthrough of higher commercial LPG43 prices, however, led to a pick-up in inflation in the ‘restaurants and accommodation services’. Among all divisions, the inflation in ‘personal care, social protection and miscellaneous goods and services’ remained the highest. Overall, eight out of twelve divisions witnessed a sequential increase in inflation in May (Chart III.11). The increase in inflation was spatially divergent across states.44 Sequential rise was widespread with the inflation ranging from 1.0 per cent to 6.2 per cent, although the majority of the states experienced inflation between 2 per cent and 4 per cent (Chart III.12). Among other factors, the month-on-month price build up in CPI-Food and Beverages during May could also be attributed to seasonal uptrend during summer, which was observed across all classes/sub-classes, except fruits and nuts. This broad-based pick-up in food prices appeared to have continued in June as suggested by the daily prices data available up to June 18. Within foodgrains, prices of rice and wheat as well as major pulses recorded an uptick. Among perishables, prices of major vegetables viz., potato, onion and tomato, edged up further. The month-onmonth increase in the prices of edible oils remained broad-based (Chart III.13). 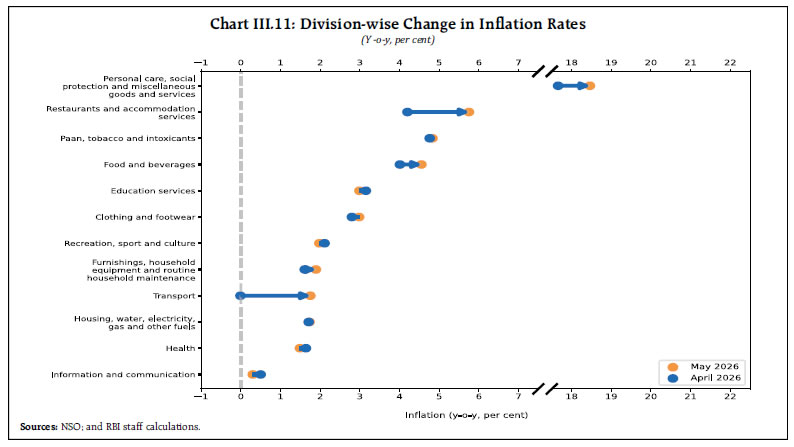
 Amidst the disruptions to global energy supply chains, price of the Indian basket crude oil45 remained elevated despite easing in June from the peak observed in April (Chart III.14).46 Surge in international prices have partially been passed on to retail consumers through upward revisions in prices of petrol and diesel in four tranches in May47 with cumulative increases of around ₹7.5 per litre and ₹7.6 per litre, respectively (Table III.8).
Domestic household LPG prices were increased by ₹29 per 14.2 kg cylinder in June, following ₹60 hike in March 2026. Despite the hike, Indian households continue to pay amongst the lowest cooking gas prices in the world, as the government and oil marketing companies (OMCs) have largely prevented the high international prices from feeding into the expenditure budgets of households (Chart III.15). With this, the OMCs absorb under recoveries of about ₹700 per 14.2 kg cylinder as their cost of supply is more than ₹1600.48 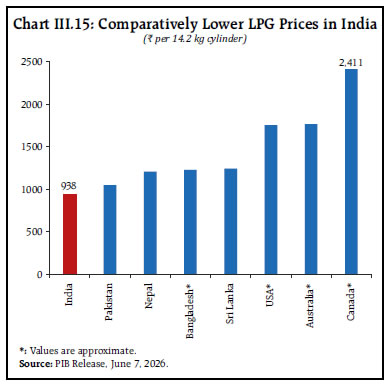
| Table III.8: Retail Prices of Petrol and Diesel Maintained Upward Trajectory | | Item | Unit | Domestic Prices | Month-over-month (per cent) | | Jun-25 | May-26 | Jun-26^ | May-26 | Jun-26^ | | Petrol | ₹/litre | 101.1 | 104.1 | 108.7 | 2.9 | 4.4 | | Diesel | ₹/litre | 90.5 | 93.4 | 98.1 | 3.2 | 5.0 | | Kerosene (subsidised) | ₹/litre | 40.2 | 46.8 | 46.8 | 0.0 | 0.0 | | LPG (non-subsidised and non-commercial) | ₹/cylinder | 863.3 | 923.3 | 942.6 | 0.0 | 2.1 | Note: 1. ^: Updated up to June 18, 2026.
2. Other than kerosene, prices represent the average Indian Oil Corporation Limited (IOCL) prices in four major metros (Delhi, Kolkata, Mumbai and Chennai). For kerosene, prices denote the average of the subsidised prices in Kolkata, Mumbai and Chennai.
Sources: IOCL; Petroleum Planning and Analysis Cell; and RBI staff calculations. | Wholesale Price Index (WPI) (base year 2022-23) inflation rose to 9.7 per cent in May 2026 from 8.3 per cent in the previous month, the highest in the new base series since April 2024. Fuel and power group inflation rose further to 30.3 per cent in May 2026. Manufactured products, with its higher weight, has contributed highest to the total inflation. The industrial49 and farm input50 cost inflation too climbed up to 16.7 per cent and 8.9 per cent in May 2026, respectively, from deflationary territory in February. On June 15, 2026, the Office of Economic Adviser, Department for Promotion of Industry and Internal Trade released the new series (base year 2022-23) of the Output Producer Price Index (OPPI), a trial Input Producer Price Index (IPPI), and a Service Producer Price Index (SPPI) covering seven services.51 Output PPI inflation increased to 9.4 per cent (y-o-y) in May from 8.1 per cent in April (base year 2022-23), primarily driven by ‘manufactured products’ and ‘agriculture, forestry and fishing’. The PMI for input prices for Indian manufacturing firms in May remained broadly stable but at elevated level reflecting high cost of energy, fuel, raw materials and transportation. Despite heightened cost pressures, the rate of expansion of output price PMI for manufacturing firms moderated in May, suggesting a potential squeeze in profit margins.52 In the services sector, the PMI for both output and input prices moderated sequentially while remaining in the expansionary zone (Chart III.16). IV. Financial Conditions Surplus liquidity conditions53 moderated in May amidst continued rise in currency in circulation, Reserve Bank’s forex operations and buildup of government cash balances.54 The Reserve Bank undertook steps to infuse both durable and transient liquidity.55 The surplus liquidity further moderated in June (up to 18th).56 The use of standing deposit facility declined in June (Chart IV.1).57 Going ahead, the drawdown of government cash balances is expected to augment system liquidity following the Reserve Bank’s surplus transfer.58 Money Market The WACR hovered around the policy rate in May 2026. With moderation in surplus liquidity in late May and June (up to 18th), the WACR inched up and remained in the upper half of the policy corridor (Chart IV.2a).59 Overnight rates in the collateralised segments, as measured by the secured overnight rupee rate, generally moved in tandem with the WACR. The average yields on treasury bills hardened during May but eased in June (up to 18th). The yields on CPs and CDs firmed up in May amidst higher demand for funds, though they moderated in June (up to 18th) with availability of funds from cheaper alternative avenues (Chart IV.2b).60 The spread between yield on the 3-month CP and 91-day treasury bill widened.61
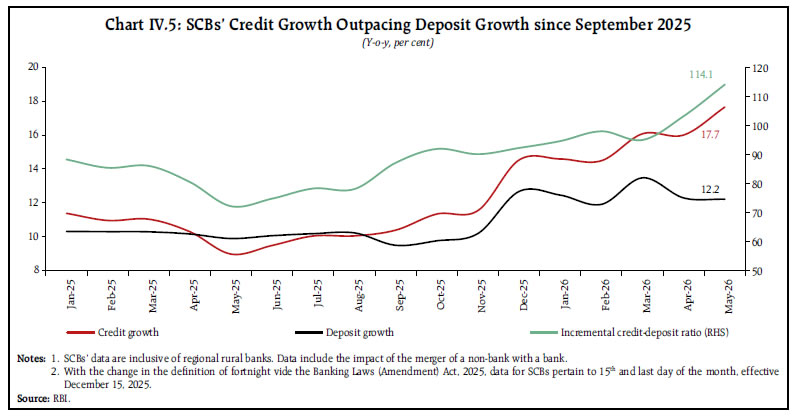
Government Securities Market The government security (G-sec) yields reflected global developments (Chart IV.3a). After easing in April, the yields firmed up in May as negotiations stalled in West Asia. G-sec yields have, however, softened after the Government and the Reserve Bank took measures to attract foreign capital. The recent announcement of the peace deal in West Asia also had a moderating impact (Chart IV.3b).62 Corporate Bond Market Corporate bond yields moderated across tenors and rating spectrums in June (on 18th) over May (on 29th), tracking government bond yields, while the spreads edged up63 (Table IV.1). New corporate bond issuances decreased in April 2026 over the previous month.64 Money and Credit During May 2026, reserve money (adjusted for cash reserve ratio) growth declined marginally, though currency in circulation maintained its double-digit growth, seen since December 2025.65 The money supply growth also remained elevated (Chart IV.4).66 The acceleration in credit growth and flat deposit growth in scheduled commercial banks (SCBs) led to widening of the wedge between credit and deposit growth in May (Chart IV.5).67 | Table IV.1: Corporate Bond Yields Moderated | | | Interest Rates
(Per cent) | Spread
(Over corresponidng risk-free rate, bps) | | Instrument | May 29, 2026 | June 18, 2026 | Variation (bps) | May 29, 2026 | June 18, 2026 | Variation | | 1 | 2 | 3 | (4 = 3-2) | 5 | 6 | (7 = 6-5) | | (i) AAA (1-year) | 7.89 | 7.54 | -35 | 189 | 173 | -16 | | (ii) AAA (3-year) | 7.75 | 7.52 | -23 | 109 | 125 | 16 | | (iii) AAA (5-year) | 7.76 | 7.43 | -33 | 77 | 79 | 2 | | (iv) AA (3-year) | 8.58 | 8.29 | -29 | 192 | 202 | 10 | | (v) BBB minus (3-year) | 12.19 | 11.90 | -29 | 553 | 563 | 10 | | Source: Fixed Income Money Market and Derivatives Association of India. | During 2026-27 so far (up to May 31), the total flow of financial resources to the commercial sector increased, driven by a pickup in non-food bank credit and rise in foreign direct investment to India68 (Table IV.2a). Non-food bank credit growth stood higher than the previous year (as on May 31), leading to higher total outstanding credit (Table IV.2b). Bank credit continued to record double digit growth across major sectors in April 2026.69 Strong industrial credit growth is attributed to sustained credit growth in MSMEs and pick up in credit to large industries. Credit flow to the services sectors remained buoyant driven by bank lending to non-banking financial companies (NBFCs), trade and commercial real estate. Within personal loans, credit to housing, vehicle and gold loans displayed steady growth (Chart IV.6). 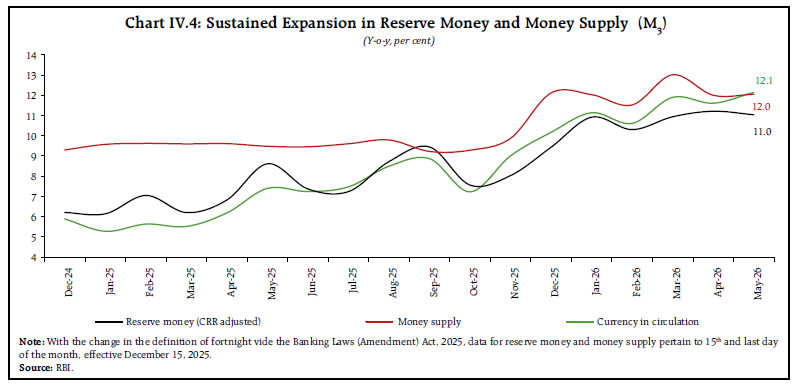
| Table IV.2a: Flow of Financial Resources to Commercial Sector in India | | (₹ lakh crore) | | Source | April-March | Up to May 31 | | 2024-25 | 2025-26 | 2025-26 | 2026-27 | | A. Non-Food Bank Credit | 18.08 | 29.19 | -1.55 | 0.88 | | B. Non-Bank Sources (B1+B2) | 18.15 | 17.69 | 1.90 | 1.94 | | B1. Domestic Sources | 14.91 | 12.66 | 1.27 | 0.80 | | B2. Foreign Sources | 3.25 | 5.03 | 0.63 | 1.14 | | C. Total Flow of Resources (A+B) | 36.23 | 46.88 | 0.35 | 2.82 | Notes: 1. Figures in the columns might not add up to the total due to rounding off of numbers.
2. For detailed notes and data, please refer to Current Statistics Table No: 18(a).
Sources: RBI; SEBI (Securities and Exchange Board of India); AIFIs (All India Financial Institutions); and RBI staff calculations. | Deposit and Lending Rates Transmission of the past policy rate reductions to the credit market moderated during March-April 2026, with some hardening observed in deposit and lending rates70 (Table IV.3). Transmission to the lending rates on fresh and outstanding loans has remained uneven across sectors (Chart IV.7). During the current easing cycle (February 2025–April 2026), the pass-through to lending rates was more pronounced in private sector banks, while public sector banks exhibited relatively stronger transmission to deposit rates (Chart IV.8). | Table IV.2b: Outstanding Credit to the Commercial Sector | | (₹ lakh crore; Figures in parentheses are y-o-y changes in per cent) | | Source | At End-March | As on May 31 | | 2025 | 2026 | 2025 | 2026 P | | A. Non-Food Bank Credit | 183.72 | 212.91 | 182.17 | 213.79 | | | (10.9) | (15.9) | (8.8) | (17.4) | | B. Non-Bank Sources (B1+B2) | 88.86 | 101.59 | 89.99 | 102.24 | | | (14.6) | (14.3) | (15.2) | (13.6) | | B1. Domestic Sources | 66.37
(17.3) | 75.11
(13.2) | 67.23
(17.7) | 75.80
(12.8) | | B2. Foreign Sources | 22.49
(7.2) | 26.48
(17.7) | 22.76
(8.3) | 26.45
(16.2) | | C. Total Credit (A+B) | 272.58
(12.1) | 314.50
(15.4) | 272.16
(10.8) | 316.04
(16.1) | P: Provisional.
Notes: 1. Figures in the columns might not add up to the total due to rounding off of numbers.
2. Data on non-bank sources excludes issuances of equities and hybrid instruments under domestic sources and foreign direct investment in equities under foreign sources.
3. Flows based on outstanding data may not tally with the flows provided in Table IV.2a due to:
(a) Conversion of some housing finance companies into nonbanking financial companies; and
(b) Valuation effect in case of foreign sources.
4. For detailed notes and data, please refer to Current Statistics Table No: 18(b).
Sources: RBI; SEBI; AIFIs; and RBI staff calculations. | 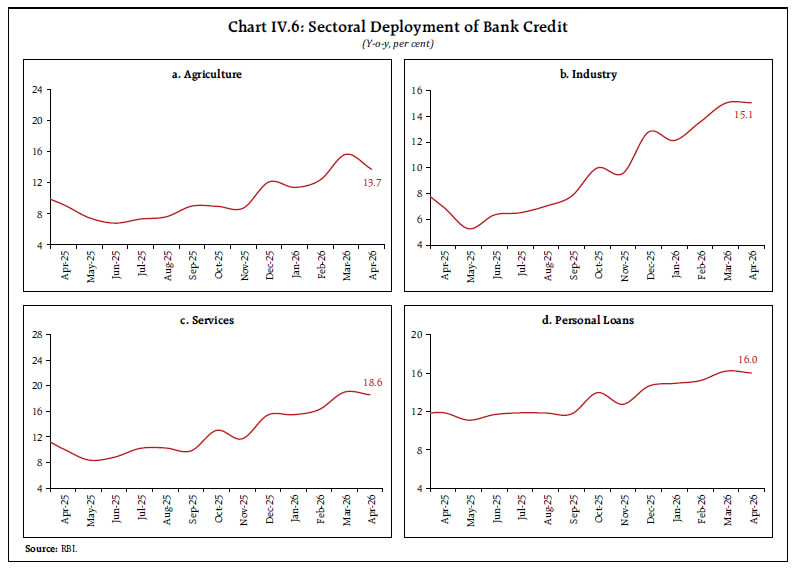
| Table IV.3: Transmission to Banks’ Deposit and Lending Rates | | (Basis points) | | | | Term Deposit Rates | Lending Rates | | Period | Repo Rate | WADTDR-Fresh Deposits | WADTDR-Outstanding Deposits | EBLR | 1-Year MCLR (Median) | WALR - Fresh Rupee Loans | WALR-Outstanding Rupee Loans | | Overall | Interest Rate Effect# | | (1) | (2) | (3) | (4) | (5) | (6) | (7) | (8) | (9) | | Tightening Cycle May 2022 to Jan 2025 | 250 | 259 | 206 | 250 | 175 | 182 | 191 | 115 | | Easing Cycle Feb 2025 to Apr 2026 | -125 | -85 | -50 | -125 | -45 | -83 | -83 | -89 | #: Calculated at January 2025 weights.
WALR: Weighted average lending rate; WADTDR: Weighted average domestic term deposit rate;
MCLR: Marginal cost of funds-based lending rate; EBLR: External benchmark-based lending rate.
Note: Data on EBLR pertain to 32 domestic banks.
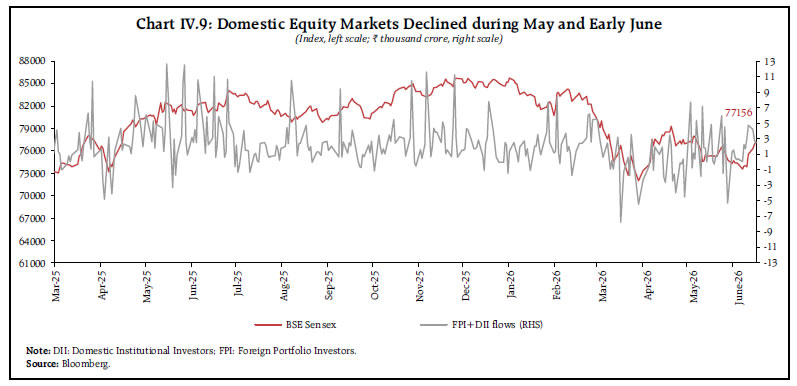
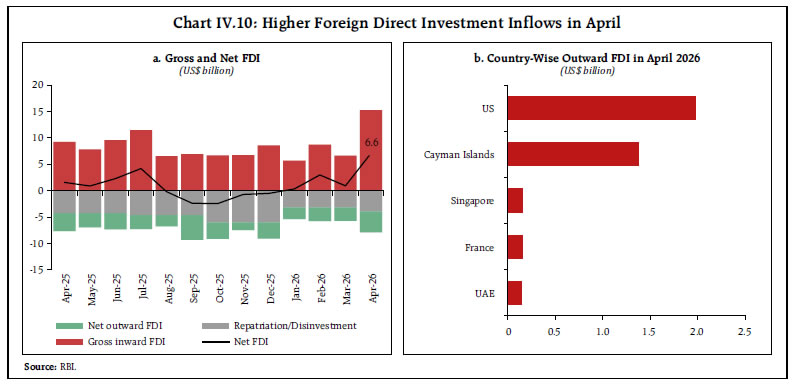
Source: RBI. | Equity Markets Indian equity markets recorded decline in May and early June amidst uncertainty surrounding the US-Iran peace agreement, elevated crude oil prices, and the IMD’s forecast of below normal monsoon. However, markets recovered in mid-June supported by positive developments surrounding the USIran peace talks and moderation in crude oil prices (Chart IV.9).71 External Sources of Finance During April 2026, net FDI remained above its corresponding level during the previous year, supported by higher gross inflows and lower repatriation (Chart IV.10a).72 Financial services received the largest equity inflows, followed by retail and wholesale trade, manufacturing and computer services, with these four sectors accounting for more than 80 percent of the total inflows. Source wise, more than 75 per cent of the FDI flows came from Japan, Singapore and Mauritius. As regards outward FDI, around 80 per cent of the flows were directed to the US and the Cayman Islands (Chart IV.10b). Financial, insurance and business services, and manufacturing sector accounted for more than 90 per cent of the outward flows. 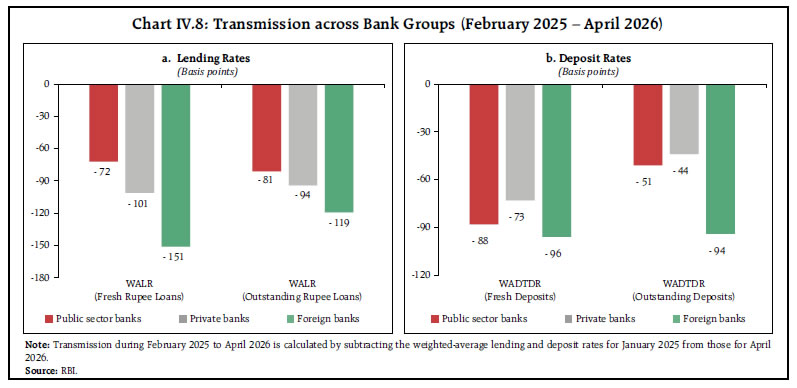
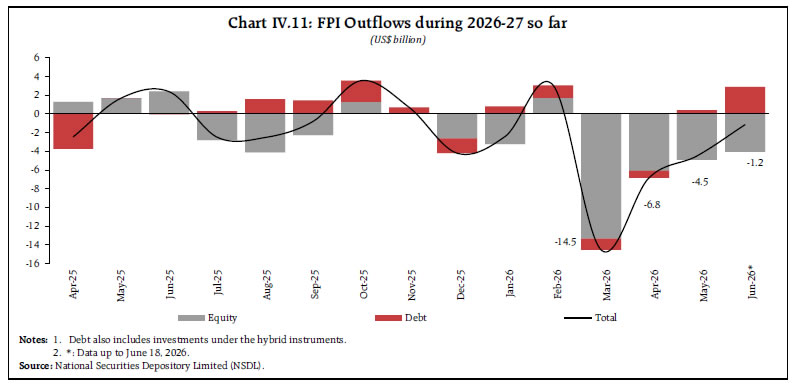 During 2026–27 (up to June 18), net FPI continued to register outflows, although the pace moderated (Chart IV.11).73 Net FPI flows have turned largely positive since the second week of June, likely driven by the supportive policy measures undertaken by the Reserve Bank and the Government along with easing of West Asia tensions.74 In Q4:2025-26, India’s current account registered a surplus of US$ 7.1 billion, owing to higher net services receipts and robust inward remittances (Chart IV.12).75
For the full year 2025-26, the current account deficit increased marginally as compared to the previous year.76 Net capital inflows fell short of financing the current account deficit as net FDI inflows were offset by higher FPI outflows. This led to a depletion of US$ 23.6 billion of foreign exchange reserves (on a balance of payment basis) in 2025-26. External commercial borrowings (ECB) registrations increased in April 2026 as compared to the corresponding period of previous year, reflecting an improvement in offshore fund-raising activity.77 Net ECB inflows in April rose sequentially but remained significantly lower than the corresponding period last year (Chart IV.13).78 Around 24 per cent of the ECBs registered in April were intended for capital expenditure. India’s foreign exchange reserves remained comfortable, providing cover for goods imports of more than 10 months79 and 87.7 per cent of the external debt outstanding as at end-December 2025 (Chart IV.14). Foreign Exchange Market The Indian rupee (INR) remained under pressure in May amidst protracted geopolitical tensions and continued foreign portfolio outflows. However, INR recovered in June 2026, owing to capital flow measures, easing geopolitical tensions and falling crude oil prices.80 During 2026-27 so far (up to June 19), INR appreciated by 0.2 per cent over end-March 2026 (Chart IV.15). In real effective terms, the Indian rupee depreciated in May, driven by pronounced depreciation of INR in nominal effective terms, which outweighed the offsetting effect of India’s relatively higher inflation vis-à-vis its major trading partners (Chart IV.16).
V. Conclusion The global economic landscape remains fragile despite some respite gained through the interim US-Iran peace agreement. Any breakdown of the agreement may reignite material risks in terms of inflationary expectations, disrupted critical energy infrastructure, delayed investment spending, food security concerns, adverse financial stability outlook and structurally lower growth. The uncertainties could have impact on the outlook through international trade, cost pressures, capital flows and commodity prices. The Indian economy entered this turbulence with much better fundamentals relative to many other countries to sustain the shock. India maintained a consistently high growth, anchored inflation expectations, sustained fiscal consolidation, manageable current account balance and foreign exchange buffers over the previous few years, which adds to its strength vis-à-vis similar other events in the past. An adverse south-west monsoon, if materialised, may weigh on the domestic growth-inflation outlook.
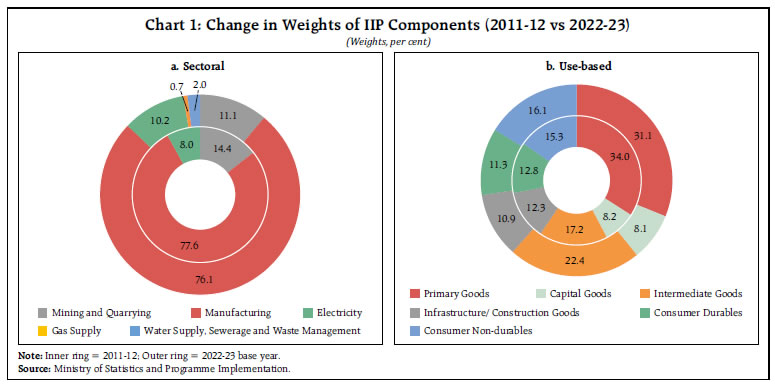
Annex Box 1: New Series of the Index of Industrial Production: Salient Features The IIP data for April 2026 has been released by the National Statistics Office (NSO) with the revised base year of 2022–23 which is aligned with the new GDP series. The new series adopts the latest National Industrial Classification (NIC) 2025 classification, replacing NIC 2008, and updates sectoral weights using GVA at current prices for 2022–23 and item weights from the Annual Survey of Industries (ASI) 2022–23. The coverage of the index has been expanded with the inclusion of Gas Supply and Water Supply, Sewerage and Waste Management activities. The mining basket has been widened from 29 to 44 items, including rare earth and minor minerals. The item basket has increased from 407 to 463 items, adding products such as CCTV cameras, stents and vaccines while removing obsolete items like kerosene and Compact Fluorescent Lamps (CFLs). The revised series assigns greater weight to technology and consumption-oriented sectors such as motor vehicles, pharmaceuticals, and electronics, while reducing the importance of traditional sectors like mining, petroleum refining and basic metals. Under the use-based classification, the share of intermediate goods has increased, indicating more integrated manufacturing value chains (Chart 1). While the overall trend in industrial activity remains similar, the revised headline index records stronger annual growth by incorporating emerging industries and production patterns, with better assessment of industrial structure and its transformation (Table 1). | Table 1: Growth in Index of Industrial Production - Base 2022-23 vis-à-vis Base 2011-12 | | (Y-o-y, per cent) | | | 2023-24 | 2024-25 | 2025-26 | | Base: 2022-23 | 6.7 | 6.4 | 4.3 | | Base: 2011-12 | 5.9 | 4.0 | 4.1 |
| Annex Table 1: Real GDP Growth (at 2022-23 prices) | | (Y-o-y growth, per cent) | | Components | Share in 2025-26
(per cent) | Weighted Contribution
(percentage points) | 2024-25 | 2025-26 | 2023-24 (FE) | 2024-25 (FRE) | 2025-26 (PE) | | 2023-24 | 2024-25 | 2025-26 | Q1 | Q2 | Q3 | Q4 | Q1 | Q2 | Q3 | Q4 | | I. Total | | | | | | | | | | | | | | | | | Consumption | 65.8 | 3.4 | 3.9 | 4.9 | 6.3 | 5.8 | 6.2 | 5.3 | 8.2 | 7.1 | 7.6 | 6.8 | 4.9 | 5.9 | 7.4 | | Expenditure | | | | | | | | | | | | | | | | | Private | 55.7 | 3.3 | 3.3 | 4.3 | 6.1 | 5.6 | 6.0 | 5.6 | 8.7 | 7.2 | 8.2 | 7.1 | 5.8 | 5.8 | 7.7 | | Government | 10.1 | 0.1 | 0.7 | 0.6 | 7.5 | 7.0 | 7.6 | 3.6 | 5.8 | 6.6 | 4.6 | 4.9 | 0.6 | 6.5 | 5.5 | | II. Gross Capital Formation | 34.5 | 3.0 | 2.1 | 2.7 | 5.9 | 7.7 | 6.3 | 4.5 | 4.2 | 6.8 | 8.1 | 11.4 | 8.7 | 6.1 | 7.7 | | Fixed Investment | 32.3 | 2.3 | 2.1 | 2.6 | 6.5 | 6.6 | 6.3 | 6.2 | 4.9 | 8.4 | 8.2 | 10.8 | 7.3 | 6.4 | 8.2 | | III. Net Exports | -1.5 | 0.4 | 0.2 | 0.1 | -15.5 | -13.8 | 63.9 | 1.8 | -10.2 | 14.9 | -45.0 | 55.4 | 17.0 | 8.6 | 4.1 | | Exports | 22.2 | 0.2 | 1.5 | 1.4 | 7.3 | 3.1 | 10.5 | 5.4 | 6.6 | 9.7 | 5.8 | 3.7 | 0.7 | 6.6 | 6.3 | | Imports | 23.7 | -0.3 | 1.3 | 1.4 | 8.3 | 4.6 | 2.9 | 5.5 | 7.0 | 6.0 | 7.2 | 1.9 | -1.0 | 5.3 | 5.6 | | GDP | 100.0 | 7.2 | 7.1 | 7.7 | 7.5 | 6.6 | 7.4 | 7.0 | 6.8 | 8.3 | 8.0 | 7.8 | 7.2 | 7.1 | 7.7 | FE: Final Estimates; FRE: First Revised Estimates; PE: Provisional Estimates
*: Component-wise contributions to growth may not add up to GDP growth, as change in stock, valuables and discrepancies are not included.
Source: NSO. |
| Annex Table 2: Real GVA Growth (at 2022-23 prices) | | (Y-o-y growth, per cent) | | Sectors | Share in 2025-26
(per cent) | Weighted Contribution
(percentage points) | 2024-25 | 2025-26 | 2023-24 (FE) | 2024-25 (FRE) | 2025-26 (PE) | | 2023-24 | 2024-25 | 2025-26 | Q1 | Q2 | Q3 | Q4 | Q1 | Q2 | Q3 | Q4 | | I. Agriculture and allied activities | 17.8 | 0.5 | 0.8 | 0.6 | 2.6 | 4.1 | 5.8 | 3.8 | 4.4 | 2.7 | 1.7 | 3.6 | 2.6 | 4.2 | 3.0 | | II. Industry | 20.5 | 2.2 | 1.7 | 1.8 | 9.6 | 4.6 | 9.7 | 10.8 | 7.9 | 11.0 | 10.7 | 6.8 | 11.3 | 8.7 | 9.0 | | Mining and quarrying | 2.1 | 0.1 | 0.2 | 0.1 | 11.9 | 8.3 | 13.1 | 12.9 | 4.5 | 6.1 | 4.7 | 5.4 | 2.4 | 11.7 | 5.2 | | Manufacturing | 16.1 | 1.9 | 1.4 | 1.7 | 9.4 | 4.9 | 10.8 | 11.8 | 10.4 | 12.7 | 12.8 | 7.3 | 12.7 | 9.3 | 10.7 | | Electricity, gas, water supply and other utility services | 2.3 | 0.3 | 0.1 | 0.0 | 9.2 | -0.2 | 0.6 | 2.1 | -2.0 | 3.6 | 1.5 | 4.1 | 10.7 | 2.9 | 1.7 | | III. Services | 61.8 | 4.5 | 4.7 | 5.5 | 8.5 | 7.8 | 7.9 | 7.0 | 7.6 | 9.2 | 9.4 | 9.7 | 7.4 | 7.8 | 9.0 | | Construction | 9.1 | 0.9 | 0.7 | 0.7 | 8.7 | 6.1 | 6.4 | 8.0 | 5.3 | 8.9 | 6.7 | 8.4 | 9.9 | 7.3 | 7.4 | | Trade, hotels, transport, communication, and services related to broadcasting | 14.4 | 1.4 | 0.9 | 1.5 | 6.9 | 6.6 | 6.7 | 6.3 | 9.7 | 10.5 | 11.2 | 12.5 | 10.1 | 6.6 | 11.0 | | Financial, real estate and professional services | 26.1 | 1.4 | 2.5 | 2.7 | 10.3 | 10.0 | 11.1 | 8.8 | 9.2 | 10.3 | 11.6 | 10.4 | 5.5 | 10.0 | 10.4 | | Public administration, defence and other services | 12.1 | 0.9 | 0.6 | 0.6 | 6.9 | 6.0 | 4.4 | 3.2 | 4.0 | 5.4 | 4.9 | 5.8 | 6.8 | 5.0 | 5.0 | | IV. GVA at basic prices | 100.0 | 7.2 | 7.3 | 7.9 | 7.6 | 6.5 | 7.8 | 7.1 | 7.1 | 8.6 | 8.0 | 7.9 | 7.2 | 7.3 | 7.9 | FE: Final Estimates; FRE: First Revised Estimates; PE: Provisional Estimates
Sources: NSO; and RBI staff calculations. | |
|