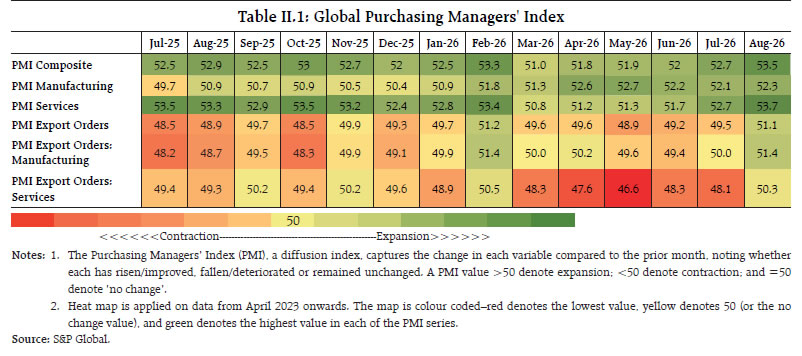
With geopolitical tensions re-escalating in West Asia, the global economy is again confronted with rising energy prices, and increased volatility across various segments of the financial markets. Notwithstanding the ongoing global turbulence, the Indian economy recorded robust growth of 7.8 per cent in Q1:2026-27. The economy also demonstrated resilience through August as evident from high frequency indicators. Supported by strong export growth, the merchandise trade deficit narrowed. Headline inflation inched up to 4.8 per cent in August, driven by the food and beverages group along with a pickup in fuel and core components. System liquidity surplus surged following FCNR(B) deposit flows. A moderate current account deficit in Q1:2026-27 and strong FDI flows supported the external sector, and foreign exchange reserves reached an all time high. Introduction The global economy continues to be marred by geopolitical tensions, trade fragmentation, disruptions in energy supplies, and generalised cost pressures, which are weighing on the financial markets and business confidence. The re-escalation of conflict in West Asia has driven energy prices sharply higher, leading to inflationary concerns across advanced and emerging market economies. High level of sovereign debt and huge investment in AI infrastructure have led to a sharp rise in sovereign yields across markets. Elevated inflation prompted some major central banks to raise policy rates. Commodity prices rose from August to September (so far). Amidst these headwinds, global economic activity—reflected in the composite Purchasing Managers’ Index (PMI)— expanded to a 27-month high in August. Global equity markets revived in August on the back of strong corporate earnings, gains in technology stocks, and lower expectations of near-term monetary tightening. However, markets turned volatile in September driven by the US Fed rate hike, and fresh bout of geopolitical tensions which pushed oil prices higher and raised inflationary concerns. The US Federal Reserve’s policy rate hike exerted upward pressure on US Treasury yields in September so far (till 21st), despite the announcement of larger long-end buybacks intended to provide temporary relief. The US dollar index weakened in August and early September, supporting emerging market currencies. Subsequently, it strengthened, supported by safe haven demand and the US Fed’s hawkish stance. Foreign portfolio inflows to emerging markets remained positive for the second consecutive month in August, amidst demand for emerging market debt despite higher long-term US Treasury yields. The ongoing conflict continued to weigh on the balance between growth and inflation, prompting some central banks to hike rates, while others held steady and remianed watchful of the incoming data. The Indian economy posted a robust growth of 7.8 per cent during Q1:2026-27— the first quarter after the outbreak of conflict in West Asia—driven by domestic consumption and investment. Despite persistent geopolitical challenges, high-frequency indicators through August reflected strong demand conditions. While industry and services displayed resilience, the agriculture sector progressed well marked by kharif sowing nearing completion amidst a weak progress in monsoon. Headline consumer price index (CPI) inflation increased in August 2026, driven by the food and beverages group along with a pickup in fuel and core (CPI excluding food and fuel) inflation. During April-July 2026-27, the gross fiscal deficit of both Union and State governments—as a percentage of full-year budget estimates—turned lower than those in the corresponding period of the previous year reflecting moderation in the revenue deficit. System liquidity remained in surplus in August and surged further in the first half of September as banks tapped Reserve Bank’s Foreign currency non-resident (Bank) [FCNR(B)] swap facility, before moderating later in the month on account of tax related outflows. The weighted average call rate (WACR) traded in the lower half of the liquidity adjustment facility (LAF) corridor. While the yield on 3-month Treasury Bill remained range-bound, yields on commercial papers and certificates of deposit displayed significant moderation before rebounding later in September. The G-sec yields hardened since mid-August amidst renewed global turmoil and rising US Treasury yields. Money supply growth accelerated in August on account of rapid increase in aggregate deposits. Credit growth maintained its momentum while deposit growth picked up. Indian equity markets remained subdued in August and September as geopolitical tensions and elevated bond yields weighed on investor sentiment. Merchandise export growth remained strong and trade deficit declined in August 2026. Services exports too maintained buoyancy. The current account deficit remained moderate in Q1:2026-27, supported by robust services exports and remittance flows. foreign direct investment (FDI) flows strengthened in July with net FDI reaching its highest monthly level in five years. Net inflows under non-resident deposits rose sharply. Various capital flow measures announced in June supported the accumulation of foreign exchange reserves, which rose to US$ 765.9 billion as on September 18, 2026. foreign portfolio investment (FPI)’s registered net outflows in September, after witnessing inflows in August, on re-escalation of the West Asia crisis and rising global bond yields. The remainder of the article is presented in four sections. Section II covers the evolving developments in the global economy. Section III provides an assessment of domestic macroeconomic conditions. Section IV presents the financial conditions prevailing in India, while Section V offers concluding observations. II. Global Setting Global uncertainty increased during August and September (till 21st) amidst renewed geopolitical tensions, heightened trade policy risks, and concerns over global economic prospects (Chart II.1a). Though financial market volatility eased in August, it rose in September in emerging market economies (EMEs), reflecting fresh geopolitical tensions and rate hike by major advanced economies (AEs), including the US, while it remained broadly contained in the US and the Euro area (Chart II.1b). With no let-up in the West Asia tensions, daily transit calls and crude volumes through the Strait of Hormuz continued to remain low and below the pre-conflict levels in September (Chart II.2). Global economic activity, as reflected in the composite PMI, accelerated to a 27-month high in August. The services PMI expanded to a 20-month peak, higher than its manufacturing counterpart for the second consecutive month, supported by business segments such as consumer and financial services. The index for new export orders entered the expansionary zone for the first time since February, following an improvement in both manufacturing and services sectors (Table II.1).1 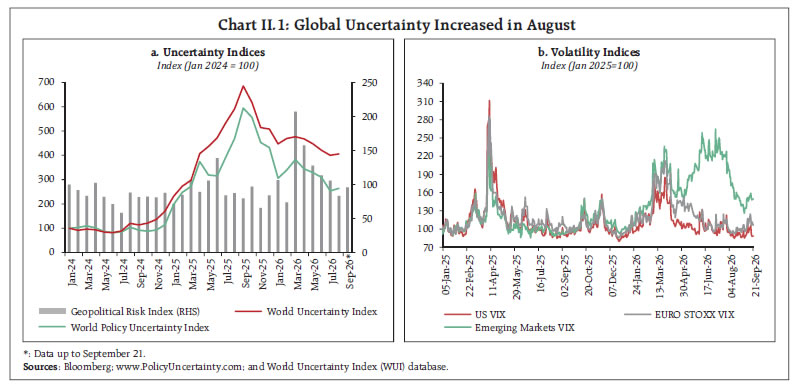 The business activity expanded generally at a faster pace in August in AEs than in EMEs. All major AEs, including the US, the UK, the Eurozone, and Japan, recorded expansion.2 Amongst major EMEs, India and China significantly outperformed the others, while Brazil continued to record contraction (Chart II.3a). New export orders recovered to expansionary territory in the US and the Eurozone, while the UK registered a contraction. Among major EMEs, India and China continued to record expansion in export orders (Chart II.3b). 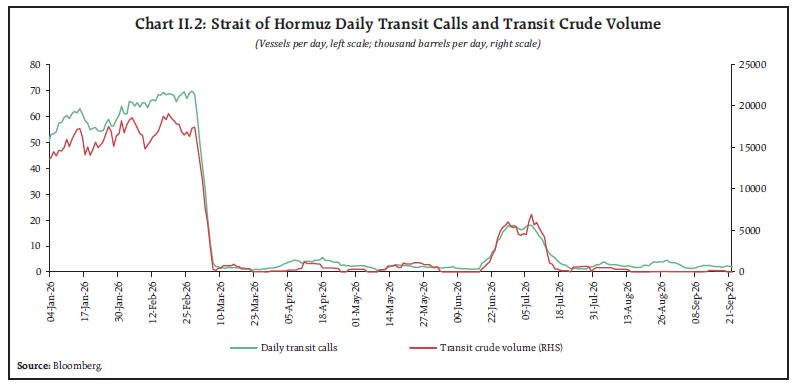
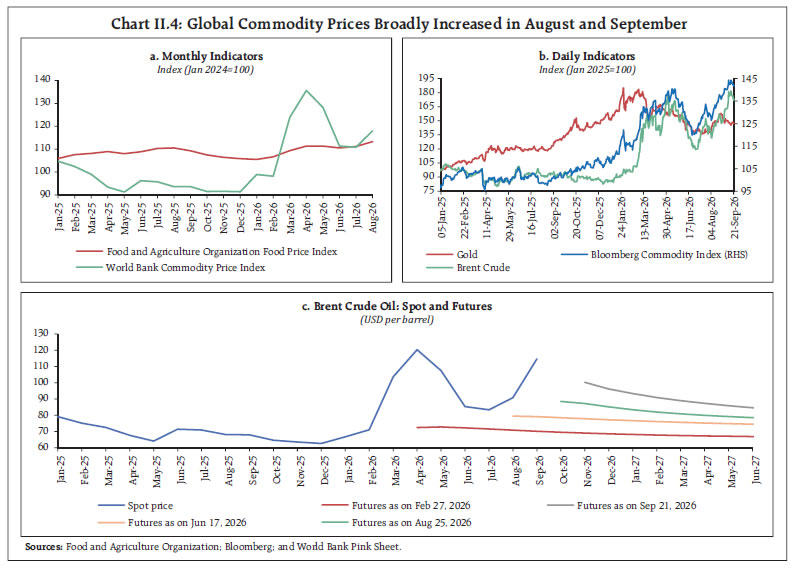
 Commodity prices broadly increased in August and September (till 21st). The Food Price Index of the Food and Agriculture Organization (FAO) for August pointed to a broad-based increase in food prices. The World Bank Commodity Price Index also picked-up, driven by higher energy, agriculture, and metal prices (Chart II.4a). Brent crude oil prices, reflecting the fast-changing geopolitical developments, remained volatile - declining in late August before firming up sharply to above USD 100 per barrel in September (Chart II.4b and II.4c). After a safe haven rise in August, gold prices remained broadly range bound in September, as higher US Treasury yields and a stronger US dollar exerted downward pressure, while continued central bank purchases for reserve diversification provided support (Chart II.4b and II.5). 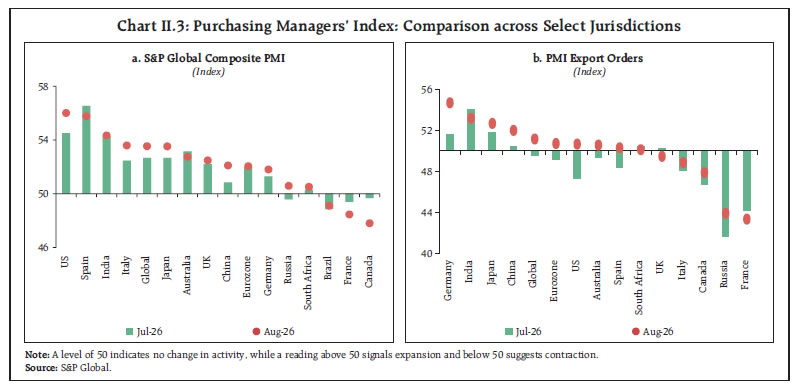
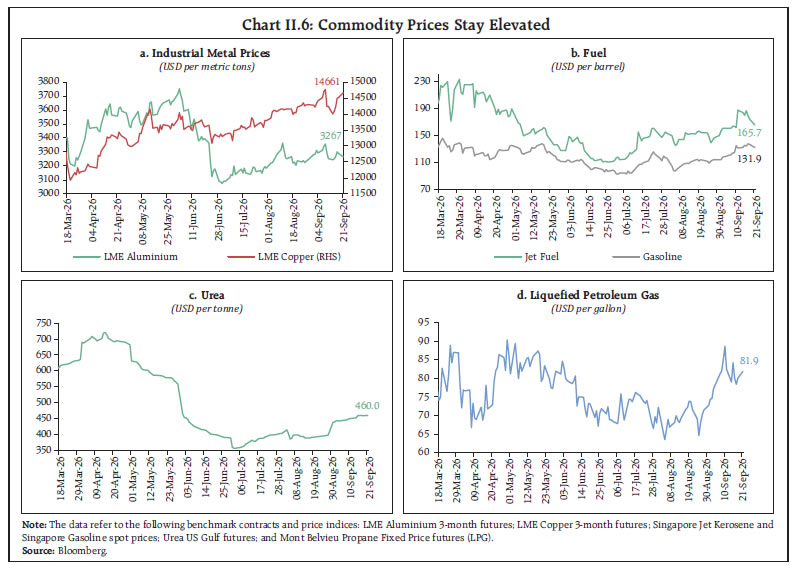
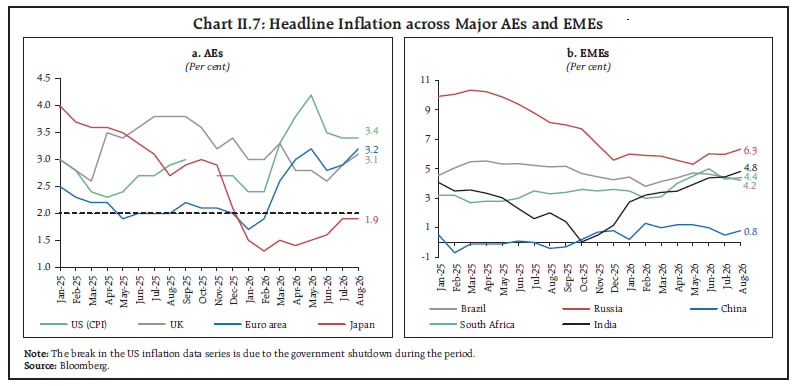
 After easing in late August, aluminium prices firmed in early September over heightened supply disruption risks amidst the re-escalation of West Asia hostilities and seasonal demand. The metal price moderated later amidst expectations of improving supply from smelter restarts and ramping up of production capacity. Copper prices surged to a record high amidst concerns over declining inventories, tight supply conditions and potential US tariffs (Chart II.6a). Jet fuel and gasoline prices also increased in August as sustained damage to refining capacity in the Gulf region and a drop in jet-fuel shipments through key regional chokepoints kept the markets tight (Chart II.6b). Urea prices surged amidst tight supply, strong demand, and higher natural gas prices in Europe (Chart II.6c). LPG prices stayed elevated on supply concerns, following the renewed tensions in West Asia (Chart II.6d). Inflation across most major AEs and EMEs remained above target in August. In the Euro area, inflation accelerated in August, driven by higher energy prices. In the UK, inflation rate rose, mainly driven by a surge in transportation costs. Inflation in the US remained unchanged, as higher gasoline prices offset easing price pressures in other components. Japan’s inflation rate also remained unchanged and stayed below target (Chart II.7a). Among major EMEs, inflation rose in Russia, reflecting broad-based price pressures across food and non-food items, and services. Inflation in China edged higher, driven by energy and seasonal increase in food prices. South Africa’s inflation rate also increased marginally, mainly driven by increase in transportation costs. In contrast, inflation in Brazil declined, primarily due to a temporary reduction in household electricity tariffs (Chart II.7b). 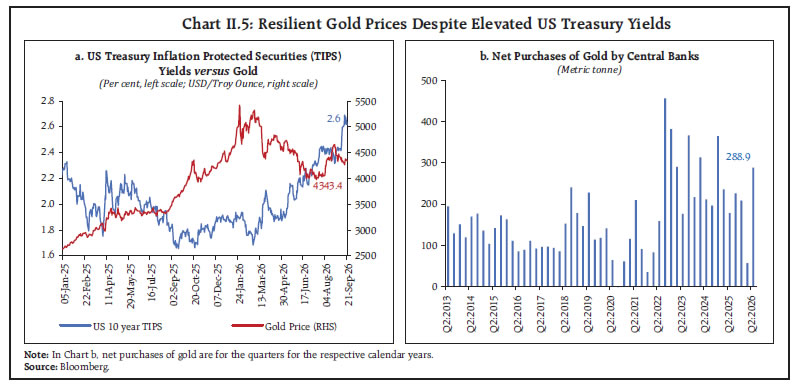
 Global equity markets revived in August, supported by strong corporate earnings, gains in technology stocks and reduced expectations of near-term monetary tightening. Among major AEs, the US S&P 500 gained in August, backed by AI-related stocks. Euro area equities (STOXX 600) remained largely range-bound as resilient earnings and economic activity were somewhat offset by exposures to geopolitical risks, elevated energy prices and monetary policy uncertainty. In Japan, the Nikkei gained, supported by strong corporate earnings, gains in the technology and semiconductor stocks, and a weaker yen. Emerging market equities also gained, supported by Asian equities and continued technology/semiconductor related business optimism. However, markets turned volatile in September driven by the US Fed rate hike, and fresh bouts of geopolitical tensions which pushed oil prices higher and raised inflationary concerns (Chart II.8a). US Treasury yields rose in September (till 21st), despite the announcement of larger long-end buybacks aiming to provide temporary relief, as the Fed’s policy rate hike exerted upward pressure (Chart II.8b). The US dollar index weakened in August and early September, supporting emerging market currencies. Subsequently, it strengthened towards mid-September, supported by safe haven demand and the US Fed’s hawkish stance (Chart II.8c). Foreign portfolio inflows to emerging markets remained positive for the second consecutive month in August, amidst continued demand for emerging market debt despite higher long-term US Treasury yields (Chart II.8d). The renewed geopolitical tensions in West Asia continued to weigh on the growth-inflation trade-off faced by central banks across AEs and EMEs (Chart II.9). Amidst persistent inflationary risks, South Korea and the Philippines raised their benchmark interest rates in August, but Australia, Sweden, India, China, Indonesia, Mexico, and Thailand held their policy rates steady. In September (till 21st), the US, Japan and the Euro area raised their policy rates amidst rising inflationary risks. Similarly, New Zealand raised its benchmark interest rate, citing higher fuel prices, while Canada and the UK kept their rates unchanged. Amongst major EMEs, Malaysia kept its policy rate unchanged, citing a continued momentum in economic growth. Russia held its policy rate steady, pausing its monetay easing cycle, after ten consecutive rate cuts. China also kept its benchmark rate steady amidst a slower loan growth.
III. Domestic Developments Aggregate Demand Despite geopolitical uncertainties, Indian economy clocked a growth of 7.8 per cent in Q1:2026-27 driven by domestic consumption and investment.3 The growth in private final consumption expenditure (PFCE) was evident from robust vehicle sales and expansion in personal loans.4 Fixed investment registered its highest growth in the new series, as exhibited in the buoyant capital goods demand, increased Union Government capital expenditure, and sustained growth in finished steel consumption and cement output.5 On the external front, net exports contributed positively to real GDP growth (Chart III.1 and Annex Table A1). High-frequency indicators remained healthy in August. E-way bill generation grew sequentially. Goods and Services Tax (GST) revenue maintained double-digit growth, driven by strong import related collections, while domestic collections also remained robust.6 Growth in petrol consumption picked up compared to the previous year supported by increased road travel amidst below normal rainfall in August, while the higher diesel consumption growth was aided by larger use of generators and other equipment. The overall petroleum consumption, however declined due to fall in consumption of liquified petroleum gas (LPG), naphtha and petroleum coke. Electricity demand accelerated driven by higher cooling and irrigation requirements.7 Sustained double-digit growth in toll collection volumes indicated continued momentum in road transportation and logistics activity.8 Digital payments continued to post robust growth in terms of both volumes and value (Table III.1). 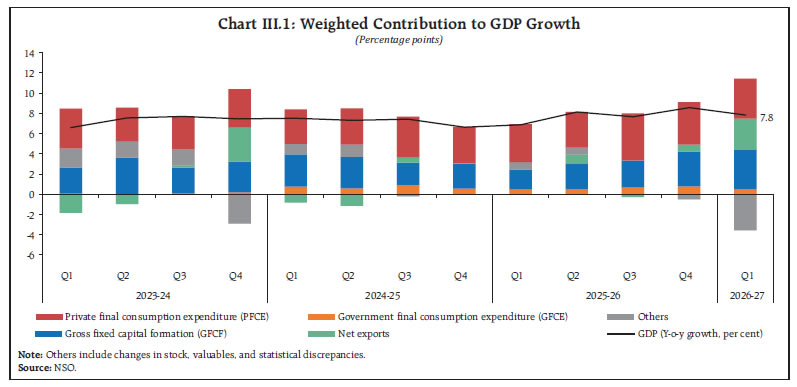 Both rural and urban demand remained firm in August as reflected by robust two-wheeler sales and continued growth in passenger vehicle sales. Domestic air passenger traffic declined in August, partly reflecting capacity rationalisation by major aviation carriers and higher aviation turbine fuel costs (Table III.2). The employment outlook remained robust in August. The all-India unemployment rate (based on Current Weekly Status) declined, driven by a fall in the rural unemployment rate.9 The labour force participation rate (LFPR) and worker-population ratio (WPR) increased from the previous month in rural areas, while remaining unchanged in urban areas.10 Naukri JobSpeak Index, an indicator of white-collar hiring, picked up sharply in August, supported by auto, healthcare, retail, insurance, and IT/software services. PMI employment in manufacturing contracted amidst a slowdown in new orders and output. PMI employment for services increased following stronger orders and improved business sentiment. Demand for work under the Viksit Bharat–Guarantee for Rozgar and Ajeevika Mission (Gramin) [VB-G RAM G]11 rose during the month (Table III.3).
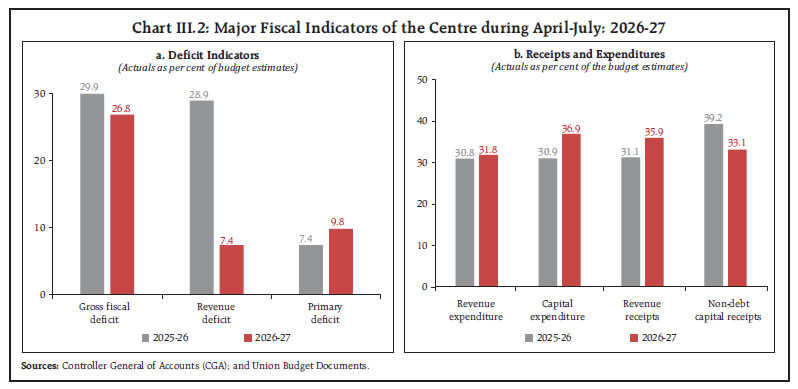
Government Finances During April-July: 2026-27, the gross fiscal deficit of the Union government as a per cent of the full year budget estimates was lower than the corresponding period of the previous year (Chart III.2a).12 The moderation was driven by a narrowing of the revenue deficit with robust tax collections and lower interest payments, despite higher subsidies.13 The rise in gross tax collections was driven by double digit growth in corporation tax, income tax and customs duties.14 Capital expenditure continued to record healthy growth, auguring well for the government’s thrust on infrastructure (Chart III.2b).15 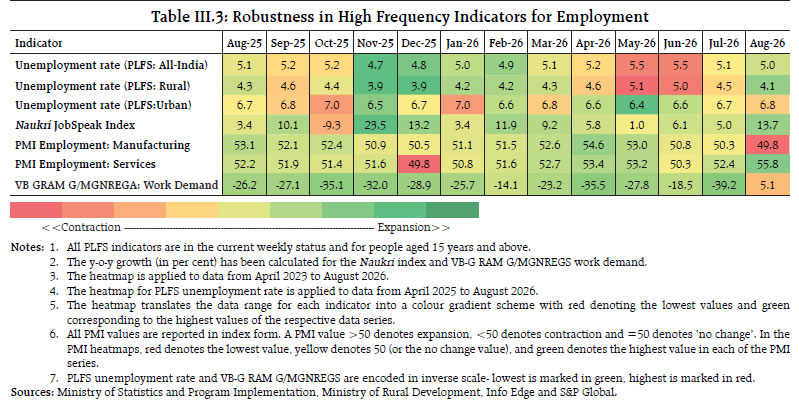
 The key deficit indicators of states during April- July: 2026-27, as a proportion of budget estimates, were also lower than those recorded during the corresponding period a year earlier (Chart III.3). The improvement was primarily driven by a moderation in revenue expenditure alongside an increase in revenue receipts. Within revenue receipts, state GST recorded robust growth, while collections from state excise duties and sales tax also remained strong. On the expenditure side, capital expenditure continued to register high growth. Trade Merchandise trade deficit narrowed to its lowest level in 2026-27 so far in August (Chart III.4).16 It was driven by a decline in gold imports, even as deficit in electronic goods and oil widened.17 Both merchandise exports and imports recorded double-digit growth (y-o-y) for the fifth consecutive month in August 2026. Export growth accelerated to its highest rate since June 2022, driven by electronic goods, engineering goods, and petroleum products.18 Exports of ready-made garments of all textiles contracted.19 Destination-wise, export growth was broad-based with exports to the US and China growing at double-digit rates for the second and thirteenth consecutive months, respectively.20 Exports to West Asia continued to contract (y-o-y) in August 2026.21 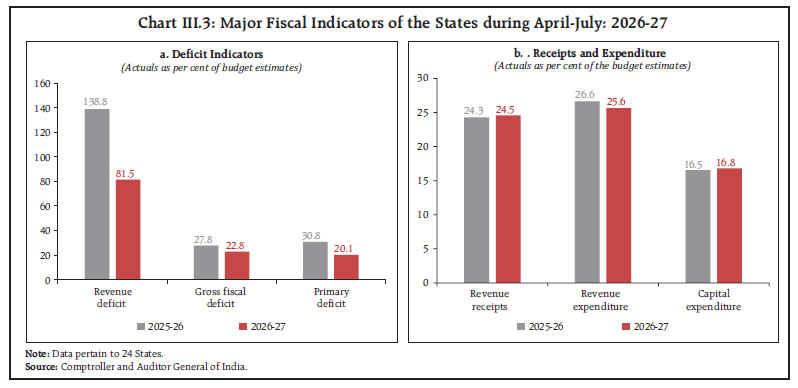 Import growth, albeit at a lower rate during the last four months, was driven mainly by electronic goods, and petroleum, crude and products.22 Gold imports contracted in August, after moderating since May 2026 following the imposition of the import duty.23 Imports of silver, sulphur and unroasted iron pyrites recorded sharp increase.24 Destination wise, imports from Oman, Brazil and Nigeria continued to grow at triple-digit rates, partly reflecting crude import diversification. Net services exports continued to grow at a robust pace in July 202625, supported by strong growth in exports, while imports rose at a faster pace (Chart III.5). The rise in services exports was primarily driven by business, software, and transport services, while travel, transport and business services supported the growth in services imports. Aggregate Supply The real gross value added (GVA) grew by 8.2 per cent in Q1:2026-27 supported by strong manufacturing and services activity. The growth in services sector was broad-based across all its major subsectors, particularly financial, real estate, and professional services. The growth in manufacturing was evident from the robust performance of the private corporate sector. Agriculture and allied activities grew on the back of strong rabi production and resilient allied sector activity (Chart III.6 and Annex Table A2). Agriculture After a pick-up in July, the south-west monsoon rainfall got subdued in August (Chart III.7).26 Consequently, the reservoir storage stood below the decadal average, albeit at a higher level than the preceding El Niño year of 2023.27 Although the sowing in the kharif season is nearing its end, soil moisture remains critical for ensuring the overall crop growth (Chart III.8).28 The India Meteorological Department (IMD) has given a below normal forecast of rainfall at the all-India level for September.29
A good harvest in the previous year has, however, resulted in robust procurement of rice and wheat, leading to comfortable public foodgrain stocks.30 Industry and Services Monthly Indicators of Industrial Activity Based on high-frequency indicators, industrial activity remained resilient despite the geopolitical tensions in West Asia. Industrial output as per the index of industrial production (IIP) continued to grow at a robust pace in July, with some sequential moderation. In August, the Manufacturing PMI remained in the expansionary zone, albeit with slight moderation over the previous months. Export orders, though they eased from July, continued in the expansion zone. Firms’ expectations for future output improved, backed by a positive outlook for demand and new business opportunities. Electricity generation remained strong, with conventional power generation responding to elevated demand. Automobile production continued to register strong growth across categories amidst upcoming festive demand. The index of core industries (ICI) remained resilient in August, supported by cement and electricity. Capital goods imports remained strong, suggesting sustained investment demand (Table III.4). 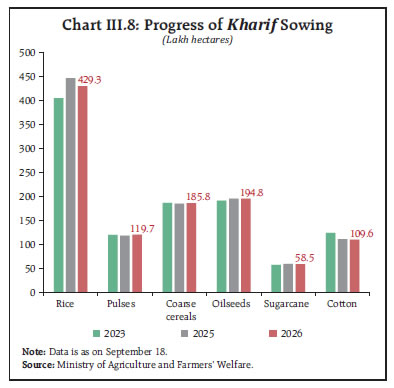 Reflecting the continued efforts for broad based transition towards clean energy, the Electric Vehicle (EV)31 penetration rate crossed the 10 per cent mark in 2026 (up to September 21) [Chart III.9a].32 Out of the total EV registrations, the share of the two-wheeler (2W) and four-wheeler (4W) segments were on the rise (Chart III.9b).
Monthly Indicators of Services Activity Services sector activity remained robust in August. Services PMI witnessed a pick-up in August, supported by resilient demand and strong growth in new businesses. Retail commercial vehicle sales registered robust growth, bolstered by light and heavy vehicle segments. However, international air passenger traffic continued to shrink, although the pace of contraction eased in August. Domestic logistics activity remained firm, with port cargo traffic recording healthy growth. Cement production sustained the double-digit growth momentum in August (Table III.5). Inflation Headline CPI inflation33 increased to 4.8 per cent (y-o-y) in August from 4.5 per cent in July 2026, driven by food and beverages and a pickup in fuel and core components (CPI inflation excluding food and fuel) [Chart III.10].34 Ten out of twelve divisions faced a sequential rise in inflation in August (Chart III.11). The increase in ‘food and beverages’ inflation was broad-based driven by cereals, oils and fats, sugar, confectionery and desserts. On a month-on-month basis, CPI indices for all sub-components of ‘food and beverages’ except meat, fish and eggs rose in August. Fuel inflation also edged up in August.35 Inflation moved up in both urban and rural areas in August.36 The majority of States/UTs recorded inflation in the range of 4-6 per cent (Chart III.12).37 Core inflation rose to 4.2 per cent in August after remaining steady at 3.9 per cent for three consecutive months. Even after excluding precious metals, core inflation was higher at 2.9 per cent in August compared with 2.7 per cent in July. Within the core, inflation remained elevated in ‘personal care, social protection and miscellaneous goods and services’ and ‘restaurant and accommodation services’ groups.
Until September 21, high-frequency data suggest a broad-based sequential increase in food prices. Among cereals, rice and wheat prices continue to rise, though the pace of m-o-m increase moderated for rice. Prices of all major pulses–gram, tur and moong inched up over the previous month. Edible oil prices also registered a broad-based increase, led by mustard and palm oil. Among key vegetables, onion prices increased sharply, and tomato prices inched up after two months of moderation, while potato prices recorded a m-o-m decline (Chart III.13). Retail prices of petrol, diesel, and domestic LPG remained unchanged until September 21 (Table III.6).
| Table III.6: Petroleum Product Prices Remained Unchanged in August and September | | Item | Unit | Domestic Prices | Month-over-month (per cent) | | Sep-25 | Aug-26 | Sep-26^ | Aug-26 | Sep-26^ | | Petrol | ₹/litre | 101.1 | 108.7 | 108.7 | 0.0 | 0.0 | | Diesel | ₹/litre | 90.5 | 98.1 | 98.1 | 0.0 | 0.0 | | Kerosene (subsidised) | ₹/litre | 44.3 | 46.8 | 46.8 | 0.0 | 0.0 | | Domestic LPG (non-subsidised) | ₹/cylinder | 863.3 | 952.3 | 952.3 | 0.0 | 0.0 | ^: For the period September 01-21, 2026.
Note: Other than kerosene, prices represent the average Indian Oil Corporation Limited (IOCL) prices in four major metros (Delhi, Kolkata, Mumbai and Chennai). For kerosene, prices denote the average of the subsidised prices in Kolkata, Mumbai and Chennai.
Sources: IOCL; Petroleum Planning and Analysis Cell (PPAC); and RBI staff calculations. | The price of the Indian basket crude oil38 increased to US$ 114.6 per barrel in September (till 18th), its highest level since April 2026 (Chart III.14). Wholesale Price Index (WPI) inflation marginally rose to 9.9 per cent in August from 9.8 per cent in July, led by higher fuel and power, and manufactured products group inflation. However, inflation in primary articles moderated.39 Industrial and farm input cost inflation remained elevated.40 Output Producer Price Index (OPPI)-based inflation inched up marginally to 9.8 per cent in August from 9.6 per cent in July, led by manufacturing products, and mining & quarrying. The PMI input and output prices for both manufacturing and services remained in the expansionary zone. While the pace of expansion moderated further in the case of manufacturing, input and output price indices for services sector rose in August. The gap between input and output price indices narrowed for both manufacturing and services sector firms (Chart III.15). IV. Financial Conditions System liquidity41 remained in surplus in August and surged further in September (till 21st), amidst strong inflows under the FCNR(B) swap facility.42 System liquidity, however, moderated amidst tax related outflows and RBI’s durable liquidity measures during the second half of September. The reliance of banks on the marginal standing facility (MSF) commensurately declined, and the daily deployment under the standing deposit facility (SDF) rose (Chart IV.1).43 RBI conducted term as well as fine-tuning variable rate reverse repo (VRRR) auctions to mop up excess liquidity.44 On review of current and evolving liquidity conditions, the RBI also announced open market operation (OMO) sale auctions for an aggregate amount of ₹1 lakh crore.45 Money Market The weighted average call rate (WACR) largely traded in the lower half of the policy corridor during August and September (till 21st) [Chart IV.2a].46 Overnight rates in the collateralised segment evolved in line with the WACR and the changes in system liquidity. While yields on 3-month Treasury Bills remained largely range-bound till early September, yields on commercial papers (CPs) and certificates of deposit (CDs) fell sharply amidst a surge in system liquidity. As the system liquidity surplus tapered later in the month, the yields witnessed hardening (Chart IV.2b).47 The spread between the yield on 3-month CP and the 3-month Treasury bill narrowed in September.48
Government Securities (G-Sec) Market G-sec yields hardened through mid-August till September (till 21st) amidst renewed geopolitical tensions in West Asia, volatility in crude oil prices and a rise in US Treasury yields (Chart IV.3a).49 The yield curve hardened across tenors in September (as on 21st) as compared to end-August levels (Chart IV.3b). Corporate Bond Market Corporate bond issuances moderated in July and also on a cumulative basis in the current financial year as compared to the same period in the previous year.50 Corporate bond yields and spreads generally hardened across tenors and the rating spectrum in September (till 21st) [Table IV.1]. Money and Credit Reserve money [adjusted for cash reserve ratio (CRR)] expanded at a robust pace with growth in currency in circulation recording the highest print in past five years as on September 15, 2026.51 The money supply growth accelerated due to a rapid increase in aggregate deposit (Chart IV.4).52 Bank deposit growth during August reached its highest level in the past 15 years, contributing to a moderation in the incremental credit-deposit ratio. Both credit and deposit sustained strong growth in September despite some moderation (Chart IV.5).53 The total flow of financial resources to the commercial sector increased in 2026-27 (till August 31st), driven by a pickup in non-food bank credit and rise in FDI54 [Table IV.2a]. As on August 31, the total outstanding credit to the commercial sector also stood higher than a year ago (Table IV.2b). | Table IV.1: Average Corporate Bond Yields and Spreads Hardened | | | Yields
(Per cent) | Spread (bps) | | (Over Corresponding Risk-free Rate) | | Instrument | August 2026 | September 2026
(till 21st) | Variation
(bps) | August 2026 | September 2026
(till 21st) | Variation | | 1 | 2 | 3 | (4 = 3-2) | 5 | 6 | (7 = 6-5) | | (i) AAA (1-year) | 7.38 | 7.44 | 6 | 160 | 143 | -17 | | (ii) AAA (3-year) | 7.59 | 7.79 | 20 | 123 | 126 | 3 | | (iii) AAA (5-year) | 7.60 | 7.84 | 24 | 105 | 107 | 2 | | (iv) AA (3-year) | 8.40 | 8.55 | 15 | 204 | 204 | 0 | | (v) BBB minus (3-year) | 11.98 | 12.15 | 17 | 562 | 564 | 2 | | Source: Fixed Income Money Market and Derivatives Association of India. | 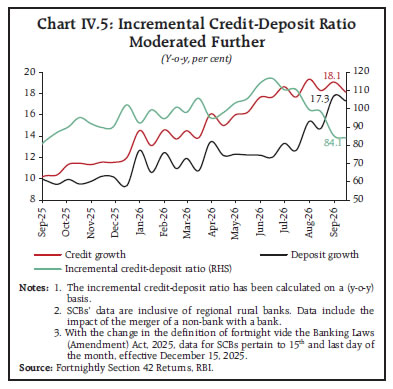 Bank credit growth continued to remain broad-based in July 2026.55 Credit to the agriculture sector marginally edged up, while industrial credit growth accelerated, reflecting sustained credit flow to large industries. Credit growth in services sector strengthened further, with lending to non-banking financial companies (NBFCs) and trade contributing to the bulk of the increase, even as credit growth in the commercial real estate segment decelerated marginally. Personal loans rose, supported by steady growth in housing and vehicle loans, despite some moderation in growth in loans against gold jewellery (Chart IV.6). | Table IV.2a: Flow of Financial Resources to Commercial Sector Increased | | (₹ lakh crore) | | Source | April-March | Up to August 31 | | 2024-25 | 2025-26 | 2025-26 | 2026-27 P | | A. Non-Food Bank Credit | 18.08 | 29.19 | 3.83 | 9.84 | | B. Non-Bank Sources (B1+B2) | 18.15 | 18.06 | 7.41 | 7.62 | | B1. Domestic Sources | 14.91 | 12.84 | 5.20 | 4.40 | | B2. Foreign Sources | 3.25 | 5.22 | 2.20 | 3.22 | | C. Total Flow of Resources (A+B) | 36.23 | 47.25 | 11.24 | 17.46 | P: Provisional.
Notes: 1. Figures in the columns might not add up to the total due to rounding off of numbers.
2. For detailed notes and data, please refer to Current Statistics Table No: 18(a).
Sources: RBI; SEBI (Securities and Exchange Board of India); AIFIs (All India Financial Institutions); and RBI staff calculations. |
| Table IV.2b: Higher Outstanding Credit to Commercial Sector | | (₹ lakh crore; Figures in parentheses are y-o-y percentage changes) | | Source | At End-March | As on August 31 | | 2025 | 2026 | 2025 | 2026 P | | A. Non-Food Bank Credit | 183.72 | 212.91 | 187.55 | 222.76 | | | (10.9) | (15.9) | (10.2) | (18.8) | | B. Non-Bank Sources (B1+B2) | 88.86 | 101.77 | 93.60 | 105.84 | | | (14.6) | (14.5) | (16.2) | (13.1) | | B1. Domestic Sources | 66.37 | 75.29 | 70.57 | 78.31 | | | (17.3) | (13.4) | (18.9) | (11.0) | | B2. Foreign Sources | 22.49 | 26.48 | 23.03 | 27.53 | | | (7.2) | (17.7) | (8.4) | (19.6) | | C. Total Credit (A+B) | 272.58 | 314.68 | 281.15 | 328.60 | | | (12.1) | (15.4) | (12.1) | (16.9) | P: Provisional.
Notes: 1. Figures in the columns might not add up to the total due to rounding off of numbers.
2. Data on non-bank sources excludes issuances of equities and hybrid instruments under domestic sources and foreign direct investment in equities under foreign sources.
3. Flows based on outstanding data may not tally with the flows provided in Table IV.2a due to: (a) Conversion of some Housing Finance Companies into Non-Banking Financial Companies; and (b) Valuation effect in case of foreign sources.
4. For detailed notes and data, please refer to Current Statistics Table No: 18(b).
Sources: RBI; SEBI; AIFIs; and RBI staff calculations. | NBFC credit sustained its upward trajectory in July 2026,56 largely driven by retail loans and industry. Retail loans remained robust on the back of steady growth in loans against gold jewellery, housing57 and vehicle loans. Industrial credit accelerated, propelled by the infrastructure segment. Credit to services sector, however, moderated on account of deceleration in commercial real estate and trade segments. Agricultural credit continued to grow in double digits (Chart IV.7). Deposit and Lending Rates During the current easing cycle (February 2025 to July 2026), banks have lowered both weighted average lending rates (WALRs) and the weighted average domestic term deposit rates (WADTDRs) in response to the cumulative 125 basis points (bps) reduction in the policy repo rate. In July, the WADTDR on fresh term deposits and the WALR on fresh rupee loans moderated sequentially, while WALR on outstanding rupee loans increased marginally (Table IV.3). 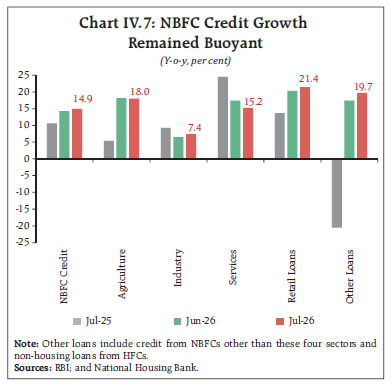
| Table IV.3: Transmission to Banks’ Deposit and Lending Rates | | (Basis points) | | Period | Repo Rate | Term Deposit Rates | Lending Rates | | WADTDR-Fresh Deposits | WADTDR-Outstanding Deposits | EBLR | 1-Year MCLR (Median) | WALR - Fresh Rupee Loans | WALR-Outstanding Rupee Loans | | Overall | Interest Rate Effect# | | (1) | (2) | (3) | (4) | (5) | (6) | (7) | (8) | (9) | Tightening Cycle
May 2022 to Jan 2025 | 250 | 259 | 206 | 250 | 175 | 182 | 191 | 115 | Easing Cycle
Feb 2025 to Jul 2026 | -125 | -72 | -51 | -125 | -40 | -81 | -75 | -90 | | Monthly | | May-2026 | 0 | 4 | -2 | 0 | 10 | 1 | -2 | -1 | | Jun-2026 | 0 | 16 | 1 | 0 | -15 | 2 | 6 | -1 | | Jul-2026 | 0 | -9 | 0 | 0 | 10 | -1 | 4 | 1 | #: Calculated at January 2025 weights.
WALR: Weighted average lending rate; WADTDR: Weighted average domestic term deposit rate.
MCLR: Marginal cost of funds-based lending rate; EBLR: External benchmark-based lending rate.
Note: Data on EBLR pertain to 32 domestic banks.
Source: RBI. | Across domestic bank groups, private sector banks recorded stronger pass-through to lending rates and fresh deposit rates than those of public sector banks. The public sector banks exhibited relatively higher transmission to outstanding deposit rates during the current easing cycle (Chart IV.8). Transmission to lending rates was broad-based across sectors, with higher pass-through to EBLR-mandated sectors58 (Chart IV.9).
Equity Markets Indian equity markets remained subdued in August and September (till 21st) amidst escalating geopolitical tensions and elevated crude oil prices. A spike in global bond yields and tighter US monetary policy also weighed on the investor sentiment and foreign flows in equities (Chart IV.10). External Sources of Finance FDI flows strengthened further in July 2026, supported by robust gross inflows (Chart IV.11a).59 Communication, financial and computer services were the major sectors, receiving more than four-fifths of the equity inflows (Chart IV.11b). Mauritius, the UAE, and the US were the major source countries, accounting for about 70 per cent of equity inflows. Overseas investments also rose during July after declining for two consecutive months. More than two-thirds of outward FDI flows were directed towards Singapore, the UK, and the UAE. The major sectors witnessing outward FDI were financial, insurance and business services, and manufacturing – together accounting for about two-thirds of the outward flows. August witnessed continued FPI inflows, supported by the equity segment, while the debt segment witnessed outflows. In September (till 21st), total FPI flows turned negative after three consecutive months of inflows on the back of re-escalation of tensions in West Asia and rising global bond yields (Chart IV.12).60
Net inflows under non-resident deposits rose sharply in July 202661, reflecting an increase in FCNR(B) deposits on account of recent policy measures (Chart IV.13).62 Offshore fundraising through external commercial borrowings (ECBs) strengthened during April-July 2026, with both registrations and net inflows rising over the year.63 In July 2026, net ECB inflows doubled from a year ago, although they moderated marginally as compared to the previous month (Chart IV.14). Around 31 per cent of the ECBs registered were mobilised for capital expenditure. India’s current account deficit rose marginally in Q1:2026-27 compared to a year ago driven by widening of merchandise trade deficit (Chart IV.15).64 Capital account witnessed net outflows. These together led to a decline of US$ 8.1 billion in foreign exchange reserves (on a balance of payment basis) in Q1:2026-27. The situation improved in July 2026 with net capital inflows of US$ 27.7 billion, primarily driven by higher net inflows under banking capital, foreign portfolio investment and foreign direct investment, resulting in a balance of payments surplus of US$ 20.8 billion during the month.
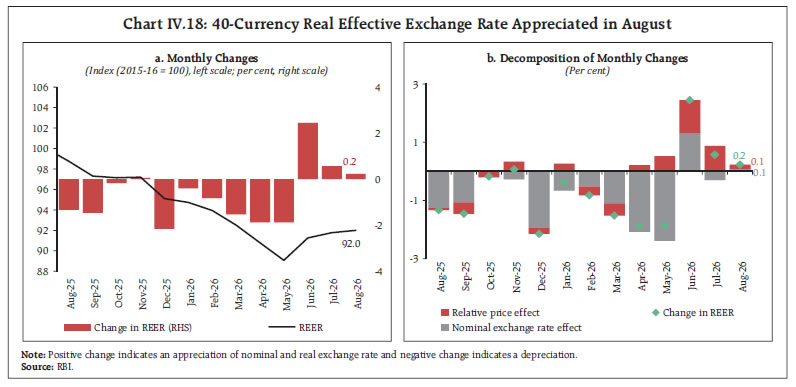
India’s foreign exchange reserves surged to a record high in September, supported by strong foreign currency inflows following the RBI’s concessional swap measures. The reserves provided cover for 11.2 months of goods imports (as on September 18) and more than 100 per cent of the external debt outstanding as at end-March 2026 (Chart IV.16).65 Foreign Exchange Market West Asia tensions and high crude oil prices caused the Indian rupee (INR) to depreciate for most of August. Strong FCNR(B) deposits led to brief recoveries in early September, but these gains reversed in the later part of the month on account of higher crude oil prices (Chart IV.17). In real effective terms, the INR appreciated in August driven by higher domestic inflation vis-à-vis major trading partners and appreciation of the INR in nominal effective terms (Chart IV.18). V. Conclusion The escalation of conflict in West Asia in September has led to a sharp increase in crude oil prices, reigniting concerns of a further disruption in global supply chains and build-up of inflationary pressures. Alongside, the rise in sovereign yields in some of the major advanced economies has put pressure on government finances. Despite such a challenging global environment, the Indian economy recorded a strong GDP growth in Q1:2026-27. High-frequency indicators through August reflected sustained demand with segments of industry and services sectors displaying resilience. Headline CPI inflation picked-up in August 2026. Core inflation excluding precious metals has also increased from ultra-low levels of recent months. India’s financial and external sectors are drawing strength from the real economy, although geopolitical tensions and weather-related uncertainties are acting as key downside risks. With strong export growth, the merchandise trade deficit narrowed in August. The current account deficit remained moderate in Q1:2026-27, supported by robust services exports and remittance flows. FDI flows strengthened in July, with net FDI reaching its highest level in the last five years. System liquidity remained in surplus, following strong FCNR(B) deposit flows. The resultant deposit growth could support ongoing credit growth. Foreign exchange reserves also reached record levels. Overall, the economy performed strongly despite external headwinds. 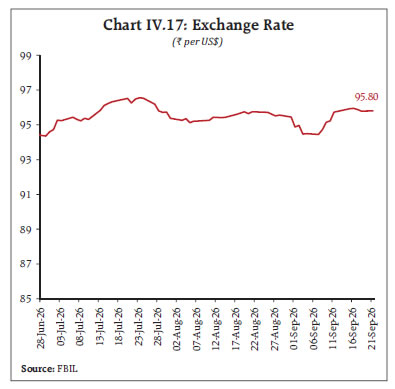
Annex
Table A1: Real GDP Growth (at 2022-23 prices)
(y-o-y growth, per cent) | | Components | Share in 2025-26 | 2023-24 | 2024-25 | 2025-26 | 2024-25 | 2025-26 | 2026-27 | | Q1 | Q2 | Q3 | Q4 | Q1 | Q2 | Q3 | Q4 | Q1 | | I. Total Consumption Expenditure | 66.1 | 5.3 | 6.5 | 7.0 | 6.1 | 6.2 | 7.3 | 6.2 | 6.4 | 6.0 | 7.9 | 7.5 | 6.7 | | Private | 55.8 | 6.2 | 6.4 | 7.2 | 6.0 | 6.4 | 6.9 | 6.4 | 6.8 | 6.4 | 8.0 | 7.5 | 7.1 | | Government | 10.3 | 0.8 | 6.6 | 5.9 | 6.6 | 5.0 | 9.6 | 5.5 | 4.5 | 4.4 | 7.0 | 7.7 | 4.3 | | II. Gross Capital Formation | 35.6 | 10.6 | 7.9 | 7.8 | 8.6 | 10.2 | 7.1 | 6.0 | 6.0 | 5.8 | 8.0 | 11.3 | 10.1 | | Fixed Investment | 33.2 | 9.0 | 8.2 | 8.0 | 9.7 | 8.9 | 6.9 | 7.6 | 5.8 | 7.2 | 8.3 | 10.5 | 11.9 | | III. Net Exports | -1.9 | 12.2 | -14.8 | 12.7 | -26.2 | -31.7 | 23.3 | -2.4 | -1.2 | 18.8 | -17.4 | 383.2 | 86.1 | | Exports | 21.8 | 1.1 | 4.9 | 6.4 | 6.0 | 1.0 | 8.2 | 4.3 | 6.0 | 9.7 | 6.2 | 3.9 | 12.0 | | Imports | 23.7 | -0.2 | 5.7 | 4.6 | 8.4 | 5.1 | 5.1 | 4.4 | 5.3 | 5.0 | 7.0 | 0.8 | -1.1 | | GDP | 100.0 | 7.3 | 7.2 | 7.8 | 7.5 | 7.3 | 7.4 | 6.6 | 6.9 | 8.1 | 7.7 | 8.6 | 7.8 | Note: Figures in this table are based on the revised data released on August 31, 2026.
Sources: NSO and RBI staff calculations. |
Table A2: Real GVA Growth (at 2022-23 prices)
(Y-o-y growth, per cent) | | Sectors | Share in 2025-26 | 2023-24 | 2024-25 | 2025-26 | 2024-25 | 2025-26 | 2026-27 | | Q1 | Q2 | Q3 | Q4 | Q1 | Q2 | Q3 | Q4 | Q1 | | I. Agriculture and allied activities | 17.7 | 2.7 | 4.1 | 3.3 | 2.6 | 4.0 | 5.7 | 3.8 | 4.4 | 3.2 | 1.9 | 3.9 | 3.6 | | II. Industry | 20.0 | 9.7 | 9.4 | 7.8 | 10.5 | 6.4 | 11.2 | 9.6 | 7.3 | 10.1 | 7.6 | 6.4 | 7.7 | | Mining and quarrying | 2.1 | 0.9 | 13.5 | 7.1 | 15.7 | 6.7 | 16.5 | 13.6 | 12.4 | 21.6 | 3.3 | -2.9 | -2.4 | | Manufacturing | 15.6 | 10.7 | 10.0 | 8.8 | 9.9 | 7.5 | 12.2 | 10.3 | 8.3 | 10.0 | 9.0 | 7.9 | 9.2 | | Electricity, gas, water supply and other utility services | 2.3 | 11.7 | 2.8 | 2.1 | 9.8 | -0.2 | 0.7 | 1.0 | -1.8 | 3.8 | 1.9 | 4.8 | 8.9 | | III. Services | 62.3 | 8.3 | 7.4 | 9.3 | 8.0 | 8.0 | 7.1 | 6.4 | 7.6 | 8.9 | 9.6 | 11.0 | 9.7 | | Construction | 9.0 | 9.7 | 6.6 | 7.2 | 8.1 | 5.6 | 5.2 | 7.5 | 5.2 | 7.8 | 7.0 | 8.7 | 7.7 | | Trade, hotels, transport, communication, and services related to broadcasting | 14.7 | 11.5 | 7.0 | 11.3 | 8.1 | 7.5 | 6.7 | 5.9 | 9.8 | 10.6 | 11.7 | 12.9 | 8.5 | | Financial, real estate and professional services | 26.2 | 6.6 | 9.0 | 10.5 | 8.5 | 10.0 | 9.7 | 7.7 | 8.8 | 9.9 | 10.9 | 12.3 | 12.1 | | Public administration, defence and other services | 12.4 | 6.9 | 5.1 | 6.3 | 6.9 | 6.0 | 4.2 | 3.5 | 4.6 | 5.7 | 6.6 | 8.0 | 7.5 | | IV. GVA at basic prices | 100.0 | 7.4 | 7.1 | 7.9 | 7.5 | 7.0 | 7.6 | 6.6 | 7.0 | 8.3 | 7.6 | 8.7 | 8.2 | Note: Figures in this table are based on the revised data released on August 31, 2026.
Sources: NSO; and RBI staff calculations. |
|