by Saurabh Ghosh, Prabhat Kumar Madhuresh Kumar and Monica^ Credit extended by scheduled commercial banks (SCBs) has grown faster than deposits since FY2023 resulting in higher credit-deposit (CD) ratio. This has raised some concerns regarding the sustainability of credit growth. This article concentrates on the modern monetary system where every credit creates an equivalent deposit, and a bank does not necessarily need to mobilise liabilities (such as deposits) before credit creation. Therefore, deposit per se, may not be a binding constraint for credit creation. Subsequently, however, profitability considerations, inter-bank mobility of deposits, and prudential regulations (i.e., capital adequacy, provisions, reserve requirements, and liquidity requirements) would converge credit growth in sync with underlying economic conditions. Further, this article analyses how Indian banks adjust their balance sheets amid rising credit demand. In the end, allocation of fund remains a commercial decision for banks. They increase the size of their loan book only if lending is relatively profitable on a risk-adjusted basis. Therefore, during high credit demand phases, which often precedes or coincides with economic expansions, banks increase their credit portfolio, potentially leading to higher CD ratios. The recent rise in CD ratio in India also coincides with a growing economy and sound banking system, where prudential targets are adequately satisfied at system level. The high CD ratio as at end-March 2026 was on account of liability side adjustments such as higher borrowings at lower cost than earlier periods, and higher capital. Moreover, changes in composition of assets, by redeploying reserves and other balances, also supported credit flow. The finding of this study further indicates that CD ratio, by itself, may not be an appropriate metric to gauge funding vulnerability of a banking system that is experiencing high credit growth. Rather, a holistic review of the overall dynamics of credit and deposit creation and interplay among various balance-sheet components in response to these dynamics may be undertaken. This includes capital and borrowings of the banks on the liability side, investments and net foreign assets on the asset side. Further, in the banking system’s balance sheet, factors such as currency with public may also be considered. Introduction The widening wedge between credit and deposit growth in India's banking system has ignited debates about the sustainability of bank credit growth. This concern has gained traction as SCBs have seen their CD ratio climbing to 82.2 per cent in March 2026; and the incremental CD (I-CD) ratio breached 110 per cent both in FY2023 and FY2024. In FY2027, incremental CD ratio peaked in May and stood at around 114 per cent and has been declining since then, which could be due to influx of foreign currency non-resident (Bank) [FCNR(B)] deposits (Chart 1c). India remains a bank-dominated financial system, with bank credit accounting for more than 65 per cent of total resources flowing to the commercial sector (RBI, 2026). In this context, the sustained wedge between credit and deposit growth, raises a critical question: how is the incremental credit being supported by the banking system? While every credit creation is associated with a matching deposit, is it leading to a change in the composition of bank balance sheet i.e., a) a shift in bank asset preferences away from investments toward loans or, b) are non-deposit liabilities such as short-term borrowings playing a larger role? Economies in high-growth phases often experience credit outpacing deposits growth, as observed in China, and Australia (Bowman et al., 2018; Hutchinson et al., 2026). Conversely, Japan's three-decade-long experience of structurally depressed loan demand and corporate deleveraging left its banks, particularly regional ones, with excess deposits (IMF, 2003; Fukuda, 2018). Against this backdrop, this article uses balance-sheet analysis to examine the financing dynamics of credit growth. It traces how the balance-sheet structure of banks adjusts to changes in credit and deposit growth across different underlying economic conditions and corresponding rise and fall in CD ratios. The rest of the article is organised as follows: Section II discusses the recent rise in the CD ratio, which motivates the analysis of how credit growth is being financed. Section III concentrates on banks extending credit through money creation. Section IV examines the mechanics of deposit creation and attrition in the banking system. Section V analyses commercial bank’s balance sheet and explains how different sub-heads in the asset and liability side of the balance sheet interact during the high CD ratio vis-à-vis low CD ratio phases and Section VI concludes. II. Credit-Deposit growth Wedge From FY 2023 onwards, credit extended by SCBs to the commercial sector has grown faster than aggregate deposits mobilised by them. Both CD and I-CD ratios have been high in recent times (Chart 1a, b and c). Again, while every credit creates a matching deposit simultaneously, the concern regarding high CD ratio is that if credit keeps growing faster than deposits, banks may eventually run out of resources to meet reserve requirements or regulatory capital requirement including provisions (ex-post) and may be forced either to slow credit growth or have to rely on more expensive and less stable sources of funds. To examine whether this concern is valid, the article takes a deep dive into the process of credit and deposit creation/attrition in an economy. In the next section, a simplified representation of bank financing through money creation (FMC) is developed (Jakab and Kumhof, 2015). III. Financing through Money Creation (FMC) In the traditional intermediation of loanable funds model of banking balance sheet expansion arises first from liabilities side, through deposit mobilisation, which then enables credit expansion (Jakab and Kumhof, 2015). In the more recent version of the credit creation theory of banking (McLeay et al., 2014), balance sheet expansion or liquidity expansion arises from the asset side - either through credit or investment with deposits as its matching entry, on the liability side. In this system deposit creation becomes endogenous to asset side movement of bank balance sheet. Therefore, in the FMC model, households’ saving is a consequence, rather than a cause of bank lending. The fact that banks create their own funds was perhaps noted for the first time, by Graham F. Towers (1939) as “Each and every time a bank makes a loan, new bank credit is created - new deposits - brand new money”1. The banking system extends credit and creates deposit simultaneously. The central fulcrum of this strand of literature is that banks do not need to borrow funds for credit and deposit creation to start with. Commercial banks’ loans and investment both create money via deposit creation. In the Indian context, a recent article focused on the role of central bank’s monetary and liquidity management operations in shaping CD ratio (Chander et al., 2026). However, our article takes an alternative approach by analysing the entire financial system and examining decomposition of banks’ balance sheet. The three hypothetical scenarios of bank balance sheet decomposition are as follows: Scenario 1: One Bank (A), Household and Firm without Central Bank There is only one bank (Bank A) in the economy. Household provides labour to firm in exchange of wages. Firm borrows funds from Bank A and uses them to invest in production. In response to firm’s demand, Bank A lends ₹100 by creating a deposit in firm’s account. This increases Bank A’s assets (loans and advances) and liability (deposit), expanding its balance sheet. Now, firm pays ₹40 as wages to household, which reduces firm’s deposit to ₹60 and deposit of household increases by ₹40 (Figure 1). Since there is only one bank, it doesn’t create any asset liability mismatch. In such a scenario bank can keep on extending credit indefinitely as long as it remains profitable to do so. Scenario 2: Two Banks (Bank A and Bank B), Household and Firm without Central Bank In addition, now there is one more bank (Bank B) in the economy. While Bank A has the account of the firm, Bank B has the account of the household. As before, Bank A provides ₹100 as credit to the firm and deposit the same in firm’s account. This has same impact on Bank A’s balance sheet and economy as in scenario 1. Now, firm pays ₹40 wages to household. This reduces deposit of firm to ₹60 in Bank A and increases deposit of household by ₹40 in Bank B (Figure 2). At this instance, assets and liabilities of balance sheet of both, Bank A and Bank B, are not balanced. This transfer of deposit creates funding pressure for Bank A. To mitigate this, Bank A must mobilise funds (liability) worth ₹40 and Bank B must productively deploy the fund it has (create asset). While from the individual bank’s balance sheet, there could be a mismatch, if we look from the banking system as a whole, assets and liabilities are matched. The issue, therefore, is not a system-wide deposit shortage but of redistributing deposits within the system at an affordable cost. It could be matched through several possible transactions including the inter-bank borrowings e.g., Bank A can borrow ₹40 from Bank B.
Scenario 3: Central Bank, Two banks (Bank A and Bank B), Household and Firm In addition to scenario 2, now there is a Central Bank which issues currency, keeps reserves, and regulates banks by imposing prudential measures like Cash Reserve Ratio (CRR), Capital-to-Risk (Weighted) Assets Ratio (CRAR), Liquidity Coverage Ratio (LCR), Provision Coverage Ratio (PCR), etc., to manage liquidity and systemic risk. Assume that both Bank A and Bank B maintain ₹ 500 in reserves with central bank. Bank A lends ₹ 100 to the firm and deposits the same in firm’s account. This has same impact on Bank A’s balance sheet and economy as in scenario 1. Now, firm pays ₹ 40 wages to household, which has an account in Bank B. Bank A must pay Bank B in terms of reserves via the Central Bank. Bank A’s reserves will decline by ₹ 40 (to ₹ 460) while Bank B’s reserves will increase by ₹ 40 (to ₹ 540). This does not have any impact on the size of the Central Bank balance sheet (Figure 3). Discussion based on the above scenarios are as under: -
Currency is demanded by households. As deposits increase, the demand for currency also increases generally. -
In the traditional system CRR requirement may be a binding constraint to credit creation. However, where policy rate is the main tool, central bank generally extends reserves to meet the demand of commercial banks to anchor operating target to the official policy rate. Therefore, in such a system, CRR requirement may not be a binding constraint. -
Reserves are redistributed across the banking system through overnight money market, term money market, etc., each suited to a particular tenor. Reserve redistribution always goes on in the economy, as some banks are short of deposits while others have excess of it. -
Loan creation in FMC set up is driven by firms’ demand and banks profitability consideration. In order to extend additional loans banks might have to reduce lending rates. This narrows down the profit margin (net interest margin) for banks. Banks would extend credit only till it is profitable to do so (Berry et al, 2007). -
Credit comes with a possibility of default while deposits with a withdrawal obligation to be honoured. Therefore, central bank mandates bank to comply with prudential measures like CRR, CRAR, LCR, PCR, etc. While bank can create unlimited credit, the profitability consideration and prudential regulation may keep the credit aligned with optimal credit levels consistent with financial stability. -
In view of the recent movement in the current account and net capital flows, further extension to an open economy is considered in this paper. In this context, net foreign currency inflows can also lead to an increase in the banking system’s net foreign assets and a corresponding creation of deposits (see Section IV.3.). To summarise, for the banking system as a whole, deposits may not be viewed as a fixed pool of resources that banks must first mobilise before extending loans and investments, rather they are simultaneously created by the very act of lending and investing. While this article concentrates on FMC model of banking, it acknowledges that at the core of banking literature lies ultimate financial friction due to asymmetric information between the lenders and borrowers (Arrow, 1978). It is capable of triggering behavioural reactions among the lenders and borrowers. For instance, under very high uncertainty, depositor may manifest herd behaviour in withdrawing funds leading to “panic run” (Diamond and Dybvig, 1983). However, given the present macro-financial stability, this article abstains from extreme uncertainty led behavioural shifts in bank balance sheet. IV. Mechanics of Deposit Creation and Attrition Deposits are primarily created through three channels a) bank credit b) investment c) foreign capital inflows. They are eroded when deposit holders liquidate their deposits by withdrawing cash or repaying a loan. Further, for the banking system balance sheet including the Reserve Bank, non-deposit sources (such as capital, borrowings and net other liabilities clubbed together as net non-monetary liabilities) also aid in expansion of liability side. Therefore, change in credit may be shown by the following identity (RBI Bulletin tables 6 and 7): ΔL + ΔI + ΔNFA = ΔD + ΔCWP + ΔNNML + ΔOther ...(1) and, equivalently, to isolate the change in credit: ΔL = ΔD + ΔCWP + ΔNNML - ΔI - ΔNFA + ΔOther ...(2) where, D = Aggregate deposits, CwP = currency with public, NNML = Net non-monetary liabilities, and L = Banks credit to commercial sector net of investment in other approved securities, NFA = net foreign assets of the banking system, I = Net bank credit to Government plus investment in other approved securities, Other = [Other Deposits with RBI – (net RBI credit to government + net RBI credit to commercial sector + Government currency liabilities)]. As shown in Equation (2), while credit creation generates an equivalent amount of deposits in the first round, several other factors also lead to creation or attrition of deposits. Consequently, the growth in incremental credit and deposits may at times diverge. Both in FY 2026 and FY 2027 (up to August 31, 2026), bank credit remained the largest source of balance sheet expansion from the asset side though its contribution was considerably stronger in FY 2026. In the current fiscal, net foreign assets have taken on a far more dominant role on the asset side, driven by recent foreign capital inflows under the FCNR(B) scheme. Bank investments, by contrast, stayed subdued through FY 2026. From the liability side, as always, deposits remained the largest source followed by NNML, which includes capital. This analysis highlights the role of reduction in share of banks’ investment on the asset side and role of increase in share of capital on the liability side in FY2026. In FY2027 so far, the deposits coupled with NFA are playing a significant role, partly because of the FCNR(B) scheme (Table 1). | Table 1: Sources of Credit Growth in the Banking System | | Absolute changes in Outstanding (∆) | FY 2026 | FY 2027
(till Aug 31, 2026) | | L | 31,65,433 | 10,30,309 | | D | 37,12,973 | 16,49,256 | | CwP | 4,34,736 | 1,28,621 | | NNML | 8,32,356 | 3,04,282 | | Others changes | -5,46,341 | 1,98,726 | | Investment | 2,90,547 | 3,07,370 | | Net Foreign Assets | 9,77,745 | 9,43,205 | Note: D = Aggregate deposits, CwP = currency with public, NNML = Net non-monetary liabilities, and L = Banks credit to commercial sector net of investment in other approved securities, NFA = net foreign assets of the banking system, I = Net bank credit to government plus investment in other approved securities, Other = [Other Deposits with RBI – (net RBI credit to government + net RBI credit to commercial sector + government currency liabilities)].
Source: RBI. | The rise or fall in CD ratio is determined by dominance of deposit creation channel. When credit channel is dominant, deposits are largely created through the act of lending, and the CD ratio may rise2. When the external or investment channels dominate, deposits expand independently of credit, and the CD ratio falls. Money (M3) is created by both banks and the central bank and is increasingly being influenced by the developments in non-bank financial intermediaries (NBFIs). The following section, therefore, explains the mechanics of deposit/credit creation and its attrition in further detail by encompassing the entire financial system, explicitly including central bank, banks and NBFIs. IV.1 Currency Leakage When a depositor withdraws cash from their bank account, the deposit is eroded on the commercial bank’s liability side and the bank’s reserve balance at RBI falls correspondingly on the asset side3. The depositor now holds currency notes which are not a claim on a commercial bank, but a direct liability of a central bank. The transaction has moved money entirely off the commercial bank's balance sheet and onto the central bank's balance sheet. Therefore, during the periods of high cash withdrawals, the deposit growth may remain subdued. Further, in a phase of high credit demand and high currency demand may result into high CD ratios. The ratio of currency to aggregate deposits had a declining trend (Chart 2). However, the ratio hovered above the trend starting from March 2021. As on fortnight ending August 31, 2026, CwP growth was around 13 per cent (y-o-y) and the currency to aggregate deposit ratio was at around 15 per cent. Therefore, currently for every ₹100 deposit around 15 per cent is held in the form of currency. IV.2 Net Bank Credit to Government [A part of Bank Investments (ΔI)] IV.2.1 Government Bond Purchases by Banks When a commercial bank participates in a primary auction of Government of India (GoI) dated securities, two distinct events must be separated analytically. At the moment of auction settlement, the bank’s reserve balance at RBI is debited and the Government’s account at RBI (GoI balances) is credited. No commercial banks’ deposit is created at this stage, the commercial bank has simply exchanged one asset (reserves) for another (G-sec) and the balance sheet size of the bank remains unchanged. The deposit creation occurs only when the Government spends its bond proceeds – paying salaries to employees, making transfers to beneficiaries, or settling contractor invoices. At that point, RBI debits the Government’s account and credits the banks’ account with it. On the banks’ balance sheet, balances with RBI increases and on the liability side deposits are created. At this point the bank’s balance sheet expands. Therefore, fresh deposits are created at the moment of fiscal expenditure, not at the moment of bond issuance. It may be observed that on average the GoI balances have remained elevated since 2022 onwards (Chart 3). 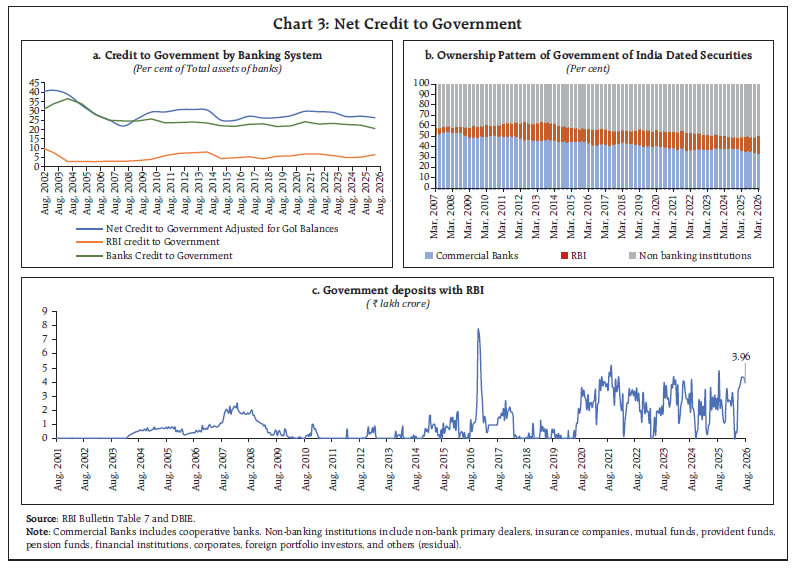 The banking sector's net credit to government as a percentage of total assets has declined recently, which could be attributed to reduction in banks’ investments. Notwithstanding this reduction, excess Statutory Liquidity Ratio (SLR) remained at 7.9 per cent (of net demand and time liabilities) as on August 31, 2026. Meanwhile, with the rapid growth of non-banking institutions, they have now surpassed commercial banks as the largest holders of government securities (Chart 3). Within non-banking institutions the share of insurance funds remained highest. IV.2.1.1 Net Credit to Government Extended by NBFI’s Unlike banks, when an NBFI bids successfully at a primary auction and settles its purchase, it pays out of its deposit account at a commercial bank. That deposit is debited, reducing the bank's deposit liability and simultaneously reducing the bank's reserve balance at RBI as the funds are transferred to the government's account. At this point, deposits have been lowered and no new deposit is yet created. Deposits are recreated only in the second step, when the government spends those proceeds. Therefore, the net credit to Government through NBFIs reduces deposits in the short term and becomes deposit neutral in the medium to long term, unlike banks where fresh deposits are created once the government spends. IV.2. 2 From Primary to Secondary Market: RBI’s Open Market Operations (OMO) When RBI purchases G-secs from banks in the secondary market (OMO purchases), in the selling bank's balance sheet, balances with RBI go up and their G-sec holdings go down. For commercial banks, this is a rebalancing on the asset side, and no new deposits are created in this transaction (as this is simply an intrabank swap of assets). | Table 2: G-sec Auctions and OMOs | | Item | Banks Deposit | NBFI Deposits with Banks | | G-sec Auction | No deposits are created at this stage only GoI balances increase. | Equivalent deposit amount is eroded. GoI balances increases. | | As Government Spends | Bank deposits are created and GoI balances reduces. | Deposits are recreated and GoI balances reduce. | | RBI OMO Purchase | No deposits are created as it is intrabank asset swap. | Equivalent Deposit amount created. | For OMO purchases from NBFIs, the dynamics change. For NBFIs which do not hold accounts with the RBI, the RBI credits the account of intermediary banks with reserves, and those banks simultaneously credit the NBFIs' deposit accounts (Table 2). This expands the banks' balance sheets and results in fresh deposit creation at this leg. Thus, OMO purchases from banks do not have a direct impact on credit and deposit, however, OMO purchases from NBFIs increase bank deposits. IV.3 Net Foreign Exchange Assets: The External Sector Channel (ΔNFA) IV. 3.1 Exporter Remittances and Current Account Inflows When an exporter receives a dollar remittance, it sells the foreign currency to an authorised dealer bank. When the bank credits the exporter's account, it creates deposits on the liability side, while simultaneously acquiring foreign currency assets. Similarly, when an importer purchases dollars using its existing deposits, deposits with banks are lowered on the liability side and foreign assets of the banks reduce thus reducing the size of bank balance sheet. In general, if there is a current account deficit, then banking sector deposits are adversely affected as deposits are reduced due to foreign currency payments outweigh deposits created on account of foreign currency receipts. Therefore, higher current account deficit generally dampens deposits creation capacity of banks. IV.3.2 Financial Account Inflows [Foreign Portfolio Investment (FPI), Foreign Direct Investment (FDI), Remittances] Forex inflows on account of FPI/ FDI are converted to rupees, which in turn creates bank deposits in the accounts of domestic counterparties (brokers, custodians, target companies). Non-Resident Indians (NRI)/ Foreign Currency Non-Resident Bank [FCNR (B)] deposits, routed through authorised dealers, also generate deposits in beneficiary accounts. The recent influx of FCNR (B) deposits, has substantially increased the total deposits in the banking system4. Banks can invest in foreign exchange assets. However, a large increase in foreign exchange asset, could reduce the loan portfolio of the banks, for a given balance sheet size. IV.3.3 RBI’s Purchase from Authorised Dealers When RBI purchases foreign currency from banks (authorised dealers), it increases the RBI's net foreign assets as well as the banks’ balances with the RBI. This results in creation of base money (reserve money or high-powered money) into the domestic economy. For banks, this again will be an intrabank exchange of assets and do not create new deposits. In India, banking system’s total foreign currency assets (FCA) are primarily held with RBI (Chart 4). The reserve creation through this exchange could be used for meeting CRR requirement, liquidity needs, and importantly facilitating transfer of deposits, all in turn supporting additional credit creation by banking sector. IV.4 Net Non-Monetary Liabilities (Δ NNML) IV.4.1 Income of Banks When a borrower repays a loan, it pays back both the principal and the interest. Consider a ₹100 loan with ₹5 interest: the borrower must have ₹105 in deposits to make the full repayment. The principal repayment (₹100) directly erodes an equivalent amount of deposits as the borrower's deposit balance falls, and the bank's loan asset declines accordingly. The interest payment (₹5), however, flows to the bank as income. A portion of this income is recycled back into the system through the bank's operating expenses such as salaries, vendor payments, interest on depositors' accounts, and other overheads which create deposits elsewhere. The residual portion, after meeting all expenses, constitutes the bank's profit. When this profit is retained rather than distributed as dividends, it augments the bank's capital and reserves. On the liability side, what was once a deposit liability to the money-holding sector5, a portion of it is now finally reclassified as capital and reserves. During periods of high bank profitability and low NPAs, a larger share of banking system liabilities may shift from deposits to capital. In the current phase of rising CD ratio, Indian banks’ capital position has improved significantly (Table 4 and Chart 5). IV.4.2 Revaluation In Equation (1), the revaluation-induced expansion in foreign and domestic assets is accounted for under ΔNNML. Revaluation of foreign and domestic assets expands/contracts the banking system's asset size, with the counterpart appearing as revaluation reserves on the liability side. These revaluations do not create or erode deposits, so the two cancel out and deposit creation is unaffected (Annex Table 1). V. From Banking Sector Balance Sheet to SCBs’ Balance Sheet V.1. The Balance Sheet Identity This section uses the consolidated balance sheet of SCBs to examine the different phases of credit-deposit ratio and the balance-sheet adjustments that accompanied each. Broadly, a commercial bank's balance sheet has the following essential heads: | Liabilities | Assets | | Deposits: current/savings deposits, term deposits, certificates of deposit. | Cash and balances with the Banks/RBI/FIs: CRR balances, currency chest cash, lending in call money market | | Borrowings: call and notice money, market repo and LAF/Marginal Standing Facility (MSF) borrowing, bonds | Investments in market securities: SLR holdings (government and other approved securities), non-SLR investments, investment in subsidiaries and other Investments | | Capital and reserves: paid-up equity capital, statutory and other reserves, retained earnings | Loans and advances: credit to the commercial sector | | Other Liabilities: payables, risk provisions, other liabilities | Other assets: fixed assets, account receivables | | Source: RBI. | Since assets and liabilities match at all times, and every credit creates an equivalent deposit, the following identity holds (McLeay et. al, 2014; and Jakab and Kumhof, 2015): ΔD + ΔB + ΔC + ΔOL = ΔL + ΔBal + ΔI + ΔOA ...(3) where, on the liability side, D = deposits, B = borrowings, C = capital, and OL = other liabilities; on the asset side, L = loans and advances, Bal = balances with banks and RBI, I = investments, and OA = other assets. Rearranging to isolate deposit changes: ΔD = ΔL + ΔBal + ΔI + ΔOA - ΔB - ΔC - ΔOL ...(4) This identity has a direct implication for the CD ratio. The ratio CD = L/D is not independently determined but it is the outcome of changes in all balance sheet items happening simultaneously. A rise in the CD ratio can reflect: 1. Every loan increases deposit by the same amount: credit to deposit ratio increases as deposit base is higher than credit (numerator effect). 2. Asset side rebalancing: credit could increase CD ratio with the reduction in investment, even with the same deposit base6. 3. Non-deposit sources (borrowings, capital) growing as a substitute to deposit; or any combination of these. V.2. Decomposing the change in CD Ratio from Historical Data India has experienced two clearly identifiable rising CD ratio phases as evident from the slope of the CD ratio phases from Chart 1b: September 2002 to September 2008, when the CD ratio rose from 50.8 per cent to 73.3 per cent; and September 2021 to March 2026, when it rose from 68.6 per cent to 82.2 per cent. The ratio is hovering around 82 per cent during March-August 2026. Table 3 presents an absolute balance sheet decomposition for both episodes alongside the two-intervening declining CD ratio phases; December 2008 to September 2009, when CD ratio fell from 71.9 per cent to 68.4 per cent; and March 2019 to September 2021, when it fell from 75.3 per cent to 68.6 per cent. It reports change in balance sheet items normalised by number of months (i.e., dividing change in ₹crore in a particular head by number of months in each phase). | Table 3: Normalised Balance Sheet Changes (per ₹100 of Deposit Growth) | | Item | Rising: Sep 02-Sep 08
(Phase I) | Rising: Sep 21-Mar 26
(Phase II) | Declining: Dec 08-Sep 09
(Phase I) | Declining: Mar 19-Sep 21
(Phase II) | | Deposit (base = 100) | 100.0 | 100.0 | 100.0 | 100.0 | | Asset deployment | | | | | | Advances | 85.7 | 102.2 | 44.9 | 40.9 | | Investments | 23.2 | 24.7 | 52.9 | 39.8 | | Balances with Others* | 13.5 | 3.4 | 6.5 | 30.8 | | Other Assets | 9.7 | 9.8 | −12.9 | 9.3 | | Non-deposit Sources | | | | | | Capital | 11.7 | 15.5 | 7.9 | 11.2 | | Borrowings | 9.8 | 13.6 | 1.2 | −6.0 | | Other Liabilities | 10.6 | 10.9 | −17.7 | 15.5 | *: Balances with others includes cash and balances with the Banks/RBI/FIs (e.g., CRR balances, currency chest cash, lending in call money market).
Note: Computed as (period change in item) / (period change in deposits) × 100. Negative values indicate contraction relative to start period. The data for SCBs excludes regional rural banks (RRBs).
Sources: DBIE, RBI; and authors’ calculations. | Generally, in high credit growth phases Indian banks’ incremental fund deployment in investments declines, while in low credit growth phases investments increase. So, for India it is the asset side rebalancing story as highlighted in point (2) noted above. The present phase is also marked by increase in share of credit (loans and advances) while there is a decline in share of investments (Annex Table 2). While Annex Table 2 provides absolute changes in ₹ crore, it becomes difficult to compare such changes across periods with vastly different bases and time spans. Therefore, Table 3 normalises every item to ₹ per ₹100 of deposit growth, making the two rising CD ratio phases directly comparable (Annex Chart 1). V.3. Key Findings from the Banks’ Accounts Decomposition Analysis V.3.1. Increasing CD Ratio Phase (Sep 2002-Sep 2008; and Sep 2021-Mar 2026) -
Credit-led deposit creation dominated both rising CD-ratio episodes. In the current phase (2021-26), loans and advances grew by ₹102.2 per ₹100 of deposits, meaning credit expansion exceeded the deposit increment. As every credit creates equivalent deposit, this could only happen if some of the deposit got destroyed in the form of currency with public, or if banks are increasing non-deposit liabilities (capital or borrowings). -
On the liability side of the SCBs balance sheet, the share of non-deposit sources increased in the current phase. Capital, borrowings, and other liabilities together contributed ₹40.0 per ₹100 of deposits in the current phase, compared with ₹32.1 in 2002-08. Of this increase, capital deepening (₹15.5 in Phase II vs ₹11.7 in Phase I) was the largest contributor. The accretion to banks’ capital in recent years is associated with increase in their profitability which is evident from the scatter plot (Chart 5a). -
Borrowings also increased during the current rising CD ratio phase, however, the borrowings costs declined for the banks during 2024-25 as compared with 2023-24 (Chart 5b). While annual data for 2025-26 is not yet published, with repo rate cuts in 2025, borrowing costs are expected to decline further. 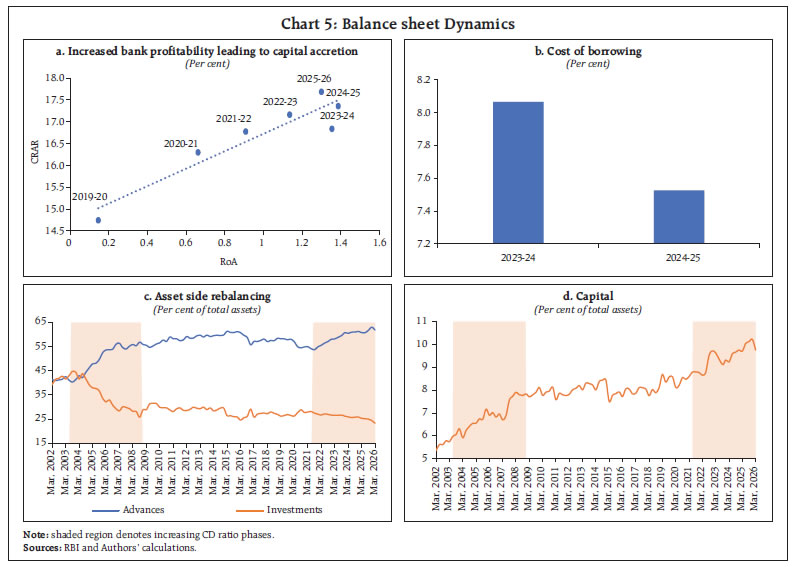
 -
In both phases of high CD ratio, banks rebalanced their asset portfolios away from investments to loans and advances. For every ₹100 deposits generation, banks were investing only ₹23.2 and ₹24.7 during phase I and phase II of the rising CD ratio. V.3.2. Declining CD Ratio Phase (Dec 2008-Sep 2009; and Mar 2019-Sep 2021) -
During the two declining phases, the increase in banks’ investments generally accompanied the deposit growth. In the pandemic phase, of every ₹100 of deposits mobilised, ₹39.8 were invested by the banks. This number was even higher in the post GFC period, when banks invested ₹52.9. This reflects the pattern wherein banks pare down investments when credit growth is strong and rebuild them when it slows. -
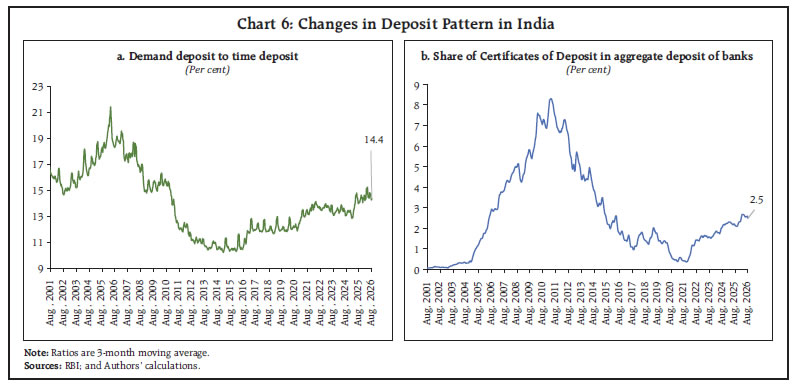
Finally for better clarity, time series charts that include both increasing and declining CD ratio phases are plotted which confirms the same analysis (Chart 5c and d). The share of loans and advances to total asset increased, while the share of investments declined on the asset side during the high- CD phase. On the liability side of banks’ balance sheet, share of capital (non-deposit funds) to total asset increased during the high CD phase. V.4. Is high CD Ratio a Constraint? While the CD ratio attracts considerable attention, the ratio by itself does not represent the underlying funding situation. During high CD ratio phase, profitability considerations and/or prudential regulations may restrain credit creation at the margin. The paragraph below summarises how presently they do not pose any binding constraint to the banking sector. In recent years, Indian savers have shifted from traditional fixed deposits to financial market products offered by NBFIs like mutual funds, the latter tend to park these inflows as high-velocity deposits (i.e., deposits with high run-off factor). The trend is reflected both in the rising demand deposit to time deposit ratio and the share of certificates of deposit in total deposits, which though rising, remain low relative to their historic highs (Chart 6a and b). In theory, this shift could raise asset-liability mismatch concerns, and also have higher liquidity risk implications. However, Indian banks are currently maintaining an LCR of around 125 per cent and Certificates of Deposit to Deposit ratio at only around 2.5 per cent. Further, the health of the banking sector has improved markedly during the recent rising CD ratio phase with gross NPAs at historic lows, CRAR remaining well above regulatory thresholds, and profitability ratios [return on asset (RoA) and return on equity (RoE)] strengthening considerably (Table 4 and Chart 5.a). All these suggest that the recent rise in CD ratio coincides with a sound banking system, where prudential targets are adequately satisfied. | Table 4: Improving Health of Indian banking Sector | | (Per cent) | | Period | CRAR* | CET 1 Ratio* | LCR | RoA* | RoE* | Gross NPAs to Gross Advances* | Net NPAs to Net Advances* | PCR | Slippage | | 2010 | 14.5 | - | - | 1.0 | 12.9 | 2.5 | 1.2 | - | - | | 2011 | 14.2 | - | - | 1.1 | 13.6 | 2.4 | 1.0 | - | - | | 2012 | 14.2 | - | - | 1.1 | 13.4 | 2.9 | 1.4 | - | - | | 2013 | 13.9 | - | - | 1.0 | 12.9 | 3.4 | 1.7 | - | - | | 2014 | 13.0 | 9.9 | - | 0.8 | 9.5 | 4.1 | 2.3 | 40.3 | - | | 2015 | 12.9 | 10.0 | - | 0.8 | 9.3 | 4.6 | 3.4 | 41.7 | 3.3 | | 2016 | 13.3 | 10.5 | - | 0.3 | 3.3 | 7.8 | 4.6 | 41.9 | 6.3 | | 2017 | 13.7 | 10.5 | 124.9 | 0.4 | 4.3 | 9.6 | 5.5 | 43.5 | 5.6 | | 2018 | 13.8 | 10.7 | 127.3 | -0.2 | -2.2 | 11.5 | 6.1 | 48.3 | 7.3 | | 2019 | 14.3 | 11.4 | 128.9 | -0.1 | -1.5 | 9.2 | 3.8 | 60.5 | 3.7 | | 2020 | 14.7 | 11.8 | 145.0 | 0.1 | 1.2 | 8.3 | 2.9 | 66.2 | 3.7 | | 2021 | 16.3 | 13.2 | 158.9 | 0.7 | 7.9 | 7.3 | 2.4 | 67.4 | 2.8 | | 2022 | 16.8 | 13.7 | 147.1 | 0.9 | 9.9 | 5.9 | 1.7 | 69.0 | 2.7 | | 2023 | 17.2 | 13.9 | 143.5 | 1.2 | 11.6 | 3.9 | 1.0 | 74.1 | 1.8 | | 2024 | 16.8 | 14.0 | 130.3 | 1.3 | 13.6 | 2.8 | 0.6 | 76.2 | 1.5 | | 2025 | 17.4 | 14.8 | 132.5 | 1.4 | 13.5 | 2.3 | 0.5 | 76.3 | 1.4 | | 2026 | 17.7 | 15.3 | 124.2 | 1.3 | 12.5 | 1.8 | 0.4 | 75.6 | 1.2 | -: Not Available.
Source: DBIE; and Report on Trend and Progress of Banking in India, RBI. | VI. Conclusion India's credit-deposit ratio has risen from 68.6 per cent in September 2021 to 82.2 per cent in March 2026. In FY2027, incremental CD ratio peaked in May 2026 and stood at around 114 per cent and has been declining since then. Against this backdrop, this article starts by visiting economic theory relating to bank financing credit through equivalent deposit (or money) creation. In the modern (digital) monetary system, banks do not need to mobilise liabilities (such as deposits) first for credit creation, and therefore deposits may not be a limiting factor. In this framework, CD ratio may change due to several factors. This may include adjustment on both asset and liability sides of the banking system’s balance sheet. -
Both credit and investments by banks create simultaneous deposits. Therefore, generally deposit base is greater than credit base. This difference in bases mechanically leads to an increase in CD ratio, for an equal increase in credit and deposit. -
Moreover, when it comes to meeting additional regulatory requirements or deposit transfers, then bank may liquidate its investments and/ or not rollover their maturing investments. This may result in increase in CD ratio and decline in investment-deposit ratio. This article finds that during the recent phase of increase in CD ratio, investment-deposit ratio has declined. -
Furthermore, on the liability side, deposits could also be complemented by non-deposit liabilities (such as capital and borrowings) leading to increase in CD ratio. In the current phase, bank capital has increased backed by increase in profitability (RoA and RoE). This, in turn, has helped in sustaining the rise in CD ratio from liability side. -
Moving over to the banking system’s balance sheet, which includes, both RBI and banks’ balance sheet, the recent increase in currency with public (CwP) has been a prominent source of leakage of deposits. In the recent period, currency to deposit ratio has been above its long-term trend. However, the trend itself is a declining one and therefore, its role in attrition of deposits would diminish going forward. -
When NBFIs invest in G-secs, they do not create new deposits. With the rapid rise of non-banking institutions, they have now surpassed commercial banks as the largest holders of G-secs. This may also have changed the dynamics of deposit creation, thereby impacting CD ratio. -
While credit creation is primarily governed by risk adjusted profit considerations of a bank, a new loan and risk management through prudential measures could restrain unlimited credit creation. -
In this regard, while there has been a change in the saving pattern, where financial products (e.g., mutual funds) are garnering deposits, the runoff factor of such deposits might have increased as compared with stable household fixed deposits. However, this may not also be a constrain for banking sector in credit creation as the LCR is well above the regulatory requirements. -
The inflow of foreign capital creates fresh deposits in the banking system. The recent inflows through FCNR(B) scheme have bolstered deposits, resulting in decline in incremental CD ratio from its peak observed in May 2026. In conclusion, the finding of this article indicates that CD ratio, by itself, may not be an appropriate metric to gauge funding vulnerability of a banking system that is experiencing high credit growth. Rather, a holistic review of the overall dynamics of credit and deposit creations/attritions and the interplay among various balance-sheet components in response to these dynamics should be undertaken. Indeed, the current phase of rising CD ratio, coincides with a growing economy along with profitable and a sound banking system, where prudential targets are adequately satisfied. Therefore, high CD ratio per se does not signal constraints in credit creation or funding vulnerability for the banking system. References: Arrow, K. J. (1963). Uncertainty and the welfare economics of medical care. The American Economic Review, 53(5), 941–973. Berry, S., Harrison, R., Thomas, R., and Weymarn, Iain de (2007), Interpreting movements in broad money, Bank of England Quarterly Bulletin, Q3. Bowman, J., Hack M. and Waring M. (2018), Non-bank Financing in China, Bulletin, Reserve Bank of Australia. Chander, J. Gavaskar, G., Nain, A. (2026), Credit–Deposit Ratio and Central Bank’s Balance Sheet, Economic and Political Weekly, Vol. LXI, No. 38. Pg 40-46. Diamond, Douglas W., and Philip H. Dybvig (1983), Bank Runs, Deposit Insurance, and Liquidity, Journal of Political Economy 91 (3): 401–419. Fukuda, S. I. (2018). Companies’ financial surpluses and cash/deposit holdings. Public Policy Review, 14(3), 369-396. Hutchinson P., Manning P. and Searle, E (2026), Developments in Banks' Funding Costs and Lending Rates, Reserve Bank of Australia. IMF (2003), Japan's Lost Decade: Policies for Economic Revival, Editors: Tim Callen and Jonathan D. Ostry, Washington D.C. Jakab, Z. and Kumhof, M. (2015). Banks are not intermediaries of loanable funds -and why this matters. Bank of England Working Paper No. 529. McLeay, M., Radia, A., and Thomas, R. (2014). Money creation in the modern economy. Bank of England Quarterly Bulletin, 54(1), 14–27. RBI (2026). Financial Stability Report, June 2026.
Annex | Table 1: Impact of NNML on Deposit Creation | | | Asset side | Liability side | Effect on deposits | | Profit of Banks | Unchanged | Deposits ↓, Capital ↑ | Transformed | | Borrowings | Unchanged | Deposits ↓, borrowings ↑ | Transformed | | Revaluation | Securities / FX assets ↑ | Revaluation reserves ↑
(within NNML) | None | | Source: Authors’ Calculations. |
| Table 2: Balance Sheet Changes Across CD Ratio Phases (Normalised by number of months) | | (₹ crore) | | Item | Rising CD Ratio Phase | Declining CD Ratio Phase | | Sep 2002 – Sep 2008 | Sep 2021 – Mar 2026 | Dec 2008 – Sep 2009 | Mar 2019 – Sep 2021 | | Deposit | 30,967 | 2,00,720 | 58,279 | 1,04,171 | | Capital | 3,635 | 31,074 | 4,621 | 11,649 | | Borrowings | 3,028 | 27,297 | 698 | -6,239 | | Other liabilities | 3,275 | 21,885 | -10,339 | 16,130 | | Balances with Others | 4,177 | 6,736 | 3,768 | 32,035 | | Investments | 7,186 | 49,573 | 30,837 | 41,459 | | Loans and advances | 26,548 | 2,05,064 | 26,174 | 42,564 | | Other Assets | 2,995 | 19,604 | -7,520 | 9,653 | Note: Figures represent period-end changes. Negative values indicate contraction. The data for SCBs excludes regional rural banks (RRBs).
Sources: DBIE, RBI; and authors’ calculations. |
|