by Purnendu Kumar, Snigdha Yogindran, Sukti Khandekar and Bhavyashree K^ This article examines the investment intentions of private corporates in India during 2025-26 and assesses the investment outlook for 2026-27, based on the projects sanctioned by select banks and financial institutions (FIs), external commercial borrowings (ECBs), and initial public offerings (IPOs). The private corporate investment intentions remained resilient during 2025-26 despite persistent global uncertainties and growing geopolitical fragmentation. The total cost of projects sanctioned by select banks and FIs increased to ₹4.4 lakh crore during 2025-26 from ₹3.7 lakh crore a year ago, reflecting sustained investment intentions by the private corporate sector. During 2026-27, the investment outlook is expected to remain healthy. Introduction Private corporate investment continues to be a key pillar of India’s medium to long-term growth. While the investment cycle has strengthened1, the outlook is being shaped by an increasingly uncertain global economic environment. Heightened geopolitical tensions, evolving trade policies, persistent global financial market volatility, and uncertainty surrounding commodity prices have tempered business confidence and investment decisions across several economies. Nevertheless, the Indian economy has continued to exhibit resilience, supported by robust domestic demand, prudent macroeconomic policies, and sustained capital expenditure (capex). Despite emerging headwinds, India remains among the fastest-growing major economies2 with real GDP growth of 7.8 per cent in 2025-26, providing a conducive environment for private investment. The balance sheet position of Indian corporates has strengthened considerably over recent years, driven by deleveraging and robust internal accruals. These gains have provided companies the financial resilience to navigate the heightened uncertainties that characterised the investment environment in 2025-26. Simultaneously, the domestic banking system, underpinned by strong capital and liquidity buffers, and improvement in asset quality and sustained credit growth, continues to support economic activity (RBI, 2026). Against this backdrop, assessing the evolving trajectory of private corporate investment in India, assumes significance. While the medium-term fundamentals remain favourable, the near-term investment outlook is shaped by the interplay between domestic resilience and external uncertainties. This article seeks to examine whether private corporate investment intentions have remained resilient despite the uncertain global environment, identify the sectors and regions driving new investment proposals, and assess the evolving role of alternative financing channels beyond traditional bank credit such as external commercial borrowings (ECBs) and initial public offerings (IPOs). Given the inherent lag in the availability of corporate financial statements, several countries rely on survey-based approaches to assess the near-term outlook for private corporate investment and companies’ future expansion plans. Such surveys provide timely, forward-looking information on the magnitude and timing of planned investments, enabling an early assessment of investment intentions that are likely to materialise over the near to medium term. In the Indian context, the Reserve Bank has been tracking private capex plans by collecting data related to projects funded by select banks and financial institutions (FIs) for assessing investment outlook. This article analyses the characteristics, funding sources, sectoral and regional distribution, and phasing plan3 of capex projects undertaken by private corporates in 2025-26. The article draws on multiple sources like banks and FIs sanctions, ECBs, and equity issuances. By focusing on the timing and composition of proposed capex, the article aims to provide valuable forward-looking insights into the investment cycle for 2026-27. Analysis indicates that the total cost of projects sanctioned by select banks and FIs increased during 2025–26. ‘Power’ industry continued to account for the largest share of investment. Maharashtra emerged as the top state in attracting capex projects, followed by Gujarat and Rajasthan. Financing through the ECB route strengthened, although funds mobilised via the IPO route declined. Further, the phasing profile of pipeline projects4 financed through all the three channels (banks and FIs sanctions, ECBs, and IPOs) points to an increase in envisaged capital expenditure in 2026-27 over the previous year, suggesting that the private investment cycle is likely to retain its momentum and continue to support growth. The article is structured into six sections. Section II outlines the methodology and assumptions. Section III discusses the key features of projects sanctioned by select banks and FIs during 2025-26, including the funding pattern and sectoral/ regional distribution. Evaluation of the phasing profile and estimates of the investment growth outlook are presented in section IV. Section V presents the corporate investment financed by private placement of bonds and debentures, and FDI equity inflows, while section VI concludes. II. Methodology and Assumptions To assess the short to medium term outlook of private corporate investment, this study adopts the methodological framework developed by Rangarajan (1970). The analysis draws on three main data sources reflecting diverse financing routes for capital projects: (i) private corporates’ capex projects, sanctioned by select banks and FIs5, which have attained financial closure, (ii) capex-related ECBs, including foreign currency convertible bonds (FCCBs) and rupee-denominated bonds (RDBs), and (iii) funds raised through IPOs, follow-on public offerings (FPOs), and rights issues for capex purpose. Exclusive efforts have been made to obviate double counting and any consequent overestimation of capital investment while including each project in the dataset. This is achieved by utilising internal databases of the Reserve Bank and incorporating information provided by the Securities and Exchange Board of India (SEBI). This study focuses exclusively on projects that receive funding from the aforementioned sources, having a project cost exceeding ₹10 crore, and majority ownership of private corporates. Projects with majority stake holding of Central and/or State governments, and projects initiated by trusts and educational institutions are excluded from the scope of this study. The consolidated data are presented in Annex Tables A1-A4. When horizontally read, these tables show the capital expenditures that are expected to be incurred in various years on projects, for which assistance was sanctioned in a given year. When vertically read, it shows the capital expenditures that are expected to be incurred in a year on projects to which assistance had been sanctioned in that year and in previous years. Annex Tables A5-A8 provide size-wise, purpose-wise, industry-wise and state-wise distribution of the projects sanctioned by banks and FIs. The estimates are derived under the assumption that companies adhere to their ex-ante capital expenditure plans. The changes reported in subsequent years are also taken into account. However, it is important to note that these estimates may differ from actual investments due to various reasons such as (a) modifications in project timeline or scale of planned investments, and (b) emergence of new projects or cancellation of earlier ones. Further, it needs to be recognised that the analysis presented in the article is based only on those capex projects for which private corporates approached the banks and FIs for funding or got funds through ECBs or IPOs, and accordingly, these estimates serve as a leading indicator of investment activity and may differ from national accounts-based estimates of private corporate fixed capital formation. III. Evolution of Private Corporate Investment: Characteristics of Projects Sanctioned/Contracted The long-term data on private corporate investment intentions indicate a distinct change in the investment cycle following the COVID-19 pandemic6. While investment intentions remained subdued during much of the pre-COVID period, the post-COVID phase has witnessed a sustained strengthening, with capital expenditure reaching historically high levels in recent years. During 2025–26, the banks and FIs sanctioned loans to 1,032 projects with an aggregate project cost of ₹4.4 lakh crore (of which, around 55 per cent was financed by banks and FIs), compared with 907 projects having a total project cost of ₹3.7 lakh crore in the previous year (Annex Table A1). In addition, during 2025-26, 509 private non-financial companies, raised ₹1.0 lakh crore through ECBs for capex purpose and 298 other companies raised ₹23,809 crore through domestic equity issuances under the IPO route for funding their capex needs. These companies did not avail any financing from select banks and FIs. Overall, investment intentions were recorded for 1,839 projects during 2025-26, amounting to ₹5.6 lakh crore, as against 1,581 projects in 2024-25 with investment intentions of ₹5.0 lakh crore (Annex Table A1 - A4). i) Size-wise The size composition of sanctioned projects from select banks and FIs indicates a gradual shift towards larger investment projects in the post-COVID period. Although small projects (less than ₹100 crore) consistently constituted the vast majority by number of projects, larger investments accounted for the bulk of total project costs across periods. The number of mega projects (with project cost ₹5,000 crore and above) remained relatively few till covid period, with a notable increase thereafter. The number of large projects (₹1,000 crore-₹5,000 crore) generally remained in the range of 20 to 42 during pre-COVID years. Post-COVID, the number of large projects increased, averaging around 80 projects during the period. Also, on an average, the share of mega projects in the total project costs during post-COVID remained higher than the pre-COVID share. During 2025-26, 12 mega projects and 100 large projects, got sanctioned by banks and FIs. The share of mega projects and large projects in the total project costs were 17.0 per cent and 51.3 per cent respectively (Annex Table A5). ii) Purpose-wise Greenfield (new) projects accounted for 89.2 per cent of the total cost of projects, reported by the banks and FIs during 2025–26, broadly in line with the trend observed in previous years. Greenfield investments typically infuse new and additional resources and assets into companies, thereby contributing significantly to gross fixed capital formation (GFCF). Higher investment in greenfield projects thus points to likely capacity expansion by private corporates going forward. Investment in expansion and modernisation of existing projects7 accounted for 10.5 per cent share in the total project cost during 2025-26 (Annex Table A6). iii) Industry-wise Industry-wise distribution of projects sanctioned indicates that infrastructure sector8 continued to account for the largest share of investment, although its dominance moderated following the pandemic. After rising to 74.3 per cent in 2020-21 amidst an overall COVID pandemic induced contraction in investment, its share in total project cost stabilised at around 50–55 per cent after 2022-23, alongside a sustained increase in project volumes. During 2025-26, the infrastructure sector remained the major sector accounting for 54.2 per cent share in the total cost of projects, primarily driven by investment in ‘Power’, followed by ‘Roads & Bridges’. Besides infrastructure, among the other major industries, construction, chemicals & pesticides, metal & metal products and cement also accounted for a sizeable share in the total cost of projects (Chart 1 and Annex Table A7). iv) State-wise The regional factors, for instance, accessibility of raw materials, availability of suppliers, availability of skilled labour, presence of adequate infrastructure, size of the market, growth potential, and demand conditions remained crucial in destination choice for the investment. For the analysis purpose, in this article, the projects which are spread across multiple states have been classified as “multi-state” projects. The state-wise distribution of projects sanctioned by the banks and FIs revealed that the top six states viz., Maharashtra, Gujarat, Rajasthan, Karnataka, Andhra Pradesh, and Tamil Nadu, together accounted for 67.1 per cent share in the total cost of projects during 2025-26. Share of Maharashtra, Rajasthan and Karnataka improved over the previous year (Chart 2 and Annex Table A8). IV. Phasing Profile of Investment Intentions The phasing profile of capital expenditures of projects sanctioned by the banks and FIs till the end of the financial year 2025-26 provides a near-term (one year ahead) investment outlook of private corporates. The phasing of the cohort of projects sanctioned in 2025-26 indicates that 43.2 per cent (₹1.9 lakh crore) of the total proposed capital expenditure was planned to be invested by the year-end 2025-26, while 34.5 per cent (₹1.5 lakh crore) is planned to be spent in 2026-27 and another 22.2 per cent (₹96,811 crore) in the subsequent period. Based on the phasing profile of all the projects sanctioned by the banks and FIs till 2025-26, the envisaged capex rose by 9.2 per cent to ₹3.5 lakh crore during 2025-26 over the previous year (Annex Table A1). Resources raised through the ECB and IPO routes by private corporates supplement the financing of their investment activities. From the funds raised through the ECB route for capex purposes, during 2025-26 and prior period, capital expenditure planned to be made during 2025-26 stood at ₹96,220 crore, marginally lower than that was envisaged in the previous year. Also, planned capital expenditure from the funds raised through the IPO route for capex purposes increased significantly to ₹24,975 crore in 2025-26, though its share in total envisaged capital expenditure remained low (Annex Table A2 and A3). Overall, across all funding channels, private corporate sector intended to make a total capex of ₹4.7 lakh crore in 2025-26, an increase of 6.9 per cent from the previous year’s planned capex. As the complete information on projects that will be sanctioned in 2026-27 is unavailable, the capex momentum for the reference year is evaluated using the pipeline of ongoing projects planned in years, preceding the reference years, to ensure comparability. From banks and FIs channel, this capex momentum, increased to ₹2.3 lakh crore in 2026-27 from comparable capex of ₹2.0 lakh crore in 2025-26 and from all channels, it increased to ₹3.2 lakh crore for 2026-27 from ₹2.6 lakh crore for 2025-26 (Annex Table A1 and A4). 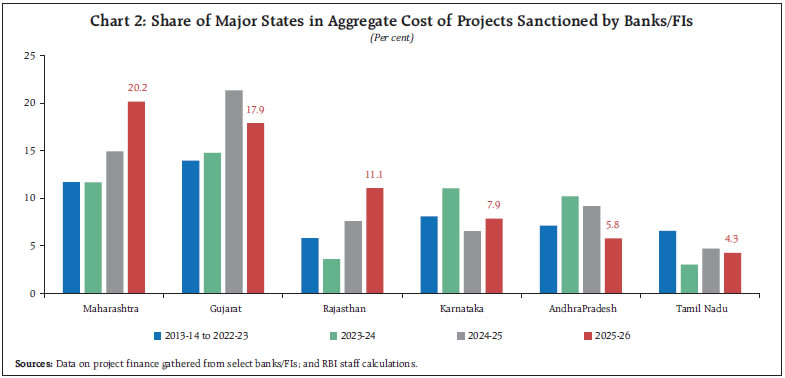 The relationship between envisaged capital investment (based on project finance data) and the GFCF of private corporates (based on National Accounts Statistics) was examined using the Autoregressive Distributed Lag (ARDL) cointegration framework. Overall, the empirical evidence indicated a statistically significant long-run relationship between envisaged capital investment and GFCF. Despite a decline in the ratio of envisaged capex to GFCF of private corporates in recent years, envisaged investment remains a reliable leading indicator of private capital formation (Box 1). Box 1: Envisaged Capex and GFCF of Private Corporates The relationship between envisaged capital expenditure (based on private corporates' projects sanctioned by select banks/FIs and funds raised through ECBs and IPOs for capex purposes) and the Gross Fixed Capital Formation (GFCF) of private corporates (based on National Accounts Statistics) is examined using the Autoregressive Distributed Lag (ARDL) cointegration framework. The ARDL approach is particularly suitable for analysing both the long-run equilibrium relationship and short-run dynamics in small samples (Pesaran and Shin, 1998). It also facilitates estimation of the error correction mechanism, which captures the speed at which deviations from the long-run equilibrium are corrected. Based on the Akaike Information Criterion (AIC), the ARDL (1,2) specification is identified as the preferred model. The Bounds test confirms the presence of a statistically significant long-run relationship between envisaged capital investment growth and private corporate GFCF growth. The estimated long-run coefficient suggests that a one per cent increase in envisaged investment is associated with an increase of about 33 basis points in private corporate GFCF. In the short run, changes in envisaged investment also exert a positive influence on GFCF. Furthermore, the error correction term is negative and statistically significant, indicating that deviations from the long-run equilibrium are corrected rapidly. The estimated coefficient of -0.98 implies that nearly the entire disequilibrium from the previous year will be corrected at a faster speed, reflecting a high speed of adjustment towards the long-run equilibrium, albeit with some oscillatory behaviour. Overall, the empirical evidence suggests that although the ratio of envisaged capex to private corporate GFCF has moderated in recent years, project finance data continue to provide a useful leading indicator of the private corporate investment cycle. The long-run association with private corporate GFCF underscores the relevance of envisaged investment in assessing the future trajectory of private capital formation. | Table 1: Envisaged Capex and GFCF of Private Corporates - ARDL (1, 2) model Estimates | | Variables | Coefficient | | Dependent variable: | | | Private corporate GFCF | | | Long-run Regressors | | | Envisaged Investment | 0.33* | | | (0.18) | | Constant | 12.94*** | | | (4.51) | | Short-run Regressors | | | D (Envisaged Investment) | 0.25** | | | (0.11) | | D (Envisaged Investment (-1)) | 0.18 | | | (0.11) | | Error correction (-1) | -0.98*** | | | (0.14) | | Bound test (F stat) | 14.87 | | Lower and Upper | 10% | 5% | 1% | | Bound Critical Values | [3.02,3.51] | [3.62,4.16] | [4.94, 5.58] | Notes: 1. ***, ** and * indicate significant at 1 per cent, 5 per cent and 10 per cent levels of significance, respectively.
2. Figures in parentheses represent standard errors.
3. Number of observations included: 53 years | References: M.H. Pesaran, Y. Shin (1998). An autoregressive distributed lag Modelling approach to cointegration analysis. In S. Strøm (Ed.), Econometrics and Economic Theory in The Twentieth Century: The Ragnar Frisch Centennial | V. Corporate Investment Financed by Private Placements and Foreign Direct Investment The structure of capital expenditure financing of investment projects is undergoing a significant transformation. While traditional bank credit remains a cornerstone, funds raised through other sources have increasingly assumed prominence9, providing corporates with additional avenues for mobilising funds. Among other sources, funds raised through private placement of bonds and debentures, and FDI equity inflow are available at aggregate level and do not separately provide the amounts utilised for capital expenditure purposes. Mobilisation of funds through private placement of debt (bonds and debentures) rose substantially during the period 2025-26 as compared to the previous year. Similarly, FDI equity inflows (accounting for around 66 per cent share in gross FDI), increased during 2025-26 as compared to the previous year (Chart 3). VI. Conclusion Private corporate investment intentions remained resilient during 2025-26 despite a challenging global environment marked by heightened geopolitical tensions, trade policy uncertainty, and volatile financial markets. The aggregate cost of projects sanctioned by the banks and FIs reached a record ₹4.4 lakh crore, reflecting sustained confidence among corporates. Infrastructure continued to dominate the investment landscape, led by the power sector. With regard to the projects sanctioned by the banks and FIs during 2025-26, 43.2 per cent of the project cost was planned to be invested by the end of financial year 2025-26, 34.5 per cent is provided for 2026-27 and the remaining 22.2 per cent is envisaged to be invested in the subsequent years. The phasing profile of pipeline projects financed through all the three channels in the years preceding the reference year, suggests that the envisaged capex could increase substantially to ₹3.2 lakh crore in 2026-27 as against comparable capex of ₹2.6 lakh crore in 2025-26, indicating sustained momentum in private investment. Looking ahead, the investment outlook is expected to remain healthy, although heightened global uncertainties are likely to temper the investment sentiment. The predominance of greenfield investments in the project pipeline reflects ongoing capacity expansion and confidence in the medium-term growth outlook. At the same time, the alternative financing channels, such as ECBs, FDI and private placements, have broadened the financing base for corporate investment. The analysis is limited to the financing channels covered in the study and excludes other sources of financing such as SEBI-registered Venture Capital Funds (VCFs), Foreign Venture Capital Investors (FVCIs) and Private Credit. Overall, India’s resilient domestic fundamentals continue to provide a strong foundation for private capital expenditure. The GFCF recorded 20.4 per cent growth at current prices during Q1:2026-27, against the growth of 5.4 per cent in the same quarter a year ago10. Further, as per the Quarterly Basic Statistical Return (BSR)-1 on Credit by Scheduled Commercial Banks (SCBs)11, term loans, which comprised 64.1 per cent of total bank credit, grew by 15.4 per cent in June 2026 as compared to 8.3 per cent a year ago. While investment intentions remain encouraging, the pace of actual capital formation will depend on the timely implementation of sanctioned projects and the evolution of the external environment. Continued policy support, macroeconomic stability, and sustained improvements in the ease of doing business will be essential for translating these investment intentions into durable capacity creation and long-term economic growth. References: Rangarajan, C. (1970). Forecasting Capital Expenditure in the Corporate Sector. Economic and Political Weekly, 5(51), 2049-2051. RBI (2026). Financial Stability Report, June. Retrieved from https://rbidocs.rbi.org.in/rdocs//PublicationReport/Pdfs/0FSRJUNE2026_300626A120EF6C37694C8C933181147F1379D7.PDF
Annex: | Table A1: Phasing of Private Capex Sanctioned by Banks/FIs | | Year of sanction ↓ | No of Projects | Project Cost in the Year of Sanction | Project Cost due to Revision/ Cancellation^ | 2013-14 | 2014-15 | 2015-16 | 2016-17 | 2017-18 | 2018-19 | 2019-20 | 2020-21 | 2021-22 | 2022-23 | 2023-24 | 2024-25 | 2025-26 | 2026-27 | Beyond 2026-27 | | Amounts in ₹ crore | | 1 | 2 | 3 | 4 | 5 | 6 | 7 | 8 | 9 | 10 | 11 | 12 | 13 | 14 | 15 | 16 | 17 | 18 | | up to | | | | 1,70,603 | 93,658 | 34,172 | 14,421 | 4,722 | 1,472 | | | | | | | | | | | 2013-14 | | | 2014-15 | 326 | 87,601 | 87,253 (0.4) | 14,920 | 34,589 | 25,765 | 9,535 | 1,246 | 162 | 1,036 | | | | | | | | | | 2015-16 | 346 | 95,371 | 91,781 (3.8) | 3,787 | 7,434 | 37,517 | 28,628 | 8,079 | 4,964 | 1,152 | 220 | | | | | | | | | 2016-17 | 541 | 1,82,807 | 1,79,249 (2.0) | 1,352 | 3,952 | 25,388 | 71,186 | 41,075 | 21,643 | 8,566 | 4,001 | 2,086 | | | | | | | | 2017-18 | 485 | 1,72,831 | 1,68,239 (2.6) | | 620 | 15,184 | 12,445 | 63,001 | 41,436 | 22,767 | 10,202 | 2,342 | 242 | | | | | | | 2018-19 | 409 | 1,76,581 | 1,59,189 (9.8) | | | 569 | 6,862 | 11,000 | 59,973 | 47,080 | 21,248 | 9,759 | 2,663 | 35 | | | | | | 2019-20 | 320 | 2,00,038 | 1,75,830 (12.1) | | | | | 4,049 | 14,524 | 53,978 | 58,556 | 28,116 | 14,114 | 2,299 | 194 | | | | | 2020-21 | 220 | 75,558 | 75,558 (0.0) | | | | | | 2,491 | 3,709 | 29,013 | 26,166 | 9,711 | 3,867 | 601 | | | | | 2021-22 | 401 | 1,43,314 | 1,42,173 (0.8) | | | | | | | 3,594 | 10,607 | 59,601 | 44,294 | 18,483 | 3,552 | 1,646 | 396 | 0 | | 2022-23 | 546 | 2,66,547 | 2,71,551 (1.9) | | | | | | | 1,127 | 2,150 | 14,820 | 84,098 | 93,058 | 51,867 | 21,566 | 1,819 | 1,046 | | 2023-24 | 944 | 3,90,978 | 3,91,203 (0.1) | | | | | | | | 2,235 | 6,783 | 39,455 | 1,63,475 | 1,16,087 | 44,670 | 11,585 | 6,912 | | 2024-25 | 907 | 3,67,973 | 3,68,041 (0.0) | | | | | | | | | 1,476 | 3,073 | 13,048 | 1,26,733 | 1,28,217 | 61,951 | 33,542 | | 2025-26 | 1,032 | 4,35,111 | | | | | | | | | | 2,256 | 2,118 | 4,734 | 23,185 | 1,55,751 | 1,50,255 | 96,811 | | Grand Total& | | | | 1,90,662 | 1,40,253 | 1,38,595 | 1,43,077 | 1,33,172 | 1,46,665 | 1,43,009 | 1,38,232 | 1,53,405 | 1,99,768 | 2,98,999 | 3,22,219 | 3,51,850 | 2,26,007 | 1,38,311 | | Percentage change | | | | | -26.4 | -1.2 | 3.2 | -6.9 | 10.1 | -2.5 | -3.3 | 11.0 | 30.2 | 49.7 | 7.8 | 9.2 | # | | &: Column totals indicate envisaged capex in a particular year covering the projects which received financial assistance in various years. The estimate is ex ante incorporating only envisaged investments. They are different from those actually realised/utilised.
#: Per cent change for 2026-27 is not worked out as capex from proposal that are likely to be sanctioned in 2026-27 is not yet available.
^: Figures in bracket are percentage of revision/cancellation. |
| Table A2: Phasing of Private Capex* Funded through ECBs/ FCCBs/RDBs** | | Year of sanction ↓ | No of LRNs issued | ECB Amount | 2013-14 | 2014-15 | 2015-16 | 2016-17 | 2017-18 | 2018-19 | 2019-20 | 2020-21 | 2021-22 | 2022-23 | 2023-24 | 2024-25 | 2025-26 | 2026-27 | Beyond 2026-27 | | Amounts in ₹ crore | | | 1 | 2 | 3 | 4 | 5 | 6 | 7 | 8 | 9 | 10 | 11 | 12 | 13 | 14 | 15 | 16 | 17 | | up to 2013-14 | | | 78,864 | 27,376 | 4,896 | | | | | | | | | | | | | | 2014-15 | 478 | 57,327 | | 36,791 | 16,806 | 3,151 | 575 | 2 | 2 | | | | | | | | | | 2015-16 | 314 | 38,885 | | | 28,998 | 7,311 | 2,572 | 4 | | | | | | | | | | | 2016-17 | 346 | 22,154 | | | | 14,953 | 6,005 | 1,192 | 2 | 2 | | | | | | | | | 2017-18 | 419 | 37,896 | | | | | 17,822 | 13,054 | 6,484 | 529 | 7 | | | | | | | | 2018-19 | 515 | 72,490 | | | | | | 46,221 | 17,725 | 1,236 | 5,398 | 1,844 | 66 | | | | | | 2019-20 | 495 | 95,491 | | | | | | | 65,367 | 17,157 | 11,717 | 965 | 285 | | | | | | 2020-21 | 362 | 40,564 | | | | | | | | 21,865 | 13,574 | 3,219 | 1,675 | 231 | | | | | 2021-22 | 363 | 51,059 | | | | | | | | 13 | 29,315 | 16,554 | 5,089 | 89 | | | | | 2022-23 | 393 | 81,101 | | | | | | | | | | 33,927 | 31,785 | 14,438 | 950 | | | | 2023-24 | 433 | 1,50,421 | | | | | | | | | | | 76,336 | 34,178 | 21,169 | 18,738 | | | 2024-25 | 445 | 97,598 | | | | | | | | | | | | 51,932 | 23,760 | 20,828 | 1,078 | | 2025-26 | 509 | 1,04,939 | | | | | | | | | | | | 18 | 50,342 | 47,363 | 7,216 | | Grand Total& | | | 78,864 | 64,167 | 50,700 | 25,415 | 26,974 | 60,473 | 89,580 | 40,802 | 60,011 | 56,509 | 1,15,236 | 1,00,886 | 96,220 | 86,929 | 8,294 | | Percentage change | | | | -18.6 | -21.0 | -49.9 | 6.1 | 124.2 | 48.1 | -54.5 | 47.1 | -5.8 | 103.9 | -12.5 | -4.6 | # | | *: For projects which did not receive assistance from banks/FIs.
**: Rupee Denominated Bonds (RDBs) have been included since 2016-17.
#: Percent change for 2026-27 is not worked out as capex from proposals that are likely to be drawn in 2026-27 is not yet available.
&: The estimate is ex ante incorporating only envisaged investment. They are different from those actually realised/utilised.
Note: The data are based on the ECBs/ FCCBs/ RDBs, which have been allotted loan registration number (LRN) during the period. |
| Table A3: Phasing of Private Capex Funded Through Equity Issues* | | Equity issued during ↓ | No. of Companies | Capex Envisaged | 2013-14 | 2014-15 | 2015-16 | 2016-17 | 2017-18 | 2018-19 | 2019-20 | 2020-21 | 2021-22 | 2022-23 | 2023-24 | 2024-25 | 2025-26 | 2026-27 | Beyond 2026-27 | | Amounts in ₹ crore | | 1 | 2 | 3 | 4 | 5 | 6 | 7 | 8 | 9 | 10 | 11 | 12 | 13 | 14 | 15 | 16 | 17 | | up to 2013-14 | | | 494 | 492 | 70 | | | | | | | | | | | | | | 2014-15 | 24 | 1,078 | | 189 | 557 | 332 | | | | | | | | | | | | | 2015-16 | 40 | 4,511 | | 11 | 644 | 2,753 | 849 | 183 | 71 | | | | | | | | | | 2016-17 | 29 | 1,159 | | | 14 | 471 | 368 | 163 | 143 | | | | | | | | | | 2017-18 | 51 | 1,538 | | | | | 419 | 327 | 787 | 5 | | | | | | | | | 2018-19 | 39 | 609 | | | | | | 506 | 90 | 13 | | | | | | | | | 2019-20 | 12 | 53 | | | | | | 2 | 49 | 2 | | | | | | | | | 2020-21 | 12 | 663 | | | | | | | | 139 | 421 | 84 | 19 | | | | | | 2021-22 | 27 | 3,410 | | | | | | | | 10 | 757 | 1,304 | 939 | 400 | | | | | 2022-23 | 42 | 3,629 | | | | | | | | | | 1,172 | 2,181 | 276 | | | | | 2023-24 | 123 | 6,310 | | | | | | | | | | 58 | 2,999 | 2,316 | 937 | | | | 2024-25 | 229 | 32,295 | | | | | | | | | | | 199 | 15,951 | 12,643 | 2,739 | 764 | | 2025-26 | 298 | 23,809 | | | | | | | | | | | | 286 | 11,395 | 8,382 | 3,746 | | Grand Total& | | | 494 | 692 | 1,285 | 3,556 | 1,636 | 1,181 | 1,140 | 169 | 1,178 | 2,618 | 6,337 | 19,229 | 24,975 | 11,121 | 4,510 | | Percentage change | | | | 40.1 | 85.7 | 176.7 | -54.0 | -27.8 | -3.5 | -85.2 | 597.0 | 122.2 | 142.1 | 203.4 | 29.9 | # | | *: Projects which did not receive assistance from banks/FIs/ECBs/FCCBs/RDBs.
#: Per cent change for 2026-27 is not worked out as capex from proposals that are likely to be implemented in 2026-27 is not yet available.
&: The estimate is ex ante incorporating only envisaged investment, they are different from those actually realized / utilised. |
| Table A4: Phasing of Private Capex Funded Through Banks/FIs/ECBs/FCCBs/RDBs*/IPOs | | Year of sanction ↓ | No of Projects or Companies | Project Cost | 2013-14 | 2014-15 | 2015-16 | 2016-17 | 2017-18 | 2018-19 | 2019-20 | 2020-21 | 2021-22 | 2022-23 | 2023-24 | 2024-25 | 2025-26 | 2026-27 | Beyond 2026-27 | | Amounts in ₹ crore | | 1 | 2 | 3 | 4 | 5 | 6 | 7 | 8 | 9 | 10 | 11 | 12 | 13 | 14 | 15 | 16 | 17 | | up to 2013-14 | | | 2,49,961 | 1,21,526 | 39,138 | 14,421 | 4,722 | 1,472 | | | | | | | | | | | 2014-15 | 828 | 1,45,658 | 14,920 | 71,569 | 43,128 | 13,018 | 1,821 | 164 | 1,038 | | | | | | | | | | 2015-16 | 700 | 1,35,177 | 3,787 | 7,445 | 67,159 | 38,692 | 11,500 | 5,151 | 1,223 | 220 | | | | | | | | | 2016-17 | 916 | 2,02,562 | 1,352 | 3,952 | 25,402 | 86,610 | 47,448 | 22,998 | 8,711 | 4,003 | 2,086 | | | | | | | | 2017-18 | 955 | 2,07,673 | | 620 | 15,184 | 12,445 | 81,242 | 54,817 | 30,038 | 10,736 | 2,349 | 242 | | | | | | | 2018-19 | 963 | 2,32,288 | | | 569 | 6,862 | 11,000 | 1,06,700 | 64,895 | 22,497 | 15,157 | 4,507 | 101 | | | | | | 2019-20 | 827 | 2,71,374 | | | | | 4,049 | 14,526 | 1,19,394 | 75,715 | 39,833 | 15,079 | 2,584 | 194 | | | | | 2020-21 | 594 | 1,16,785 | | | | | | 2,491 | 3,709 | 51,017 | 40,161 | 13,014 | 5,561 | 832 | | | | | 2021-22 | 791 | 1,96,642 | | | | | | | 3,594 | 10,630 | 89,673 | 62,152 | 24,511 | 4,041 | 1,646 | 396 | | | 2022-23 | 981 | 3,56,281 | | | | | | | 1,127 | 2,150 | 14,820 | 1,19,197 | 1,27,024 | 66,581 | 22,516 | 1,819 | 1,046 | | 2023-24 | 1,500 | 5,47,934 | | | | | | | | 2,235 | 6,783 | 39,513 | 2,42,811 | 1,52,580 | 66,776 | 30,323 | 6,912 | | 2024-25 | 1,581 | 4,97,935 | | | | | | | | | 1,476 | 3,073 | 13,247 | 1,94,616 | 1,64,620 | 85,518 | 35,384 | | 2025-26 | 1,839 | 5,63,859 | | | | | | | | | 2,256 | 2,118 | 4,734 | 23,488 | 2,17,488 | 2,06,001 | 1,07,773 | | Grand Total& | | | 2,70,020 | 2,05,112 | 1,90,580 | 1,72,048 | 1,61,782 | 2,08,319 | 2,33,729 | 1,79,203 | 2,14,594 | 2,58,895 | 4,20,573 | 4,42,334 | 4,73,046 | 3,24,057 | 1,51,115 | | Percentage change | | | | -24.0 | -7.1 | -9.7 | -6.0 | 28.8 | 12.2 | -23.3 | 19.7 | 20.6 | 62.4 | 5.2 | 6.9 | # | | *: Rupee Denominated Bonds (RDBs) have been included since 2016-17.
#: Per cent change for 2026-27 is not worked out as capex from proposals that are likely to be sanctioned in 2026-27 is not yet available.
&: The estimate is ex ante incorporating only envisaged investment, they are different from those actually realised/utilised. |
| Table A5: Size-wise Distribution of Private Projects Sanctioned by Banks/FIs: 2013-14 to 2025-26 | | Period | Number and Share (per cent) of Projects | Less than ₹100 crore | ₹100 crore to ₹500 crore | ₹500 crore to ₹1000 crore | ₹1000 crore to ₹5000 crore | ₹5000 crore & above | Total | | 2013-14 | No. of Projects | 306 | 115 | 25 | 21 | 5 | 472 | | Per cent Share | 8.3 | 20.0 | 13.9 | 29.1 | 28.7 | 100 (1,27,328) | | 2014-15 | No. of Projects | 223 | 65 | 18 | 19 | 1 | 326 | | Per cent Share | 9.0 | 16.6 | 14.6 | 47.8 | 12.0 | 100 (87,253) | | 2015-16 | No. of Projects | 214 | 76 | 34 | 21 | 1 | 346 | | Per cent Share | 8.6 | 20.9 | 26 | 38.5 | 5.9 | 100 (91,781) | | 2016-17 | No. of Projects | 287 | 180 | 29 | 40 | 5 | 541 | | Per cent Share | 5.8 | 23.3 | 11.9 | 41.7 | 17.4 | 100 (1,79,239) | | 2017-18 | No. of Projects | 263 | 149 | 28 | 42 | 3 | 485 | | Per cent Share | 5.2 | 21.0 | 10.8 | 43.8 | 19.1 | 100 (1,68,239) | | 2018-19 | No. of Projects | 220 | 110 | 39 | 36 | 4 | 409 | | Per cent Share | 4.8 | 17.0 | 17.0 | 39.6 | 21.6 | 100 (1,59,189) | | 2019-20 | No. of Projects | 150 | 84 | 45 | 36 | 5 | 320 | | Per cent Share | 3.3 | 11.9 | 18.6 | 37.4 | 28.8 | 100 (1,75,830) | | 2020-21 | No. of Projects | 128 | 52 | 15 | 24 | 1 | 220 | | Per cent Share | 5.5 | 16.8 | 14.2 | 53.5 | 10 | 100 (75,558) | | 2021-22 | No. of Projects | 199 | 127 | 37 | 36 | 2 | 401 | | Per cent Share | 5.5 | 19.8 | 20.0 | 46.9 | 7.9 | 100 (1,42,173) | | 2022-23 | No. of Projects | 267 | 158 | 50 | 63 | 8 | 546 | | Per cent Share | 3.8 | 13.6 | 13.8 | 40.1 | 28.7 | 100 (2,71,551) | | 2023-24 | No. of Projects | 483 | 266 | 107 | 77 | 11 | 944 | | Per cent Share | 4.6 | 16.6 | 20.0 | 37.1 | 21.7 | 100 (3,91,203) | | 2024-25 | No. of Projects | 502 | 233 | 87 | 75 | 10 | 907 | | Per cent Share | 5.2 | 14.6 | 17.2 | 37.4 | 25.6 | 100 (3,68,041) | | 2025-26 | No. of Projects | 597 | 244 | 79 | 100 | 12 | 1,032 | | Per cent Share | 5.0 | 13.6 | 13.2 | 51.3 | 17.0 | 100 (4,35,111) | Notes: i. Figures in brackets are total cost of projects in ₹ crore.
ii. Per cent share is the share in total cost of projects. Percentages may not total 100 due to rounding. |
| Table A6: Purpose-wise Distribution of Private Projects Sanctioned by Banks/FIs during 2013-14 to 2025-26 | | Period | Number and Share of Projects (per cent) | New | Expansion & Modernisation | Diversification | Others | Total | | 2013-14 | No. of Projects | 361 | 95 | 2 | 14 | 472 | | Percent Share | 65.2 | 20.1 | - | 14.7 | 100 (1,27,328) | | 2014-15 | No. of Projects | 203 | 92 | 2 | 29 | 326 | | Percent Share | 39.4 | 14.7 | 0.2 | 45.7 | 100 (87,253) | | 2015-16 | No. of Projects | 260 | 64 | 3 | 19 | 346 | | Percent Share | 73.6 | 14.3 | 0.1 | 12 | 100 (91,781) | | 2016-17 | No. of Projects | 429 | 97 | 4 | 11 | 541 | | Percent Share | 78.6 | 9.9 | 0.1 | 11.3 | 100 (1,79,249) | | 2017-18 | No. of Projects | 396 | 80 | 2 | 7 | 485 | | Percent Share | 89 | 9.5 | 0.1 | 1.5 | 100 (1,68,239) | | 2018-19 | No. of Projects | 309 | 80 | - | 20 | 409 | | Percent Share | 76.8 | 19.3 | - | 3.9 | 100 (1,59,189) | | 2019-20 | No. of Projects | 262 | 37 | 1 | 20 | 320 | | Percent Share | 79.8 | 13.7 | - | 6.4 | 100 (1,75,830) | | 2020-21 | No. of Projects | 181 | 38 | 1 | - | 220 | | Percent Share | 94.1 | 5.9 | - | - | 100 (75,558) | | 2021-22 | No. of Projects | 312 | 88 | 1 | - | 401 | | Percent Share | 89.1 | 10.8 | 0.1 | - | 100 (1,42,173) | | 2022-23 | No. of Projects | 439 | 101 | - | 6 | 546 | | Percent Share | 93.2 | 6.0 | - | 0.8 | 100 (2,71,551) | | 2023-24 | No. of Projects | 768 | 167 | 4 | 6 | 945 | | Percent Share | 89.1 | 8.7 | 0.1 | 2.2 | 100 (3,91,494) | | 2024-25 | No. of Projects | 741 | 163 | 5 | 6 | 915 | | Percent Share | 91.6 | 7.7 | 0.1 | 0.5 | 100 (3,71,374) | | 2025-26 | No. of Projects | 832 | 196 | 1 | 3 | 1,032 | | Percent Share | 89.2 | 10.5 | 0.0 | 0.3 | 100 (4,35,111) | Notes: i. Figures in brackets are total cost of projects in ₹ crore.
ii. Per cent share is the share in total cost of projects. Percentages may not total 100 due to rounding.
iii. A share of 0.0 per cent is attributable to rounding to one decimal place and does not necessarily indicate a zero share.
iv. ‘-‘: Nil/ Negligible. |
| Table A7: Industry-wise Distribution of Private Projects Sanctioned by Banks/FIs: 2013-14 to 2025-26 | | Industry | 2013-14 | 2014-15 | 2015-16 | 2016-17 | 2017-18 | 2018-19 | 2019-20 | 2020-21 | 2021-22 | 2022-23 | 2023-24 | 2024-25 | 2025-26 | | No. of Projects | Per cent Share | No. of Projects | Per cent Share | No. of Projects | Per cent Share | No. of Projects | Per cent Share | No. of Projects | Per cent Share | No. of Projects | Per cent Share | No. of Projects | Per cent Share | No. of Projects | Per cent Share | No. of Projects | Per cent Share | No. of Projects | Per cent Share | No. of Projects | Per cent Share | No. of Projects | Per cent Share | No. of Projects | Per cent Share | | Infrastructure | 87 | 39.7 | 74 | 48.9 | 108 | 72.0 | 204 | 62.5 | 150 | 51.7 | 122 | 60.3 | 99 | 61.5 | 63 | 74.3 | 95 | 56.2 | 134 | 58.6 | 245 | 55.5 | 207 | 50.5 | 236 | 54.2 | | i) Power | 70 | 35.1 | 65 | 42.2 | 92 | 57.1 | 170 | 45.4 | 117 | 36.5 | 78 | 26.8 | 47 | 32.9 | 35 | 49.3 | 58 | 28.9 | 53 | 20.0 | 139 | 24.3 | 146 | 39.7 | 184 | 39.6 | | ii) Telecom | 1 | - | 1 | 4.9 | 1 | 0.3 | 1 | - | - | - | - | - | - | - | - | - | - | - | - | - | 1 | 0.6 | - | - | - | - | | iii) Ports & Airports | 1 | 0.8 | - | - | 3 | 2.4 | 8 | 5.7 | 6 | 3.1 | 4 | 14.2 | 4 | 8.4 | 1 | 0.1 | 2 | 5.9 | 2 | 0.4 | 9 | 4.8 | 3 | 0.6 | 5 | 1.7 | | iv) Storage & Water Management | 5 | 1.1 | 2 | 0.6 | 4 | 4.2 | 6 | 3.7 | 2 | 0.4 | 13 | 5.7 | 4 | 0.4 | 5 | 1.2 | 2 | 0.2 | 3 | 0.8 | 4 | 0.0 | 8 | 0.2 | 7 | 1.8 | | v) SEZ, Industrial, Biotech and IT Park | 8 | 1.5 | 3 | 0.9 | 1 | 0.4 | 2 | 0.4 | 9 | 1.6 | 11 | 3.2 | 8 | 1.3 | 5 | 2.2 | 3 | 1.1 | 8 | 1.8 | 10 | 0.5 | 8 | 1.2 | 11 | 2.7 | | vi) Roads & Bridges | 2 | 1.2 | 3 | 0.3 | 7 | 7.6 | 17 | 7.3 | 16 | 10.1 | 16 | 10.4 | 36 | 18.5 | 17 | 21.5 | 30 | 20.2 | 68 | 35.6 | 82 | 25.2 | 42 | 8.9 | 29 | 8.5 | | Metal & Metal Products | 44 | 17.4 | 17 | 17.4 | 14 | 1.5 | 23 | 4.9 | 21 | 9.7 | 16 | 3.0 | 14 | 0.8 | 6 | 0.8 | 27 | 4.3 | 60 | 16.4 | 71 | 9.3 | 68 | 4.6 | 88 | 4.8 | | Construction | 27 | 2.1 | 29 | 4.0 | 26 | 1.8 | 60 | 12.0 | 39 | 5.3 | 26 | 2.3 | 44 | 11.4 | 27 | 4.8 | 22 | 7.4 | 35 | 4.0 | 56 | 8.0 | 57 | 5.6 | 109 | 11.2 | | Electrical & Electronics | 9 | 2.0 | 7 | 0.2 | 2 | 0.2 | 9 | 0.2 | 6 | 0.2 | 1 | 0.1 | 4 | - | 1 | 0.1 | 5 | 4.0 | 9 | 1.1 | 15 | 4.3 | 28 | 4.6 | 16 | 0.9 | | Food Products | 43 | 1.8 | 34 | 2.9 | 26 | 1.8 | 38 | 0.9 | 47 | 2.8 | 28 | 1.4 | 32 | 1.9 | 20 | 1.5 | 25 | 1.7 | 40 | 2.5 | 107 | 3.0 | 86 | 2.6 | 89 | 2.8 | | Chemicals & Pesticides | 15 | 1.0 | 7 | 2.6 | 11 | 1.6 | 10 | 2.1 | 23 | 11.4 | 19 | 2.9 | 12 | 1.3 | 9 | 1.6 | 20 | 3.4 | 16 | 2.2 | 33 | 2.9 | 24 | 7.9 | 51 | 5.9 | | Textiles | 58 | 10.3 | 50 | 4.1 | 49 | 4.8 | 57 | 4.1 | 54 | 3.7 | 27 | 3.4 | 11 | 0.5 | 15 | 1.8 | 56 | 4.5 | 42 | 2.7 | 58 | 2.2 | 38 | 1.2 | 48 | 1.0 | | Transport Services | 14 | 0.5 | 5 | 0.6 | 10 | 1.2 | 12 | 0.4 | 16 | 4.1 | 5 | 0.2 | 14 | 1.4 | 1 | 0.1 | 19 | 2.5 | 21 | 0.6 | 35 | 2.1 | 46 | 2.1 | 6 | 0.0 | | Coke and Petroleum Products | 1 | 0.5 | 1 | 3.4 | 2 | 2.0 | 2 | 0.5 | 1 | 0.4 | - | - | 3 | 8.0 | - | - | 7 | 1.0 | 17 | 1.1 | 28 | 1.7 | 23 | 1.8 | 3 | 1.2 | | Cement | 12 | 7.1 | 7 | 3.8 | 5 | 1.9 | 5 | 2.3 | 3 | 0.6 | 10 | 5.1 | 2 | 0.1 | 5 | 1.3 | 3 | 3.3 | 2 | 0.8 | 11 | 1.3 | 4 | 1.0 | 15 | 4.0 | | Transport Equipments and Parts | 14 | 1.0 | 7 | 5.3 | 4 | 2.5 | 9 | 3.6 | 10 | 0.3 | 5 | 0.8 | 5 | 0.4 | 2 | 0.3 | 5 | 0.4 | 16 | 0.6 | 12 | 1.2 | 16 | 1.8 | 20 | 2.3 | | Mining and quarrying | 1 | 0.6 | 2 | 0.1 | 10 | 2.7 | 4 | 0.4 | 1 | - | - | - | - | - | - | - | 1 | 0.1 | 7 | 1.8 | 11 | 1.2 | 9 | 2.2 | 4 | 0.7 | | Hotels and Restaurants | 22 | 2.2 | 15 | 1.1 | 16 | 1.1 | 12 | 0.8 | 29 | 2.9 | 26 | 1.9 | 16 | 1.7 | 4 | 2.9 | 12 | 0.9 | 13 | 0.4 | 58 | 1.1 | 61 | 1.5 | 109 | 2.1 | | Pharmaceuticals | 19 | 1.3 | 9 | 1.5 | 11 | 0.3 | 12 | 1.1 | 15 | 0.6 | 23 | 1.6 | 9 | 0.6 | 7 | 0.5 | 20 | 1.3 | 30 | 2.1 | 29 | 0.8 | 42 | 1.0 | 36 | 0.8 | | Hospitals & Health services | 10 | 0.7 | 2 | 0.1 | 1 | - | 22 | 1.1 | 18 | 1.8 | 15 | 2.6 | 12 | 0.7 | 7 | 0.3 | 19 | 2.3 | 20 | 1.0 | 25 | 0.7 | 34 | 1.5 | 35 | 1.3 | | Rubber & Plastic product | 9 | 0.3 | 8 | 0.8 | 4 | 0.5 | 8 | 0.2 | 10 | 2.5 | 5 | 0.5 | 5 | 0.3 | 17 | 2.1 | 12 | 0.8 | 13 | 0.8 | 24 | 0.7 | 35 | 1.9 | 27 | 0.6 | | IT Software | 3 | 0.1 | 1 | - | 1 | - | - | - | 1 | - | 2 | 0.7 | 1 | - | - | - | 2 | 0.6 | 4 | 1.2 | 4 | 0.6 | 10 | 3.9 | 2 | 1.6 | | Others* | 84 | 11.4 | 51 | 3.2 | 46 | 4.1 | 54 | 2.9 | 41 | 2.0 | 79 | 13.3 | 37 | 9.3 | 36 | 7.6 | 51 | 5.1 | 67 | 2.3 | 122 | 3.5 | 119 | 4.2 | 138 | 4.5 | | Total | 472 | 100 | 326 | 100 | 346 | 100 | 541 | 100 | 485 | 100 | 409 | 100 | 320 | 100 | 220 | 100 | 401 | 100 | 546 | 100 | 944 | 100 | 907 | 100 | 1,032 | 100 | | Total project cost in ₹ crore | 1,27,328 | 87,253 | 91,781 | 1,79,249 | 1,68,239 | 1,59,189 | 1,75,830 | 75,558 | 1,42,173 | 2,71,551 | 3,91,203 | 3,68,041 | 4,35,111 | *: Comprise industries like Paper & paper products, Agricultural & related activities, Manufacturing of electric and non-electric machinery, Glass & pottery, Sugar and allied products, Entertainment, Trading of services, Printing & publishing, other manufacturing and other services.
Notes: i. Per cent share is the share in total cost of project. Percentages may not total 100 due to rounding.
ii. A share of 0.0 per cent is attributable to rounding to one decimal place and does not necessarily indicate a zero share.
iii. ‘-‘: Nil/Negligible. |
| Table A8: State-wise Distribution of Private Projects Sanctioned by Banks/FIs: 2013-14 to 2025-26 | | State | 2013-14 | 2014-15 | 2015-16 | 2016-17 | 2017-18 | 2018-19 | 2019-20 | 2020-21 | 2021-22 | 2022-23 | 2023-24 | 2024-25 | 2025-26 | | No. of Projects | Per cent Share | No. of Projects | Per cent Share | No. of Projects | Per cent Share | No. of Projects | Per cent Share | No. of Projects | No. of Projects | No. of Projects | Per cent Share | No. of Projects | Per cent Share | No. of Projects | Per cent Share | No. of Projects | Per cent Share | No. of Projects | Per cent Share | No. of Projects | Per cent Share | No. of Projects | Per cent Share | No. of Projects | Per cent Share | | Andhra Pradesh | 37 | 4 | 24 | 8.1 | 33 | 12.3 | 47 | 8 | 22 | 9.9 | 29 | 11.1 | 12 | 4 | 7 | 15 | 11 | 2.1 | 27 | 4.4 | 51 | 10.1 | 28 | 9.3 | 44 | 5.8 | | Assam | 4 | 0.3 | 2 | 0.2 | 4 | 0.4 | 10 | 0.6 | 5 | 0.8 | 4 | 0.2 | 1 | 0.3 | 3 | 4.4 | 2 | 0.0 | 6 | 0.7 | 13 | 0.9 | 14 | 1.2 | 23 | 1.5 | | Bihar | 6 | 0.2 | 4 | 0.1 | 6 | 0.2 | 4 | 0.2 | 3 | 0.1 | 6 | 0.4 | 6 | 3.4 | 1 | 0 | 5 | 3.4 | 6 | 1.6 | 13 | 2.6 | 11 | 0.9 | 17 | 2.6 | | Chhattisgarh | 16 | 10.7 | 8 | 7.4 | 8 | 4.6 | 15 | 4 | 7 | 4.8 | 6 | 0.9 | 6 | 0.2 | 3 | 1.2 | 4 | 0.8 | 8 | 1.4 | 26 | 3.3 | 24 | 1.1 | 18 | 1.6 | | Delhi | 5 | 0.4 | 2 | 0.1 | 1 | 0.1 | 5 | 0.3 | 6 | 1.2 | 8 | 1.3 | 3 | 0.5 | 2 | 0.1 | 3 | 0.6 | 12 | 0.4 | 10 | 1.2 | 14 | 0.3 | 10 | 2.7 | | Goa | - | - | - | - | 1 | 0 | 3 | 0.6 | 2 | 1.9 | 3 | 1.8 | 2 | 0.1 | - | - | 3 | 3.0 | 3 | 0.8 | 4 | 0.1 | 3 | 0.6 | 2 | 0.0 | | Gujarat | 66 | 14.5 | 71 | 9.5 | 61 | 15.1 | 102 | 23 | 71 | 8 | 56 | 11.1 | 47 | 15.1 | 54 | 17.1 | 82 | 11.7 | 82 | 13.7 | 155 | 14.8 | 152 | 21.4 | 182 | 17.9 | | Haryana | 15 | 1.1 | 11 | 1.9 | 16 | 3.6 | 13 | 1.6 | 21 | 0.5 | 18 | 1.7 | 20 | 3.4 | 15 | 7.8 | 14 | 2.0 | 14 | 1.0 | 25 | 1.5 | 20 | 0.6 | 29 | 1.8 | | Himachal Pradesh | 3 | 1.8 | 3 | 0.1 | 8 | 1.4 | 1 | 0 | 8 | 2.3 | 7 | 0.3 | 6 | 0.1 | 4 | 0.2 | 7 | 1.2 | 11 | 2.2 | 10 | 0.3 | 9 | 0.1 | 11 | 0.2 | | Jammu & Kashmir | 10 | 5.2 | 2 | 0.1 | 9 | 0.2 | 3 | 0.1 | 8 | 2 | 11 | 0.4 | 3 | 0.3 | 5 | 0.2 | 5 | 0.2 | 23 | 3.1 | 36 | 1.9 | 54 | 3.8 | 8 | 0.2 | | Jharkhand | 4 | 0.3 | 2 | 0.7 | 5 | 0.3 | 1 | 0 | 3 | 0.3 | 2 | 0.5 | 4 | 9.4 | 1 | 0.2 | 6 | 0.8 | 12 | 1.8 | 17 | 3.4 | 7 | 1.3 | 20 | 1.4 | | Karnataka | 39 | 6.2 | 27 | 5.4 | 21 | 6.2 | 52 | 6.8 | 64 | 9.6 | 34 | 5.7 | 33 | 17.2 | 11 | 6.1 | 24 | 6.9 | 37 | 7.2 | 61 | 11.1 | 60 | 6.2 | 62 | 7.9 | | Kerala | 3 | 0 | 4 | 0.2 | 4 | 0.1 | 6 | 2.7 | 3 | 0.1 | 6 | 0.9 | 3 | 1 | - | - | 5 | 4.2 | 12 | 0.9 | 11 | 0.2 | 12 | 0.3 | 13 | 0.5 | | Madhya Pradesh | 30 | 6.1 | 14 | 3.9 | 21 | 7 | 18 | 7.5 | 10 | 0.7 | 12 | 1.6 | 10 | 1.2 | 19 | 2.8 | 18 | 4.2 | 35 | 4.9 | 56 | 3.4 | 41 | 2.7 | 43 | 4.1 | | Maharashtra | 76 | 19.7 | 38 | 14.8 | 36 | 9.4 | 57 | 8.8 | 65 | 23.3 | 34 | 11.5 | 41 | 6.9 | 13 | 8.5 | 44 | 9.6 | 48 | 7.8 | 93 | 11.7 | 111 | 15.1 | 132 | 20.2 | | Odisha | 10 | 11.7 | 5 | 15.9 | 6 | 3.1 | 6 | 3.1 | 5 | 3 | 9 | 1.4 | 6 | 1.9 | 2 | 0.1 | 9 | 2.2 | 12 | 13.7 | 23 | 6.7 | 18 | 4.6 | 25 | 3.3 | | Punjab | 28 | 1.5 | 6 | 0.3 | 11 | 1.7 | 29 | 2.1 | 31 | 2.2 | 15 | 1.9 | 9 | 0.8 | 4 | 0.7 | 15 | 2.2 | 20 | 2.1 | 34 | 1.6 | 28 | 1.5 | 25 | 0.4 | | Rajasthan | 24 | 1.4 | 29 | 11.1 | 10 | 0.9 | 23 | 2.8 | 33 | 6.3 | 21 | 7.7 | 23 | 3.8 | 21 | 17.1 | 32 | 12.6 | 22 | 3.0 | 61 | 3.6 | 45 | 7.3 | 85 | 11.1 | | Tamil Nadu | 33 | 5.4 | 27 | 2.9 | 26 | 9.3 | 23 | 4.4 | 28 | 6.6 | 32 | 12.8 | 28 | 8.3 | 7 | 0.7 | 40 | 8.8 | 44 | 4.7 | 83 | 3.0 | 73 | 4.8 | 99 | 4.3 | | Telangana | - | - | - | - | 10 | 3.8 | 51 | 5.5 | 17 | 1.9 | 26 | 9.1 | 12 | 4 | 9 | 1.9 | 16 | 3.4 | 30 | 1.9 | 40 | 4.1 | 42 | 2.8 | 44 | 2.8 | | Uttar Pradesh | 21 | 1.1 | 20 | 5.4 | 15 | 2.5 | 22 | 3.7 | 30 | 2.4 | 28 | 4.8 | 24 | 5.4 | 30 | 13.7 | 33 | 12.8 | 45 | 15.9 | 69 | 7.6 | 78 | 7.1 | 72 | 2.5 | | Uttarakhand | 5 | 0.1 | 5 | 0.2 | 2 | 0.1 | 11 | 0.4 | 6 | 0.4 | 9 | 0.4 | 5 | 0.1 | 2 | 0.1 | 2 | 0.4 | 5 | 0.1 | 8 | 0.1 | 14 | 0.3 | 19 | 0.5 | | West Bengal | 12 | 1.2 | 9 | 1.3 | 14 | 3.1 | 18 | 1.7 | 14 | 1.8 | 13 | 1.1 | 7 | 0.9 | 3 | 0.4 | 11 | 2.6 | 16 | 1.0 | 28 | 2.3 | 34 | 2.2 | 30 | 3.2 | | Multi-State # | 21 | 6.9 | 10 | 9.5 | 13 | 13.5 | 17 | 11.8 | 16 | 7.5 | 15 | 9.8 | 8 | 11.7 | 2 | 1.4 | 7 | 4.0 | 10 | 5.4 | 12 | 4.4 | 9 | 4.5 | 10 | 3.3 | | others* | 4 | 0.2 | 3 | 0.9 | 5 | 1.1 | 4 | 0.3 | 7 | 2.4 | 5 | 1.7 | 1 | 0 | 2 | 0.3 | 3 | 0.3 | 6 | 0.3 | 5 | 0.2 | 6 | 0.1 | 9 | 0.2 | | Total | 472 | 100 | 326 | 100 | 346 | 100 | 541 | 100 | 485 | 100 | 409 | 100 | 320 | 100 | 220 | 100 | 401 | 100 | 546 | 100 | 944 | 100 | 907 | 100 | 1,032 | 100 | | Total Cost of Projects (in ₹ crore) | 1,27,328 | 87,253 | 91,781 | 1,79,249 | 1,68,239 | 1,59,189 | 1,75,830 | 75,558 | 1,42,173 | 2,71,551 | 3,91,203 | 3,68,041 | 4,35,111 | #: Comprise projects over several states.
*: Comprise remaining states/union territories.
Notes: i. Per cent share is the share in total cost of project. Percentages may not total 100 due to rounding.
ii. A share of 0.0 per cent is attributable to rounding to one decimal place and does not necessarily indicate a zero share.
iii. ‘-‘: Nil/Negligible. |
|