September 4, 2026 The Deputy Governor
Reserve Bank of India
Mumbai Submission of the Report of the Advisory Committee on Ways and Means
Advances to State Governments The Advisory Committee on Ways and Means Advances to State Governments was constituted by the Reserve Bank on April 30, 2026, to review the existing WMA Scheme for the State Governments and to examine other related issues. The Committee has reviewed the extant WMA Scheme and other financial accommodation facilities made available to the states by the Reserve Bank. We extend our sincere thanks to the Reserve Bank for giving us this opportunity. We are pleased to submit the Report of the Committee and hope that the recommendations made by the Committee would be found useful by the Reserve Bank and the State Governments. | | | Sd/-
(I S N Prasad)
Chairman | | | | | Sd/-
(K R Jyothilal)
Additional Chief Secretary,
Keralam | Sd/-
(Alok Shekhar)
Additional Chief Secretary,
Punjab | Sd/-
(Ramesh Kumar Sudhanshu)
Principal Secretary,
Uttarakhand | | | | | Sd/-
(Vaibhav Galriya)
Principal Secretary,
Rajasthan | Sd/-
(Dr. Rohit Yadav),
Secretary,
Chhattisgarh | Sd/-
(Prashant Kumar)
Secretary,
Jharkhand | | | | | Sd/-
(Dr. R Kavita Rao)
Director,
NIPFP | Sd/-
(Ramkumar S Pandey)
Director (PF-S),
DoE, MoF, GoI | Sd/-
(Rakesh Tripathy)
CGM, IDMD, RBI
Convenor & Member Secretary |
ACKNOWLEDGEMENT The Advisory Committee would like to thank Shri Rohit Jain, Deputy Governor, Reserve Bank of India (RBI), for giving the Committee an opportunity to review the financial accommodation facilities provided to the State Governments/ Union Territories. The Committee is also thankful to Shri Ajay Kumar, Executive Director, RBI for his valuable inputs shared with the members. The Committee wishes to place on record its appreciation for the excellent secretarial support extended by Shri Harsh Kumar Gautam, Chief General Manager (currently, Regional Director, RBI, Dehradun) during initial few meetings of the Committee and other officials attached to Internal Debt Management Department (IDMD), namely, Dr. Raj Rajesh, Director; Shri Anand Prakash Ekka and Shri Sourit Das, both Assistant Advisers; and Shri Prem Kumar, Manager. The Committee is also thankful to Shri Tapas Biswas, General Manager, Department of Government and Bank Accounts; Shri Krishna Mohan Kushwaha, Director and Shri Avnish Kumar, Manager, both attached to the Monetary Policy Department for their inputs. The Committee acknowledges the efforts made by Shri Manikanta Guraja, Manager, and Shri Ajay Kumar, Assistant Manager in providing logistical assistance and other administrative support in facilitating the Committee’s meetings.
| SELECT ABBREVIATIONS | | AI | Artificial Intelligence | | ATBs | Auction Treasury Bills | | BIS | Benchmark Issuance Strategy | | bps | Basis Points | | BSF | Budget Stabilisation Fund | | CAG | Comptroller and Auditor General | | CAGR | Compound Annual Growth Rate | | CBG | Compressed Bio-Gas | | CSF | Consolidated Sinking Fund | | CSS | Centrally Sponsored Scheme | | FC | Finance Commission | | GDP | Gross Domestic Product | | GFD | Gross Fiscal Deficit | | GNCTD | Government of National Capital Territory of Delhi | | GRF | Guarantee Redemption Fund | | GSDP | Gross State Domestic Product | | IAC | Informal Advisory Committee | | IDMD | Internal Debt Management Department | | IFMIS | Integrated Financial Management and Information System | | IP | Interest Payment | | ITBs | Intermediate Treasury Bills | | ML | Machine Learning | | MTDS | Medium-Term Debt Management Strategy | | NE&H | North-Eastern and Hilly | | NIPFP | National Institute of Public Finance and Policy | | OD | Overdraft | | PD | Primary Deficit | | PFMS | Public Financial Management System | | RBI | Reserve Bank of India | | RD | Revenue Deficit | | RR | Revenue Receipts | | SASCI | Special Assistance to States for Capital Investment | | SDF | Special Drawing Facility | | SFS | State Finance Secretaries | | SNA | Single Nodal Account | | SWMA | Special Ways and Means Advances | | UT | Union Territory | | WG | Working Group | | WMA | Ways and Means Advances |
EXECUTIVE SUMMARY The Reserve Bank provides financial accommodation to states1 to manage temporary cash-flow mismatches under Section 17(5) of the Reserve Bank of India (RBI) Act, 1934. Besides Ways and Means Advances (WMA), collateralised liquidity support is also provided to the states through Special Drawing Facility (SDF) against their contributions in Consolidated Sinking Fund (CSF)/Guarantee Redemption Fund (GRF) and investments in Auction Treasury Bills (ATBs). In the order of hierarchy, SDF is availed first, followed by WMA. Once the WMA limit is exhausted, Overdraft (OD) gets triggered. 2. Over the years, the quantum of liquidity support available to the states through various facilities and their design have undergone changes, based on evolving fiscal and liquidity conditions. WMA was introduced in 1938 and in its early years, state-wise limits were set as a multiple of their minimum cash balances required to be maintained with the Reserve Bank. Since 1999, the WMA limits and the features of the other two liquidity facilities have been finalised based on the recommendations made by successive Committees/Groups constituted by the Reserve Bank. 3. Based on the recommendations made by the previous Advisory Committee (Chairman: Shri Sudhir Shrivastava), the Reserve Bank had revised the aggregate WMA limits for the states from ₹32,225 crore to ₹47,010 crore, effective from April 1, 2022. During the last few years, especially, post-pandemic (2020-22), there has been a significant increase in budget size of most of the states. Based on the request received from the states, the Reserve Bank had constituted a Group of select State Finance Secretaries in 2023 for reviewing the state-wise WMA limits. As recommended by the Group, the Reserve Bank revised the aggregate WMA limit to ₹60,1182 crore with effect from July 1, 2024. 4. In the 35th Conference of the State Finance Secretaries (SFS) held on September 18, 2025, it was decided to set up an Advisory Committee on WMA to State Governments, post release of the report of the Sixteenth Finance Commission. Accordingly, the Reserve Bank constituted an Advisory Committee on April 30, 2026, under the Chairmanship of Shri I S N Prasad, former Additional Chief Secretary, Government of Karnataka. Other members of the Committee included Finance Secretaries of six states representing different regions of the country, a representative of the Public Finance-State Finance Division (PF-S), Department of Expenditure, Ministry of Finance, Government of India, and a fiscal expert from the National Institute of Public Finance and Policy (NIPFP). Internal Debt Management Department (IDMD) of the Reserve Bank provided secretarial and research support to the Committee. 5. The Committee studied the recommendations of the Sixteenth Finance Commission (FC-XVI) and assessed their possible implications on states’ finances and their liquidity requirements. Further, the Committee also analysed the changes in the budget size of the states in the last three years (2022-23, 2023-24 and 2024-25), the recent changes in WMA limits, the conditions for availing SDF and OD, etc. With adequate provision of financial accommodation available to states through SDF/WMA/OD, the Committee is of the view that future liquidity requirements of the states due to any mismatch in receipts and payments would continue to be adequately met through various financial accommodation facilities of the Reserve Bank. 6. The Committee also observed that the number of states availing Reserve Bank’s liquidity support has come down over the years. It, however, noted that there were some states which continued to remain over-dependent on liquidity support from the Reserve Bank, almost treating it as a regular source of financing their fiscal deficit. On the other hand, there were a few states that maintained much higher amount of precautionary cash balance, just to avoid approaching the Reserve Bank for any kind of liquidity support. 7. Considering the growing budget size of the states, which could lead to higher liquidity support requirement from the Reserve Bank, the Committee is of the view that there is a case for increasing the WMA limits of the states. At the same time, the Committee is also clear that unlike in the past when WMA was the principal medium through which states availed temporary financial accommodation, SDF has become the main window for liquidity support to them in recent times. Accordingly, the WMA limits may be revised considering the overall liquidity support available to the states without necessarily matching the exact trend in which their fiscal parameters have changed over the period. 8. The Committee analysed various fiscal parameters, such as Total Expenditure, Revenue Receipts, etc., for identifying the ‘Base’ for calculation of WMA limits. The Committee is of the view that it is more appropriate to fix the state-wise WMA limits based on their ‘Revenue Receipts’ as compared to ‘Total Expenditure’. 9. The Committee recommends revision in aggregate WMA limit for the states to ₹67,839 crore from the existing limit of ₹61,008 crore, an increase of 11.2 per cent over the current limit. The Reserve Bank may consider undertaking an annual exercise of revising the WMA limits using the methodology suggested by this Committee. Considering the likely enhancement in SDF limits due to increase in size of their corpus on account of interest accrued on the invested Government securities, the annual upward revision in state-wise WMA limits may be capped at four per cent. At the same time, it may be ensured that the revised limit of any state is not set lower than its existing WMA limit. 10. In recent years, the share of states in issuance of General Government (centre and states combined) marketable debt has steadily increased. Also, the quantum of outstanding guarantees issued by the State Governments has gone up significantly. Majority of the states are yet to reach the desirable corpus level of five per cent of the outstanding marketable debt/guarantees in CSF/GRF, funds managed by the Reserve Bank on behalf of the states for meeting any payment obligation due to redemption or invocation of guarantees. To incentivise the states for making voluntary contributions to these two funds till the desirable level is reached, the Committee recommends increasing the SDF limit against the eligible investments held in CSF from the existing 50 per cent to 75 per cent. The Committee also recommends that the relaxations temporarily allowed by the Reserve Bank in January 2026 in respect of SDF against CSF/GRF may be extended beyond end-September 2026. 11. In case the corpus of CSF/GRF exceeds five per cent of state’s outstanding marketable debt/guarantees, the state may be allowed to avail liquidity support against the excess CSF/GRF balances at a rate, higher than that is applicable for SDF, which may be decided by the Reserve Bank. 12. To provide greater flexibility to the members of CSF/GRF, withdrawal from either of the funds, including, inter-fund transfer, may be permitted for any purpose, provided the balance in the source fund does not fall below five per cent, post such withdrawal/ transfer. In case the states have not reached the desired level of five per cent, they may be allowed to withdraw from CSF/GRF only for their intended purpose, i.e., for meeting redemption liabilities/invoked guarantee obligations. 13. The use of Reserve Bank’s OD facility by the states has come down in the last few years. To foster a sense of greater discipline and encourage the states to have a better assessment of their evolving liquidity needs, the Committee recommends reduction in (i) maximum number of consecutive working days, a state can remain in OD, from 14 to 10, and (ii) maximum number of working days, a state can be in OD in a calendar quarter, from 36 to 30. 14. The Committee is of the view that the interest rate charged on various kinds of financial accommodation (SDF/WMA/OD) provided to the states may be decided by the Reserve Bank, keeping in view the interest of the states and the intended purpose for which CSF/GRF are maintained. 15. The next Committee to review the WMA to State Governments may be set up post the release of report of Seventeenth Finance Commission.
I. INTRODUCTION The Reserve Bank acts as banker and debt manager to 28 State Governments3 and three Union Territories (UTs), viz., Puducherry, Jammu and Kashmir, and Delhi. I.2 In terms of Section 17(5) of the RBI Act, 1934, the Reserve Bank has been extending WMA to the State Governments since 1938 for managing temporary mismatches in their cash flows. Such advances are repayable in each case not later than three months from the date of making the advance. States are also permitted to avail short-term liquidity support beyond their WMA limits from the Reserve Bank using OD facility. The interest rate charged on WMA/OD has been fixed from time to time based on the recommendations of various Committees/Groups constituted by the Reserve Bank. Short-term collateralised financial accommodation at concessional rate is also provided to the states by the Reserve Bank through SDF4 against their investment in CSF/GRF/ATBs5. I.3 Individual state-wise WMA limits are fixed by the Reserve Bank, based on the recommendations of an Advisory Committee set up every five years or so, for a period coinciding with the term of the successive Finance Commissions. The last exercise for reviewing the methodology for fixing WMA limits was undertaken by an Advisory Committee (Chairman: Shri Sudhir Shrivastava) in 2021. Using the accounts data of state-wise total expenditure for the period 2016-17 to 2018-19, the Committee had recommended revising the aggregate WMA limit for all states to ₹47,010 crore, which was accepted by the Reserve Bank and made effective from April 01, 2022. Using the formula adopted by the Shrivastava Committee, the WMA limits were again revised in 2024 based on the recommendations of the Group of Select Finance Secretaries, constituted under the aegis of the 33rd Conference of the State Finance Secretaries held in September 2023. The revised aggregate WMA limit was fixed at ₹60,118 crore with effect from July 01, 2024. With Government of National Capital Territory of Delhi (GNCTD) entering into banking agreement with the Reserve Bank, the aggregate WMA limit for the states was further revised to ₹61,008 crore with effect from January 09, 2026. I.4 Based on deliberations during the meeting of the 35th SFS Conference held on September 18, 2025, and as recommended by the past Advisory Committees, the Reserve Bank decided to set up a new Advisory Committee to review the methodology for fixing the WMA limits for the states, post submission of the final report by the Sixteenth Finance Commission (FC-XVI). Accordingly, the Reserve Bank constituted a new Advisory Committee on April 30, 2026, under the Chairmanship of Shri I S N Prasad, former Additional Chief Secretary (Finance), Government of Karnataka. The other members of the Committee were as under: -
Shri K R Jyothilal - Additional Chief Secretary (Finance), Keralam - Member -
Shri Alok Shekhar - Additional Chief Secretary (Finance), Punjab - Member -
Shri Ramesh Kumar Sudhanshu, Principal Secretary (Finance), Uttarakhand - Member -
Shri Vaibhav Galriya, Principal Secretary (Finance), Rajasthan - Member -
Dr. Rohit Yadav, Secretary (Finance), Chhattisgarh - Member -
Shri Prashant Kumar, Secretary (Finance), Jharkhand - Member -
Dr. R Kavita Rao, Director, NIPFP - Member -
Shri Ramkumar S Pandey, Director (PF-S), MoF, GoI - Member -
Shri Rakesh Tripathy, Chief General Manager, IDMD, RBI - Convenor & Member Secretary Internal Debt Management Department of the Reserve Bank of India provided the secretarial assistance to the Advisory Committee. Terms of Reference I.5 The terms of reference of the Committee are as follows: -
To review the extant financial accommodation facilities available to the states from the Reserve Bank; -
To review the state-wise WMA limits; -
To review the operationalisation of CSF and GRF Schemes; and -
Any other issue germane to the subject. I.6 The first meeting of the Committee was held on June 04, 2026. In the meeting, members agreed to take a holistic view before recommending any revision in the existing WMA limits for the states. There was also consensus amongst the members that the financial accommodation available from the Reserve Bank may be used only for meeting short-term temporary cash flow mismatches, and not for funding deficits. I.7 The second meeting of the Committee was held on June 25, 2026, through video conference. Issues relating to over-reliance of some states on financial accommodation from the Reserve Bank, outstanding debt and guarantees issued by the states, and the methodology used by the past Committees in determining the state-wise WMA limits were discussed in the meeting. I.8 In its third meeting held on July 14, 2026, the Committee deliberated on recent changes in the pattern of financial accommodation from the Reserve Bank, availability of higher liquidity support through SDF, gradual reduction in availment of OD facility by the states, etc. I.9 The fourth and the final meeting of the Committee was held on September 4, 2026. Major recommendations of the Committee were discussed in the meeting before the report was submitted to the Reserve Bank. Structure of the Report I.10 The Report is structured into Nine Chapters. Chapter II reviews State Finances and the Recommendations of the Sixteenth Finance Commission. The evolution of Reserve Bank’s various financial accommodation facilities for the states is covered in Chapter III. Recent trends in cash management by the states is examined in Chapter IV. Chapter V reviews utilisation of various financial accommodation facilities available to the states from the Reserve Bank. Chapter VI examines possible impact of onboarding onto SNA-SPARSH on short-term liquidity requirements of the states. CSF/GRF schemes are reviewed in Chapter VII. The Committee’s approach towards determining the basis and the methodology for fixing state-wise WMA limits are discussed in Chapter VIII. The recommendations of the Committee are summarised in Chapter IX. II. STATE FINANCES AND RECOMMENDATIONS OF THE SIXTEENTH FINANCE COMMISSION In the wake of COVID-19 pandemic, fiscal position of most of the states had deteriorated owing to mounting expenditure to meet public health exigency which significantly outpaced revenues collections. The combined Gross Fiscal Deficit (GFD) of the states went up from 2.6 per cent of GDP in 2019-20 to 4.1 per cent in 2020-21. During the same period, their aggregate Revenue Deficit (RD) and Primary Deficit (PD) increased from 0.6 per cent and 0.9 per cent to 1.9 per cent and 2.1 per cent of GDP, respectively (Chart II.1). II.2 As economic activity resumed post-COVID-19, fiscal health of the states improved during the period 2021-22 to 2023-24 reflecting a combination of expenditure rationalisation, stronger GST collections and higher tax devolution on account of buoyant central revenues (Charts II.2 and II.3). II.3 The fiscal position of the states, despite improvement in revenue receipts, has come under pressure from 2024-25 onwards, on account of elevated revenue and capital expenditure. The continued emphasis on capital expenditure is, however, expected to strengthen productive capacity and support medium-term economic growth.
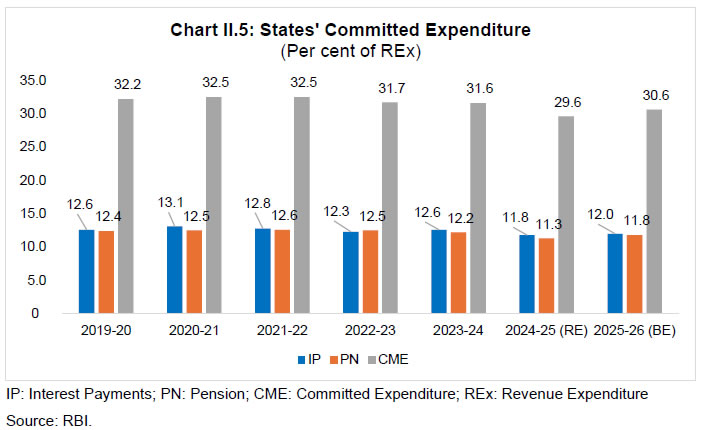
II.4 Overall, the post-pandemic fiscal trajectory indicates improvement in the revenue account, thereby, supporting fiscal consolidation (Chart II.4). Despite improvement in debt-GDP ratio of states from the peak of 31 per cent at end-March 2021 to 29.2 per cent at end-March 2026 (BE), fiscal pressures remain elevated as compared to the pre-pandemic position, particularly, due to the higher share of committed expenditure (Chart II.5). 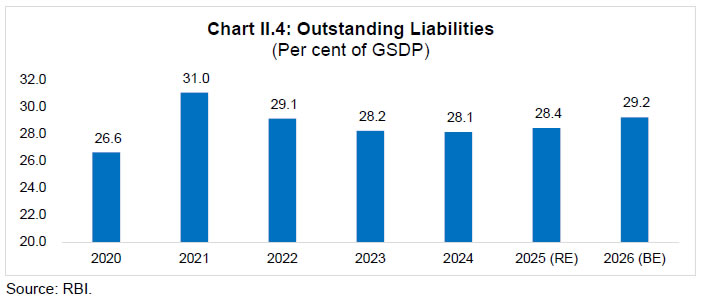
 II.5 During the period 2019-20 to 2025-26, the state-wise fiscal performance was observed to be heterogeneous. While several states, particularly, in the North-East and Eastern regions, had recorded significant improvement, a few others continued to face pressure on their revenue account due to higher committed expenditure combined with increasing non-merit expenses, increase in off-budget borrowings and other contingent liabilities. Large market borrowings and increasing outstanding debt levels need closer monitoring by the states. Thus, the key challenge for states will be to continue on the path of fiscal consolidation and to improve their quality of expenditure. Recommendations of the Sixteenth Finance Commission II.6 State finances are often characterised by inherent structural imbalances arising from the constitutional assignment of functions and resources. While the states bear primary responsibility for delivering a wide range of social and economic services, their revenue-raising powers vis-à-vis the Central Government remain limited. This asymmetry gives rise to a vertical fiscal imbalance. Recognising these structural fiscal asymmetries, the Indian Constitution provides for a system of fiscal transfers from centre to the states. Within this framework, the Finance Commission (set-up under Article 280 of the Indian Constitution) plays a pivotal role by recommending the distribution of divisible pool of resources in the form of central transfers and grants. II.7 The Sixteenth Finance Commission (FC-XVI), headed by Dr. Arvind Panagariya, submitted its report for the five-year award period (2026-31) in November 2025. Some of the major recommendations of the FC-XVI are as under: -
The vertical devolution6 or the states’ share in the divisible pool, which includes all Union tax revenues, except cess, surcharges, etc., has been retained at 41 per cent over the award period (Chart II.6). - Horizontal devolution criterion has been revised with the introduction of ‘contribution to GDP’ with a view to better align efficiency considerations as a parameter to rationalise the states’ economic productivity (Table II.1). ‘Per-capita GSDP distance’ as a criterion is used but at a reduced weight. Total Fertility Rate was replaced with demographic performance as a criterion to award states for controlling population growth. States with better demographic performance (in terms of population growth between 1971 and 2011) would benefit. Allocation based on state’s share in the census 2011 total population was increased. The weight for ‘forest cover’ has been retained at 10 per cent.
| Table II.1: Horizontal Devolution: Sharing Criteria (per cent) | | Criteria | FC-XI | FC-XII | FC-XIII | FC-XIV | FC-XV | FC-XVI | | Population (1971) | 10.0 | 25.0 | 25.0 | 17.5 | | | | Population (2011) | | | | 10.0 | 15.0 | 17.5 | | Area | 7.5 | 10.0 | 10.0 | 15.0 | 15.0 | 10.0 | | Income Distance/Fiscal Capacity/Per Capita GSDP Distance | 62.5 | 50.0 | 47.5 | 50.0 | 45.0 | 42.5 | | Index of Infrastructure | 7.5 | | | | | | | Forest | | | | 7.5 | 10.0 | 10.0 | | Total Fertility Rate/Demographic Performance | | | | | 12.5 | 10.0 | | Tax/Fiscal Effort | 5.0 | 7.5 | | | 2.5 | | | Fiscal Discipline | 7.5 | 7.5 | 17.5 | | | | | Contribution to GDP | | | | | | 10.0 | | Total | 100.0 | 100.0 | 100.0 | 100.0 | 100.0 | 100.0 | | Source: Finance Commission. | -
Revenue deficit, sector-specific, and state-specific grants have been discontinued. -
Fiscal deficit limit for the states is kept at three per cent of GSDP and 3.5 per cent of GDP for the Central Government. -
States should undertake comprehensive disclosure of off-budget borrowings in their budget documents and finance accounts. The definitions of debt and fiscal deficit under State Fiscal Responsibility Legislation should explicitly encompass off-budget borrowings. States should eliminate the use of off-budget borrowings for financing subsidies and strengthen transparency through comprehensive disclosure of subsidies and transfers in Finance Accounts. -
States should actively pursue rationalisation of electricity distribution companies (DISCOMs), supported by complementary measures to address legacy debt, and strengthen operational efficiency. -
States should rationalise subsidies by retaining only well-targeted schemes, periodically reviewing beneficiary eligibility, and eventually eliminating them. II.8 The FC-XVI exhorted the states to review and rationalise their subsidy expenditure. The Commission also noted that schemes providing unconditional cash transfers often had large and poorly targeted beneficiary bases. To improve targeting, it recommended clearly defined exclusion criteria and a rigorous review mechanism. It also recommended discontinuing the financing of subsidies through off-budget borrowings. The FC-XVI further highlighted the lack of standardisation amongst the states as far as definition and accounting of subsidies and transfers were concerned. It observed that such expenditure were often misclassified as assistance, grants or other forms of expenditure. Accordingly, it recommended adoption of a uniform framework for the accounting and disclosure of subsidies and transfers across the states. II.9 The Commission has projected that adherence to three per cent of fiscal deficit ceiling would help stabilise state debt over the medium-term. The Commission has, nevertheless, recognised considerable variation across the states, with high-debt states continuing to face constraints on their ability to undertake productive and developmental expenditure. Taken together, these assessments suggest that the post-pandemic correction has placed state finances on a more sustainable footing, while the continuation of fiscal discipline, stronger revenue mobilisation and expenditure rationalisation will remain critical to preserving this improvement over the FC-XVI award period. II.10 The Committee discussed the recommendations of FC-XVI and their likely impact on state finances. The Committee is of the view that prudent cash and debt management along with continued focus on quality of expenditure would go a long way in further improving the fiscal health of the states. III. EVOLUTION OF FINANCIAL ACCOMMODATION FACILITIES TO STATES The Reserve Bank provides short-term financial support to the states to help them manage temporary cash flow mismatches. Since 1938, uncollateralised short-term liquidity support, known as WMA, has been extended to the states (formerly called provinces), with limits initially tied to their minimum cash balances and subsequently linked to budget heads (viz., expenditure and receipts). The state-wise WMA limits were periodically revised as a multiple of their minimum cash balances till early 1999, keeping in view their perceived requirements; evolving fiscal, financial, and institutional developments; and the objectives of monetary and fiscal management7. The initiation of the Conference of SFS in 1997 induced a transformation in the approach towards formulating changes in the WMA Scheme. Since then, Advisory Committees8 have periodically been constituted by the Reserve Bank to review the prevailing WMA arrangements and recommend changes, as considered appropriate (Table III.1). The details of fixation of WMA limit by the past Committees/ Groups and their methodologies are given in Annexure 1. | Table III.1: Advisory Committees/Groups Constituted by the Reserve Bank | | Sl. No. | Year | Chairman | | 1 | 1998 | Shri B.P.R. Vithal | | 2 | 2000 | Informal Group of State Finance Secretaries | | 3 | 2003 | Shri C. Ramachandran | | 4 | 2005 | Shri M.P. Bezbaruah | | 5 | 2014 | Shri Sumit Bose | | 6 | 2019 | Shri Sudhir Shrivastava | | 7 | 2023 | Group of Select State Finance Secretaries | | Source: RBI. | III.2 In 1953, a scheme of collateralised liquidity support for the states, named Special Ways and Means Advances (SWMA) was introduced against the collateral of Government of India securities held by them. SWMA was renamed as SDF in June 2014. OD was available to the states once they had exhausted their WMA and SWMA limits. Since 1972, states’ access to OD has been restricted to a limited number of days, as decided from time to time. In the hierarchy of financial accommodation available from the Reserve Bank, states first avail SDF against the corpus of investment held in CSF/GRF/ATBs before they get into WMA/OD. III.3 During the initial years, liquidity support under SWMA was available up to a ceiling determined by multiple of the minimum cash balances9 maintained by each state. Between 1953 and 1999, SWMA limits were periodically revised but kept linked to the minimum cash balance set for each state. Based on the recommendations made by the Informal Advisory Committee (Chairman: Shri B P R Vithal), SWMA was delinked from the minimum cash balance in March 1999. Instead, states were permitted to draw SWMA against their entire holdings of Government Securities, subject to applicable haircut. III.4 Prior to May 1976, the interest rates charged on WMA was kept below the prevailing Bank Rate10. During the period from May 1976 to August 1996, differential interest rate, linked to the Bank Rate, was charged on WMA depending on the duration of WMA to discourage the states from using the facility as a means for normal budgetary resource. Since then, the rate charged on WMA has been linked to the prevailing Bank Rate (subsequently, Repo Rate) and the duration of WMA. III.5 During the initial years, the interest rate charged on SWMA was generally kept same as that applicable for WMA. Successive Committees starting from the Ramachandran Committee (2003) to Sumit Bose Committee (2016) recommended that the interest rate charged on SWMA be maintained at 100 basis points (bps) below the Bank Rate/Repo Rate. Similarly, the interest rate charged on Overdraft was linked to Bank Rate in the past and to the Repo Rate from 2005. III.6 Bezbaruah Committee (2005) recommended that the net incremental annual investments in CSF/GRF by the states should be reckoned for arriving at the maximum eligible limit of SDF11, subject to the ceiling equal to their normal WMA limits. Sumit Bose Committee (2016) recommended allowing the states to avail SDF against their net incremental annual investments in CSF/GRF without any upper limit, subject to five per cent haircut. Sudhir Shrivastava Committee (2021) did not suggest any change in the terms and conditions applicable for availment of SDF. The Reserve Bank constituted a Working Group in 2022 to review the operationalisation of CSF/GRF schemes. The Group recommended major changes in the methodology used for computing the limit for SDF available against balances held in CSF/GRF and holdings of ATBs, withdrawal from CSF/GRF, lock-in period for CSF/GRF, etc. The Group recommended fixing the maximum limit of SDF against the balances held under CSF/GRF and holdings of ATBs at 50 per cent of (i) the outstanding balance as on the last date of the second preceding quarter, or (ii) the current balance in CSF/GRF/ATBs, whichever was less. These recommendations were accepted by the Reserve Bank and made effective from July 01, 202412. III.7 During COVID-19 pandemic, the Reserve Bank decided to temporarily increase the WMA limits for individual states by 30 per cent13 with effect from April 1, 2020. With a view to providing greater avenue to the states to undertake containment and mitigation due to onset of the COVID-19, and to enable the states to plan their market borrowings, the Reserve Bank decided to further enhance the state-wise WMA limits by 60 per cent14 (aggregate WMA limit was increased to ₹51,560 crore) over and above the limits as on March 31, 2020. These enhanced limits were initially valid till September 30, 2020, and subsequently extended till March 31, 202215. III.8 Based on deliberations in the 31st SFS Conference held on March 18, 2019, the Reserve Bank constituted a new advisory Committee (Chairman: Shri Sudhir Shrivastava). Accepting the recommendations made by the Committee, the Reserve Bank revised the aggregate state-wise WMA limit to ₹47,010 crore effective from April 01, 202216. Subsequently, as discussed in the 33rd SFS Conference held on July 06, 2023, the Reserve Bank constituted a Group comprising select State Finance Secretaries to review the existing WMA limits, based on latest expenditure data of the states. III.9 Using the methodology as recommended by the Shrivastava Committee and the accounts level data for the period 2019-20 to 2021-22, the Group recommended revision in aggregate state-wise WMA limit to ₹60,118 crore. Accepting the recommendation, the Reserve Bank revised the WMA limits for individual states effective from July 01, 2024. The aggregate state-wise WMA limit was further increased to ₹61,008 crore with effect from January 09, 202617 after GNCTD entered into an agreement with the Reserve Bank. IV. RECENT TRENDS IN CASH MANAGEMENT BY STATES Efficient cash management by the states ensures that they optimally use available cash resources while maintaining enough liquidity to meet their short-term obligations. It involves planning, monitoring, and managing cash flows. Efficient cash management also helps the states in achieving fiscal sustainability. Cash Management by States IV.2 As per the bi-lateral agreement with the Reserve Bank, every state is required to maintain minimum cash balance with the Bank. Under the extant arrangement, any surplus cash balance at day-end gets automatically invested in non-marketable 14-days Intermediate Treasury Bills (ITBs) of the Central Government. This often results in a surge in Central Government’s day-end cash balances held with the Reserve Bank (Chart IV.1). States’ investment in ITBs get remunerated at the prevailing Reverse Repo Rate minus 200 bps. Besides ITBs, the states are also permitted to invest their durable surplus cash in 91/182/364 days ATBs of the Central Government by participating through non-competitive route in weekly auctions. Such investment in ATBs by the states are outside the notified amount of the respective auctions. 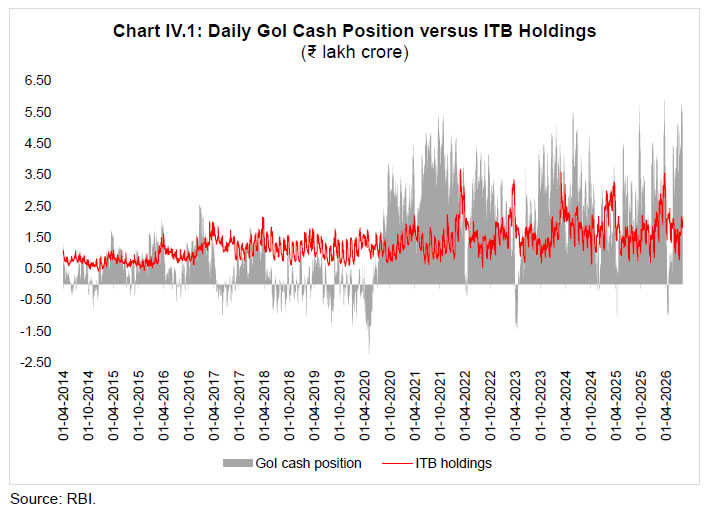 IV.3 Cash management practices vary significantly across the states. Some states are quite regular in availing liquidity support from the Reserve Bank. On the other hand, there are a few states, which avoid approaching the Reserve Bank for any kind of liquidity support and generally end up maintaining large ‘precautionary’ cash balance. Most of the states do not take full advantage of the option of investing their durable surplus cash in higher yielding ATBs. IV.4 As the states fund their fiscal deficit largely through market borrowings, maintaining large idle cash balances results in ‘negative carry’, with borrowing cost often exceeding the return earned on these balances. On an aggregate basis, the states continue to maintain sizeable cash balances, as reflected in their average investments in ITBs and ATBs (Chart IV.2). IV.5 Based on an analysis of their daily cash balances for the past few years, states can be grouped under three categories (Table IV.1). The first category comprises the states that usually maintain very low or negative cash balances and, therefore, are required to avail liquidity support from the Reserve Bank almost on a regular basis. Such states maintain, on an average, less than ₹1,000 crore in ITBs. The second category includes the states that maintain optimal cash balances and use financial accommodation sparingly. IV.6 States in the third category are the ones which consistently maintain large cash balances and seldom avail financial accommodation. Such states, on an average, maintain average daily ITB balance exceeding ₹10,000 crore. These states remain largely self-sufficient in meeting their temporary liquidity requirements. They, however, incur a ‘negative carry’ as the return earned on idle cash balances is much lower than the cost of their market borrowing. Some of them also try timing the market for their market borrowing which may prove to be challenging, especially, when markets are quite volatile. Instead, they should focus on optimising their daily cash balances. | Table IV.1: Categorisation of States by Average Daily ITB Investments | | Category | Amount
(₹ crore) | Number of States | | 2022-23 | 2023-24 | 2024-25 | 2025-26 | 2026-27
(April-July) | | I | 0 to < 500 | 8 | 11 | 11 | 11 | 8 | | 500 to < 1,000 | 4 | 3 | 4 | 3 | 4 | | II | 1,000 to < 5,000 | 7 | 5 | 2 | 5 | 7 | | 5,000 to < 10,000 | 4 | 3 | 4 | 2 | 3 | | III | 10,000 to < 20,000 | 4 | 5 | 4 | 7 | 7 | | ≥ 20,000 | 2 | 2 | 4 | 2 | 1 | | Source: RBI. | IV.7 States may strive for improving their cash management practices while appreciating the distinction between debt and cash management. The practice of resorting to market borrowing for managing short-term mismatches without taking full advantage of the Reserve Bank’s liquidity facilities may be avoided to the extent possible. Also, there are some states which tend to raise a large part of their annual market borrowing in the last quarter (January-March). These states offer various reasons for such practice. First, their major expenditure usually take place in the second half of the fiscal year. Second, states may not want to lose the borrowing opportunity once they have received the consent from the Government of India for open market borrowing. Third, states may also like to have sufficient cash balance at the start of the next financial year before they commence their annual market borrowing. IV.8 Notwithstanding the arguments put forward by the states, the strategy may have its own disadvantages. This may push up the borrowing cost for all the states during the fourth quarter due to excess supply of State Government Securities in the market. It can also lead to states sitting with large amount of idle cash balances towards the year-end (Chart IV.2 above). The Committee, therefore, recommends that the states may consider spreading out their market borrowings throughout the year. In this regard, the Committee appreciates the efforts made by the Reserve Bank in introducing Benchmark Issuance Strategy (BIS) for market borrowing, starting financial year 2026-27, which has been adopted by majority of the states. The remaining states may also adopt BIS at the earliest. IV.9 States may also identify the pattern of periodic, viz. daily, weekly, and monthly expenses to assess optimal cash balance needed. They may adopt newer techniques using Artificial Intelligence (AI)/Machine Learning (ML) techniques for analysing the historical data on receipts and expenditure and use the same for forecasting cash flows. States may consider parking their durable surplus cash balances in CSF/GRF/ATBs. IV.10 The past Committees had not made any change to the minimum cash balance requirement for the states. The present Committee is of the view that the concept of holding minimum cash balance may not have much significance, especially, after its delinking from fixation of WMA limits, and, therefore, recommends ‘status quo’ on minimum cash balance requirement for individual states (Annexure 2). V. REVIEW OF UTILISATION OF FINANCIAL ACCOMMODATION FACILITIES The Reserve Bank provides short-term financial accommodation, not exceeding three months from the date of making of the advance, to the states to tide over their temporary cash flow mismatches (please refer to Chapter IV for details). Trends and Utilisation of Financial Accommodation Facilities V.2 The financial accommodation provided by the Reserve Bank allows the states to manage their temporary cash flow mismatches, without resorting to unplanned market borrowings. V.3 The data on utilisation of the various financial accommodation facilities suggest that not all the states avail liquidity support from the Reserve Bank. There are some states which hardly borrow from the Reserve Bank. On the other hand, there are some states which avail the liquidity support quite frequently, almost on a regular basis. The number of states availing financial accommodation (even for a single day in a year) from the Reserve Bank over last few years is given at Table V.1. | Table V.1: Number of states availing Liquidity Support from the Reserve Bank | | Year | SDF | WMA | OD | | 2020-21 | 18 | 15 | 8 | | 2021-22 | 17 | 14 | 9 | | 2022-23 | 17 | 12 | 11 | | 2023-24 | 15 | 14 | 11 | | 2024-25 | 16 | 13 | 9 | | 2025-26 | 19 | 11 | 10 | | Source: RBI. | V.4 Pursuant to the changes brought about since July 2024, based on recommendations made by the Working Group on CSF/GRF (for details please refer to Chapter VII), the pattern of utilisation of financial accommodation by the states has undergone a shift, with increasing reliance on SDF relative to WMA/OD (Chart V.1). This transition reflects the growing preference for collateral-backed liquidity support available at a concessional rate, facilitated by the steady expansion of investment in eligible securities towards building buffer funds, viz. CSF and GRF. As the states have strengthened these reserve funds during last few years, quantum of liquidity support through SDF has significantly grown, thereby, reducing states’ dependence on WMA/OD. V.5 The aggregate as well as individual state-wise WMA limits18 have been increased twice during last five years, however, the aggregate WMA utilisation has remained well below the available limit (Chart V.2). This suggests that the existing framework has worked well to ensure that sufficient liquidity support, through SDF and WMA, remains available to the states to meet their temporary financing needs (Chart V.3). V.6 The Vithal Committee (1998) had noted that WMA limits need not be automatically linked to, or indexed against, a fixed base. Up to a point, mismatches between receipts and expenditure can be absorbed within the existing WMA limits even as transaction volumes grow, since higher volumes do not necessarily produce proportionally higher mismatches. The Committee also noted that any review of WMA limits should be a periodic exercise and not an automatic adjustment tied to a base figure. Echoing a similar view, Ramachandran Committee (2003) cautioned that the way forward would not be to perpetuate or expand the already generous space under WMA, but to reverse the trend of treating it as a routine budgetary resource. V.7 The present Committee recognises the need for periodic revision in WMA limits as requested by some members. Any revision in WMA limits may be based on periodic assessment of genuine cash-flow needs, instead of being mechanically indexed to change in size of the budget or any other economic variable. At the same time, it should also consider the overall liquidity support available under SDF and WMA.
V.8 Since July 2024, the Reserve Bank has allowed reckoning of outstanding stock (principal plus accrued interest) of Government securities held under CSF/GRF for determining the SDF limits. As a result, the SDF limits for the states, even if they had not made any fresh contribution to CSF/GRF, would still grow by about six per cent19 annually. The Committee is, therefore, of the view that there may not be a compelling need for a large increase in the existing WMA limits. V.9 There are a few states which have limited recourse to SDF as their CSF/GRF corpus are small. The linkage of CSF/GRF with financial accommodation not only enhances states’ capability in managing temporary liquidity mismatches by reducing dependence on WMA but also encourages creation of dedicated buffer funds. The Committee recommends states to continue investing in Reserve Funds till they reach the desirable level. V.10 The recommendations made by the successive Finance Commissions usually provide a fiscal roadmap for the states, apart from affecting the state finances. The Commission’s recommendations remain valid for its award period of usually five years. The Committee, therefore, recommends that the next Committee based review of the WMA Scheme for the states may be undertaken post release of the report of the Seventeenth Finance Commission. Overdraft Regulations V.11 On the Overdraft arrangement, the Vithal Committee (1998) noted that it had generally served as an effective disciplinary mechanism. Some states, however, continued to remain in overdraft for prolonged periods by repeatedly clearing and re-entering in overdrafts throughout the year. Such practices undermined the purpose of the OD arrangement and warranted appropriate safeguards, including, putting a limit on the number of consecutive days, a state may remain in OD. V.12 With successive revisions in WMA limits and substantial enhancement in SDF limits, instances of states availing overdraft from the Reserve Bank has come down significantly. Financial accommodation data for the period 2021-22 to 2025-26 suggests that none of the states availing OD had breached the extant stipulations of OD exceeding 14 consecutive working days, or 36 working days in a calendar quarter. Accordingly, the Committee recommends reducing the maximum number of consecutive working days a state can be in OD from 14 to 10 and the maximum number of working days a state can be in OD during a calendar quarter from 36 to 30. Applicable Rates for Financial Accommodation V.13 The extant structure of interest rates applicable for various types of financial accommodation is given in Table V.2. A historical trend on the interest rates on various financial accommodation is given at Annexure 3. | Table V.2: Interest rate on SDF, WMA and OD | | Schemes | Days/Limit | Rate of Interest | | SDF | If availed against balance in CSF/GRF | Repo Rate minus 2 per cent | | If availed against ATB holdings | Repo Rate minus 1 per cent | | WMA | If outstanding up to 3 months from the date of making the advance | Repo Rate | | If outstanding beyond three months from the date of making the advance | Repo Rate plus 1 per cent | | OD | If availed up to 100 per cent of WMA limit | Repo Rate plus 2 per cent | | If exceeds 100 per cent of WMA limit | Repo Rate plus 5 per cent | | Source: RBI. | V.14 While it is desirable to have states’ contribution to CSF/GRF being made from their surplus revenue, only 13 states had maintained revenue surplus during 2024-25, as per the latest CAG report20. This implies that majority of the member states have been contributing to these funds from their borrowings. The proceeds of states’ contribution in CSF/GRF are largely invested in Central Government dated securities. Since states usually borrow at rates higher than that for the Central Government, deployment of such funds in CSF/GRF would often result in a ‘negative carry’. This could be one of the reasons for making SDF available at a concessional rate. This may also encourage the states to contribute and maintain adequate buffer in CSF/GRF. V.15 The interest rate charged on any financial accommodation provided by the Reserve Bank may have monetary policy implications. The Committee is, therefore, of the view that the interest rate charged on various kinds of financial accommodation (SDF/WMA/OD) provided to the states may be decided by the Reserve Bank, keeping in view the interest of the states and the intended purpose for which CSF/GRF are maintained. Possible Impact on Monetary Policy Transmission V.16 Advances extended to the states under WMA constitute an autonomous driver of banking system liquidity. In practice, given their temporary nature, WMA to states is not a major driver of systemic liquidity. Moreover, states have different temporal patterns of liquidity gaps and all of them usually do not avail the facility simultaneously. V.17 The Reserve Bank’s net credit to states accounts for a very small proportion of the reserve money (0.10 per cent at end-March 2021 which increased to 0.64 per cent as at end-March 2026). On an incremental basis, net Reserve Bank credit to states (in the form of SDF/WMA/OD) accounted for a negative contribution of 0.10 per cent of accretion to reserve money as at end-March 2026, as compared to 0.20 per cent at end-March 2021. The increase in WMA limit, if any, is expected to have limited impact on money supply. Under extraordinary circumstances, if all states decide to avail liquidity support from the Reserve Bank simultaneously, it may pose some challenges for the Reserve Bank in system-wide liquidity management. VI. ONBOARDING OF STATES ONTO SNA-SPARSH Inter-Governmental transfers are essential in a country characterised by heterogenous fiscal balances of sub-national Governments. As the federal Government transfers funds to the states, maintaining transparency and efficiency in the flow of public funds assume significance. Just-in-time release of funds, synchronised with actual expenditure requirements, can address the challenges often associated with maintaining idle cash balances. VI.2 In order to better monitor the availability, utilisation of released funds and reduce idle cash balances under Centrally Sponsored Schemes (CSS), Government of India, introduced a Single Nodal Agency (SNA) system in 2021. In this system, each state designated one SNA for every individual CSS and opened a dedicated account with a scheduled commercial bank. All funds released by the Central Government under CSS were credited into this account, replacing the earlier practice of maintaining scheme-specific multiple bank accounts. The SNA system changed how the funds for CSS were managed, released, and tracked. VI.3 SNA system faced some operational challenges, such as, central ministries releasing funds in instalments of not more than 25 per cent of the amount earmarked, states struggling with cash management due to lump-sum matching grant transfers, etc. Further, subsequent releases of the centre’s share were linked to utilisation of at least 75 per cent of the previously released funds (both Central and State share). States were getting time up to 21 days to transfer the central share received in their accounts to the concerned SNA. Corresponding states’ shares for the scheme were to be released within 40 days of the release of the central share to the state. VI.4 Government of India introduced SNA-SPARSH (Real Time System of Integrated Quick Transfer) in July 2023 to improve cash management and achieve the objective of ‘just-in-time’ release of CSS funds. SNA-SPARSH connects the Public Financial Management System (PFMS), State Integrated Financial Management Information System (IFMIS), and the Reserve Bank’s e-Kuber21 platform. Under the new arrangement, funds are released in real-time when actual payments are due. This eliminates the older system of advance fund transfers and idle balances. It has facilitated the consolidation of unspent balances from over 1.5 million bank accounts of implementing agencies across the country into about 4500 bank accounts of the SNAs, thereby, bringing greater transparency and substantial cost savings for the Central Government22. It was decided to implement all the existing CSS through SNA-SPARSH in all the states from November 1, 2025. Most of the large flagship schemes have already been onboarded. All 28 states and three UTs with legislature have gone live on SNA-SPARSH. VI.5 Implementation of ‘just-in-time’ release of funds under SNA-SPARSH may have reduced the ‘flexibility’ that the states enjoyed earlier in managing cash balances and scheduling payments. As the float of Central funds is no longer available with them, some of the states have expressed concerns that the adoption of SNA-SPARSH would have an adverse bearing on states’ liquidity position. They argue that the new system has reduced the states’ flexibility in timing CSS-related fund flows, thereby, limiting the scope for them in utilising these funds for meeting their temporary cash flow mismatches (CAG, 202623). VI.6 In recent years, several measures have been taken by the Reserve Bank to help states in better managing their cash flow mismatches. Revision in the WMA limits and the guidelines for computation of SDF limits have significantly enhanced the total quantum of liquidity support available to the states. The total quantum of financial accommodation availed by the states from the Reserve Bank has remained relatively stable during recent years, especially, post introduction of SNA-SPARSH suggesting no significant surge in liquidity requirements (Chart VI.1). VI.7 The average quantum24 of funds availed by the states in the form of WMA/OD has declined with concomitant increase in average amount of SDF availed (Chart VI.2). The decline in WMA/OD has been observed even after the implementation of SNA-SPARSH (Charts VI.3 and VI.4).
VI.8 Considering the facts stated above, the Committee is of the view that while states may have experienced some challenges in their liquidity management during initial phase of onboarding onto SNA-SPARSH, they have been able to effectively manage their liquidity requirements once they got used to the new arrangement of fund transfer/release from the centre. VII. Consolidated Sinking Fund and Guarantee Redemption Fund State Governments are often faced with temporary cash flow mismatches owing to lags in receipts, revenue volatility, uneven expenditure patterns, and unforeseen fiscal shocks. These challenges, coupled with increasing fiscal uncertainty, debt-related risks, issuance of guarantees by the State Governments, etc. underscore the need for maintaining adequate reserve funds for effective cash and debt management. Reserve funds enable State Governments to build financial buffers during normal times, which can be drawn upon during stress periods to meet unforeseen obligations without disrupting their fiscal operations or resulting in additional borrowings. Also, certain economic conditions may cause revenue shortfall, thereby, limiting the states’ capacity to repay their liabilities. To address these risks, it is essential to establish a mechanism that internalises such contingencies and economic conditions; and provides states with an adequate financial cushion to meet unforeseen obligations without compromising on fiscal stability. CSF and GRF were established by the Reserve Bank to provide states with dedicated financial buffers against debt redemption obligations and contingent liabilities arising from the invocation of guarantees. VII.2 Globally, most of the federal and sub-national governments maintain their cash balances with the central bank to meet transactional needs. In several jurisdictions, cash management framework prescribes minimum cash balance levels to be maintained by the governments. From debt management perspective, maintaining an appropriate cash buffer is critical for mitigating funding risks and ensuring timely access to financing, particularly, during periods of heightened uncertainty. Many countries25 have adopted cash buffer policies for cash and debt management. VII.3 Government guarantees (as contingent liabilities) can create significant fiscal risks for the issuing Government upon their invocations (Saxena, 2017). These liabilities are generally recorded off-budget and, therefore, may not witness the same level of scrutiny and oversight as regular budgetary expenditure. To strengthen fiscal resilience against such risks, countries with sizeable guarantee exposures often establish dedicated guarantee redemption fund or accounts to meet those obligations. Several countries such as the United States, Sweden, Turkey and South Africa maintain these funds to ensure timely discharge of obligations arising from invocation of guarantee (Ulgenturk, 2017). VII.4 On behalf of the states, the Reserve Bank administers two dedicated reserve funds, CSF and GRF which are managed using voluntary contributions from the member states. CSF serves as an amortisation fund for repayment of State Government’s debt obligations, whereas GRF is used for meeting obligations arising from guarantees extended by the states. Consolidated Sinking Fund VII.5 The concept of CSF originated under the aegis of the Ninth Finance Commission (FC-IX) to find ways to meet repayment obligations of State Governments replacing the existing practice of amortization of debt carried out from their revenue collection. FC-IX recommended an institutional arrangement for amortisation of states’ market borrowings and suggested that the Reserve Bank be entrusted with the responsibility to formulate the necessary operational framework. In 1999, the Reserve Bank worked out a model and set up CSF. Originally designed to accumulate resources through annual contributions, CSF scheme gained widespread acceptance subsequently, leading to significant expansion of its corpus. To enhance the fund's effectiveness and identify suitable investment avenues, the Reserve Bank introduced a revised model in May 200626. VII.6 Over time, the Reserve Bank introduced several refinements 27 to the scheme, which encouraged more states to join in and benefit from being a member of CSF. While the overall size of CSF corpus has increased alongside the expansion of state market borrowings (Chart VII.1), the individual member-wise corpus of CSF (both in terms of absolute size as well as a percentage of outstanding marketable debt) varies significantly across states (Chart VII.2). As at end-March 2021, CSF had 24 states and one UT as members which increased to 26 states 28 and two UTs as at end-July 2026. During the same period, the outstanding balance in CSF has increased from ₹1,27,208 crore to ₹2,83,028 crore. VII.7 Individual state’s contribution to the fund may be influenced by budget priorities and fiscal conditions. While on an aggregate basis, some states have not yet reached the desirable level of five per cent of their outstanding marketable debt in CSF, there are other states which maintain a much higher balance than the desired level (Table VII.1). 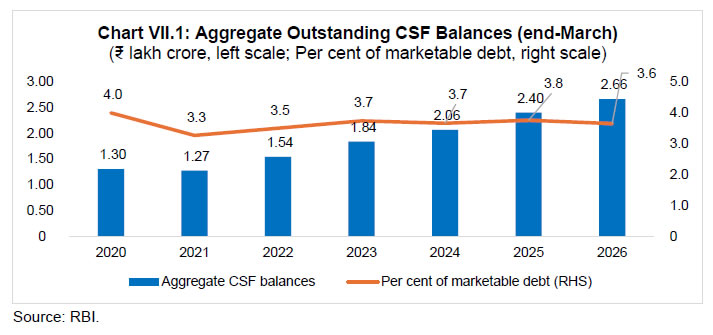
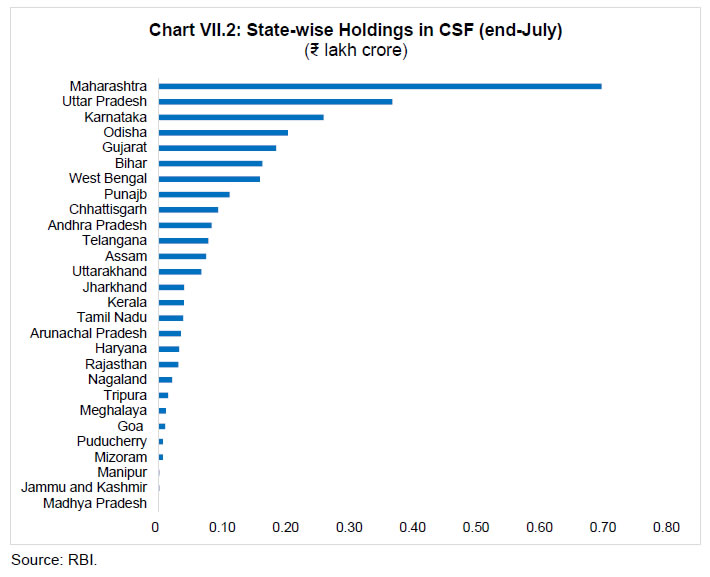
| Table VII.1: State-wise CSF Outstanding Balances as at end-July 2026 | | Sl. No. | States | Amount
(₹ crore) | CSF as per cent of Marketable Debt | | 1 | Madhya Pradesh | 0 | 0.0 | | 2 | Jammu and Kashmir | 76 | 0.1 | | 3 | Tamil Nadu | 3,845 | 0.5 | | 4 | Manipur | 77 | 0.6 | | 5 | Rajasthan | 3,095 | 0.6 | | 6 | Haryana | 3,197 | 1.0 | | 7 | Kerala | 3,966 | 1.3 | | 8 | Andhra Pradesh | 8,307 | 1.6 | | 9 | Telangana | 7,822 | 1.7 | | 10 | West Bengal | 15,903 | 2.7 | | 11 | Punjab | 11,154 | 3.5 | | 12 | Karnataka | 25,976 | 4.7 | | 13 | Goa | 1,003 | 5.1 | | 14 | Gujarat | 18,499 | 5.4 | | 15 | Bihar | 16,306 | 5.5 | | 16 | Assam | 7,442 | 5.7 | | 17 | Uttar Pradesh | 36,814 | 5.8 | | 18 | Puducherry | 644 | 6.4 | | 19 | Meghalaya | 1,100 | 6.9 | | 20 | Jharkhand | 3,991 | 7.1 | | 21 | Chhattisgarh | 9,342 | 7.4 | | 22 | Mizoram | 635 | 8.0 | | 23 | Maharashtra | 69,762 | 9.6 | | 24 | Uttarakhand | 6,691 | 9.7 | | 25 | Tripura | 1,462 | 10.7 | | 26 | Nagaland | 2,114 | 13.2 | | 27 | Arunachal Pradesh | 3,471 | 43.8 | | 28 | Odisha | 20,333 | 46.6 | | Source: RBI. | Guarantee Redemption Fund VII.8 State Government guarantees may help the state-owned enterprises in bringing down their cost of financing infrastructure projects, however, any invocation resulting from default can adversely affect a state’s fiscal position. VII.9 In 2003, the Reserve Bank came out with the GRF scheme for voluntary adoption by states. The scheme stipulated an annual contribution of at least one per cent of the outstanding guarantees to the GRF to create a corpus for addressing the fiscal risks associated with invoked guarantees. VII.10 Bezbaruah Committee proposed incentivizing the states by allowing incremental investments in CSF/GRF to be considered for SWMA, up to a ceiling equal to their normal WMA limits. Adoption of GRF by States and Inter-state variation in Contribution VII.11 The membership in GRF has increased 29 from 18 states as at end-March 2021 to 25 states and one UT as at end-July 2026. During the same period, the outstanding corpus in GRF has gone up from ₹8,405 crore to ₹58,888 crore. VII.12 The aggregate GRF contribution as well as its share as a percentage of outstanding reported guarantees by all the states have witnessed slow progress (Charts VII.3 and VII.4). Some of the states are yet to reach the desirable limit of five per cent (Table VII.2). Recent Changes in Operationalisation of CSF/GRF VII.13 Recognising the importance of having adequate reserve funds, the Reserve Bank introduced several policy measures to encourage states to contribute and strengthen the corpus of CSF and GRF. Based on the recommendations of the Advisory Committee constituted in 200530, 201531 and 201932, the incremental investments in these funds were made eligible for liquidity support through SDF at concessional rate. To further incentivise the states to contribute to CSF/GRF and encourage the remaining states to become members, the Reserve Bank in June 201833, reduced the interest rate on SDF availed against CSF/GRF to Repo Rate minus 200 bps from Repo Rate minus 100 bps. VII.14 The importance of these two funds was evident during the COVID-19 pandemic when the states experienced economic downturn, shortfall in revenues collection and had limited access to markets. In response, the Reserve Bank relaxed the rules governing withdrawal from CSF34 that helped the states in meeting redemption obligations during the year 2020-21. 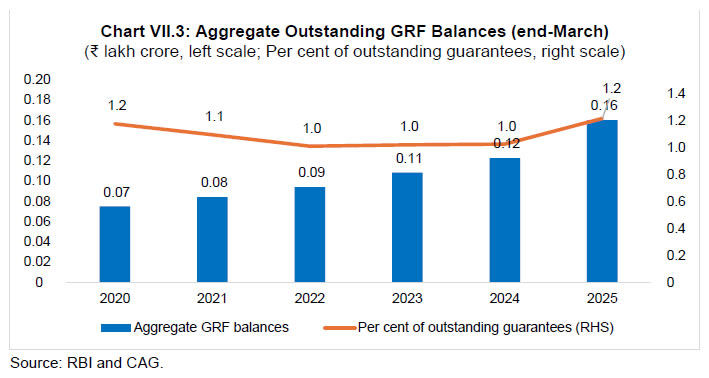
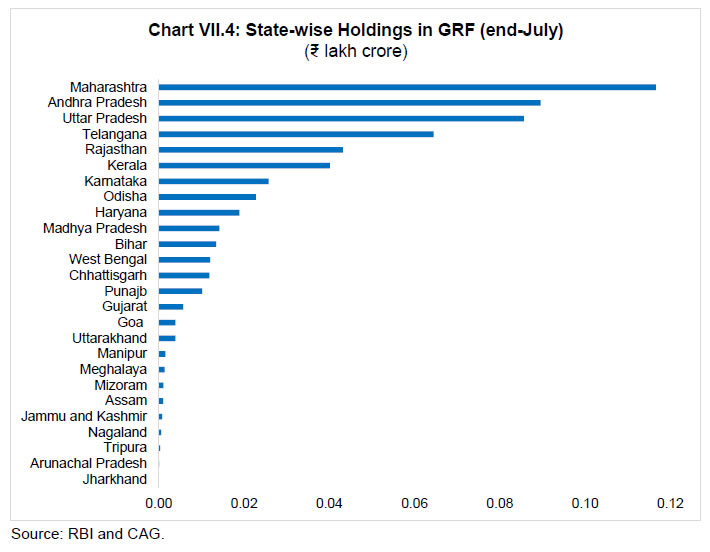
| Table VII.2: State-wise GRF Outstanding Balances as at end-July 2026 | | Sl. No. | States | Amount
(₹ crore) | GRF as per cent of Outstanding Guarantees@ | | 1 | Jharkhand | 0 | 0.0 | | 2 | Jammu and Kashmir | 76 | 0.3 | | 3 | Telangana | 6,448 | 2.7 | | 4 | Madhya Pradesh | 1,418 | 3.1 | | 5 | Rajasthan | 4,318 | 3.7 | | 6 | Assam | 100 | 3.7 | | 7 | Uttar Pradesh | 8,565 | 3.9 | | 8 | Tripura | 33 | 4.4 | | 9 | Meghalaya | 136 | 4.7 | | 10 | Kerala | 4,015 | 5.4 | | 11 | Punjab | 1,017 | 5.4 | | 12 | Bihar | 1,345 | 5.5 | | 13 | Karnataka | 2,578 | 5.6 | | 14 | Chhattisgarh | 1,186 | 5.7 | | 15 | Andhra Pradesh | 8,958 | 5.8 | | 16 | West Bengal | 1,200 | 7.1 | | 17 | Haryana | 1,888 | 7.9 | | 18 | Maharashtra | 11,661 | 9.0 | | 19 | Manipur | 156 | 10.0 | | 20 | Nagaland | 51 | 22.4 | | 21 | Arunachal Pradesh | 10 | 35.3 | | 22 | Gujarat | 568 | 40.0 | | 23 | Odisha | 2,276 | 109.5 | | 24 | Goa | 389 | 166.3 | | 25 | Mizoram | 107 | 282.1 | | 26 | Uttarakhand | 389 | 366.8 | @: Outstanding Guarantees data is sourced from CAG/Budget documents of respective states.
Source: RBI. | VII.15 During the 32nd SFS Conference held on July 7, 2022, it was decided to constitute a Working Group to undertake a comprehensive review of the operationalisation of the existing CSF/GRF schemes. Based on the recommendations made by the Working Group, the Reserve Bank brought about certain changes in the operationalisation of the schemes, effective from July 01, 2024 (Table VII.3). | Table VII.3: Revised Operational Features of Reserve Funds | | Features | CSF | GRF | | Contribution to the Fund | Member state should endeavor to build CSF corpus up to a desirable level of five per cent of its outstanding liabilities over a period of five years, from the date of constitution of the said fund | Member should endeavor to build GRF corpus up to a desirable level of five per cent of its outstanding guarantees over a period of five years, from the date of constitution of the said fund. | | Withdrawal from the Fund | Withdrawal may be allowed only for redemption of marketable debt. | Withdrawals may be allowed for meeting payment obligations arising out of invocation of guarantees. | | Lock-in period | Five years from the date of fund constitution | No lock-in period | | Withdrawal Limits | 50 per cent of the outstanding corpus held in CSF as on March 31 of the second preceding financial year, or the amount of redemption of marketable debt falling due during the year, whichever is less. | 50 per cent of the outstanding corpus held in GRF as on March 31 of the preceding financial year, or the amount of guarantees invoked during the year, whichever is less. | | Facility to avail SDF35 | Maximum limit of SDF against investment held under CSF would be 50 per cent of the lower of (i) outstanding balance as on the last date of the second preceding quarter, or (ii) the current balance in CSF. | Maximum limit of SDF against the investment held under GRF would be 50 per cent of the lower of (i) outstanding balance as on the last date of the second preceding quarter, or (ii) the current balance in GRF. | | Source: RBI. | VII.16 The revised operational guidelines on CSF/GRF were a significant departure from the earlier guidelines on withdrawal from CSF. Earlier, only the accrued ‘interest income’ was permitted to be withdrawn for meeting redemption/guarantee liabilities. Also, the revised guidelines allowed states to avail SDF against their outstanding CSF/GRF balances as against the earlier stipulation of SDF available against the incremental investment in the funds during preceding one year. These changes have led to a significant increase in the borrowing limits for the member states under SDF. This could be the primary reason for more number of states joining the funds and much higher contribution made by the member states to these funds since July 2024. VII.17 During last few years, there has been a significant increase in quantum of guarantees issued by the states. States may find it difficult to honour their obligation if large amount of guarantees extended by them get invoked. Having sufficient corpus in GRF can help the states to handle such situations. To encourage the states to increase their contribution in GRF, the Reserve Bank temporarily hiked the SDF limit in January 2026 from 50 per cent to 75 per cent of the eligible GRF balances. The ‘reference period’ for calculating the SDF availed against CSF/GRF was also changed to ‘last day of the second preceding month’ from ‘last day of the second preceding quarter’. On a review, the temporary arrangement that was initially available till end-March 2026, has been extended till September 30, 2026. The Committee recommends that the Reserve Bank may extend the arrangement beyond end-September 2026. VII.18 The Committee favours continued efforts on part of the states in building up their CSF/GRF corpus. While the extant stipulations have benefited the member states, there are a few additional operational changes that can be considered for providing greater flexibility to the states and encourage them to regularly contribute to these funds. Accordingly, the Committee makes the following recommendations: a. Building up of Corpus VII.19 States may continue with their contribution to CSF/GRF till the funds reach to a desirable level of five per cent of their outstanding marketable debt/guarantees. The Committee has consciously suggested ‘outstanding marketable debt’ for CSF as it is the single largest source of financing states’ fiscal deficit and is also easier to monitor, as data on state-wise outstanding marketable debt is being published by the Reserve Bank on a weekly basis. b. Lock-in period VII.20 Most of the states have completed five years since becoming members of CSF/GRF. At the same time, some of them, despite being member for a much longer period, have not yet reached the desirable level of five per cent in CSF/GRF. The Committee, therefore, suggests removal of any specific lock-in period for both CSF and GRF. At the same time, the remaining states may join the schemes at the earliest in their own interest. c. Withdrawal from CSF/GRF VII.21 States may be allowed to freely withdraw balances from these funds beyond five per cent of the outstanding marketable debt/ outstanding guarantees, provided the corpus in CSF/GRF does not fall below five per cent, post withdrawal. States, that have not yet reached the desirable level of five per cent, may be allowed to withdraw from the respective funds only for their intended purposes, as hitherto36. The Committee also recommends that the states may be allowed to undertake inter-fund transfer if they maintain in excess of the recommended five per cent limit in the source fund. d. SDF availed against CSF/GRF VII.22 Under the existing arrangement, interest accrued on CSF/GRF is also reckoned for determining the SDF limit. This implies that even without any fresh contribution made by a state, its SDF limit would increase. Once states achieve the minimum desirable level in CSF/GRF, any fresh accretion to the fund may ideally be out of their revenue surplus and not from market borrowing. States may focus on deploying the high cost borrowed funds for capital outlay instead of parking the same in CSF/GRF for the sake of getting higher amount of concessional rate liquidity support from the Reserve Bank. The Committee, therefore, recommends that the concessional liquidity support from the Reserve Bank under SDF may be limited to CSF/GRF balances up to five per cent of state’s outstanding marketable debt/guarantees. In case the corpus of CSF/GRF exceeds five per cent of the state’s outstanding marketable debt/guarantees, it may be allowed to avail liquidity support against the excess CSF/GRF balances at a rate higher than that is applicable for SDF, which may be decided by the Reserve Bank. VII.23 Some of the member states have not yet achieved the minimum desirable level. The outstanding stock of marketable debt of states is also likely to keep growing which would require the states to make regular contributions to CSF to maintain the desirable level. To encourage the states to contribute more generously to CSF, the Committee recommends revising the SDF limits to 75 per cent of the eligible CSF corpus from the existing 50 per cent. VII.24 Under Special Assistance to States for Capital Investment (SASCI)-2026-27, one of the criteria included under Part XI (Fiscal Discipline and Fiscal Consolidation) is ‘Transparency in Fiscal Reporting’ (Annexure 4). To meet the same, states would be expected to focus on disclosure of their gross liabilities, guarantees, off-budget borrowing, etc. on monthly basis and publication of the same on CAG website. Action by states on these aspects on a sustained basis would go a long way in boosting investors’ confidence in the State Governments in meeting their current and future obligations, including, contingent liabilities in the form of guarantees issued. VIII. FIXING OF STATE-WISE WMA LIMITS The Reserve Bank has been providing short-term financial accommodation to the states (provincial governments, as known prior to independence) since 1938 to address their temporary cash flow mismatches. In the beginning, such limits were linked to the minimum cash balances held by each state with the Reserve Bank. Fixing WMA limits as multiples of an unchanged minimum balance, however, did not adequately reflect the differing financing needs of the states, given the varying growth in their budgetary transactions over time. Informal Advisory Committee (IAC) recommended use of adjusted total expenditure in place of minimum balance for determining the state-wise WMA limits. VIII.2 Subsequently, the successive Advisory Committees and Groups, set up by the Reserve Bank, also considered various budgetary heads, such as, revenue receipts, capital expenditure, adjusted total expenditure, etc. as the ‘base’ for fixing the state-wise WMA limits (Table VIII.1). | Table VIII.1: WMA Revision – Committees/Groups | | (₹ crore) | | Sl. No. | Committees/ Groups | Base for WMA Calculation | Aggregate WMA Limit | | 1 | IAC (1999) | Total Expenditure (adjusted for revenue deficit and lotteries) | 3,941 | | 2 | Group of SFSs (2001) | Total Expenditure (adjusted for revenue deficit and lotteries) | 5,283 | | 3 | Ramachandran Committee (2003) | Revenue Receipts (adjusted for lotteries) | 7,170 | | 4 | Bezbaruah Committee (2005) | Total Expenditure (adjusted for revenue deficit, lotteries, repayment of loans) | 9,875 | | 5 | Bose Committee (2016) | Revenue Expenditure (adjusted for lotteries) plus Capital Expenditure (excluding public account items) | 32,225 | | 6 | Shrivastava Committee (2021) | Revenue Expenditure (adjusted for lotteries, natural calamities) plus Capital Expenditure (excluding financial accommodation) | 47,010 | | 7 | Group of SFS (2024) | Revenue Expenditure (adjusted for lotteries, natural calamities) plus Capital Expenditure (excluding net financial accommodation) | 60,11837 | | Source: RBI. | Selection of Base for Fixing WMA Limits VIII.3 Ramachandran Committee (2003) explicitly advocated using 'revenue receipts’ of states as the base for calculating their WMA limits. The Committee was of the view that revenue receipts reflected the states’ repayment capacity and was relatively transparent and simpler to calculate. The Committee further argued that using the capital expenditure as the base for calculating WMA limits could distort the limits due to inter-state differences in its measurement, its financing from outside the Consolidated Fund of the individual states, and the relatively small mismatches between capital receipts and expenditure. VIII.4 Bezbaruah Committee (2005) felt that there was merit in formulating a base that would truly reflect the total volume of budgetary transactions. It, therefore, recommended total expenditure (with adjustments) as the base. Subsequent Committees continued to adopt expenditure as the base with certain modifications. VIII.5 The present Committee discussed the merits and challenges of using revenue receipts and adjusted total expenditure as the base for calculating WMA limits. The Committee also studied the trend of state-wise capital expenditure (sum of capital outlay, and loans and advances by the states). The compound annual growth rate (CAGR) of capital expenditure by the states during 2016-17 to 2024-25 exhibited significant volatility across the states. The Committee was of the view that inclusion of capital expenditure in the base could distort allocation of aggregate WMA limits amongst the states. Using total expenditure that may include non-merit and discretionary expenses as the base for fixing WMA limits could encourage the states to go for such expenses. The Committee was clear that the very purpose of WMA arrangement was to address temporary cash-flow mismatches and not to finance regular expenditure. VIII.6 The Committee examined the suitability of using the revenue receipts as a base for determining the WMA limits for states. The revenue receipts of a state is often considered a better indicator of its repayment capacity, especially, during the periods when it is not able to borrow or rollover the existing debt due to adverse market conditions. Furthermore, linking WMA limits to revenue receipts would promote self-regulation by ensuring that liquidity facility to the states from the Reserve Bank remains broadly aligned with the repayment capacity. The Committee also observed that the CAGR of revenue receipts38 across states in recent years has remained relatively stable. Considering all the factors, the Committee recommends use of revenue receipts as the base for arriving at the state-wise WMA limits. Adjustment to the Base VIII.7 While determining the WMA limits, the Committee members were unanimous about the need to minimise inter-state variations in distribution and to ensure fair allocation of aggregate WMA limit across the states. VIII.8 The Committee also examined, if any adjustment in revenue receipts was required. The inclusion of lottery receipts in the revenue base for determining WMA limits warranted careful consideration, particularly for the states for whom such receipts constitute a relatively large share of their non-tax revenues (Chart VIII.1). Such inclusion could provide an unintended incentive to the states with large lottery operations and weaken the link between their WMA limits and the underlying economic base. Inclusion of lottery receipts on a net basis, i.e., after adjusting for the corresponding lottery expenditure, would provide a more appropriate measure of the revenue receipts. Accordingly, the Committee proposes deducting lottery expenditure from the revenue receipts for determining WMA limits. 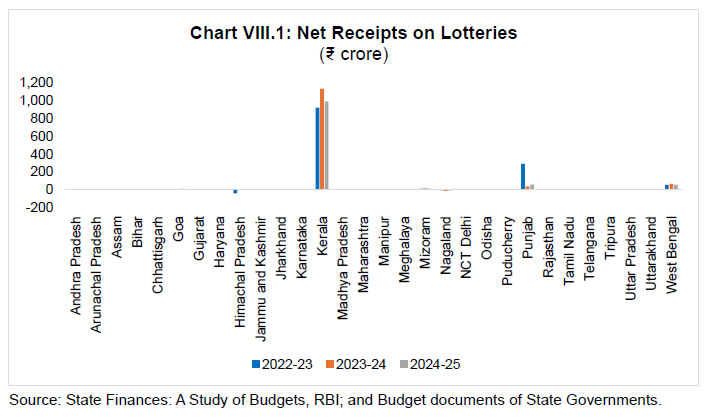 VIII.9 Natural calamities often pose a fiscal challenge for the affected states, such as, the North-Eastern and Hilly (NE&H) states (Chart VIII.2). While expenditure on disaster relief forms part of revenue expenditure and is generally met by corresponding disaster relief receipts, such expenditure may exceed the disaster relief grant received by the affected state, thereby, creating additional short-term cash requirement. The Committee proposes to suitably modify the base for determining WMA limits, by including net expenditure incurred towards natural calamities, if it is positive. WMA Methodology – Fixing of Limits VIII.10 The Committee recommends Revenue Receipts as the base after deducting lottery expenditure and adding net expenditure on natural calamities, if it is positive. VIII.11 For arriving at the revised state-wise WMA limits, average adjusted revenue receipts39 of the individual states for the period 2022-23 to 2024-25 were considered (Annexure 5). To reduce the dispersion in the revised state-wise WMA limits, the Committee also considered it appropriate to have ceilings on maximum and minimum percentage increase from the existing limits. Accordingly, formula-based revised aggregate WMA limit for all the states works out to ₹67,839 crore (Table VIII.2), an increase of 11.2 per cent over the existing limit of ₹61,008 crore. | Table VIII.2: Revision of WMA Limits – State-wise | | (₹ crore) | | Sl. No. | States/ UTs | Existing Limit | Recommended Limit | Increase
(per cent) | | 1 | Andhra Pradesh | 2,921 | 3,197 | 9.4 | | 2 | Arunachal Pradesh | 373 | 423 | 13.5 | | 3 | Assam | 1,716 | 1,889 | 10.1 | | 4 | Bihar | 2,731 | 3,056 | 11.9 | | 5 | Chhattisgarh | 1,434 | 1,628 | 13.5 | | 6 | Goa | 258 | 293 | 13.5 | | 7 | Gujarat | 3,092 | 3,504 | 13.3 | | 8 | Haryana | 1,803 | 2,012 | 11.6 | | 9 | Himachal Pradesh | 777 | 843 | 8.5 | | 10 | Jammu and Kashmir | 1,298 | 1,415 | 9.0 | | 11 | Jharkhand | 1,225 | 1,379 | 12.6 | | 12 | Karnataka | 4,010 | 4,433 | 10.6 | | 13 | Kerala | 2,308 | 2,503 | 8.5 | | 14 | Madhya Pradesh | 3,450 | 3,876 | 12.4 | | 15 | Maharashtra | 6,139 | 6,969 | 13.5 | | 16 | Manipur | 281 | 305 | 8.5 | | 17 | Meghalaya | 267 | 302 | 13.2 | | 18 | Mizoram | 216 | 234 | 8.5 | | 19 | Nagaland | 276 | 300 | 8.7 | | 20 | NCT Delhi | 890 | 971 | 9.1 | | 21 | Odisha | 2,099 | 2,357 | 12.3 | | 22 | Puducherry | 175 | 194 | 10.7 | | 23 | Punjab | 1,538 | 1,674 | 8.8 | | 24 | Rajasthan | 3,585 | 3,970 | 10.7 | | 25 | Tamil Nadu | 4,582 | 5,097 | 11.2 | | 26 | Telangana | 2,407 | 2,733 | 13.5 | | 27 | Tripura | 343 | 387 | 12.8 | | 28 | Uttar Pradesh | 6,519 | 7,199 | 10.4 | | 29 | Uttarakhand | 839 | 927 | 10.5 | | 30 | West Bengal | 3,456 | 3,769 | 9.1 | | | All States/UTs | 61,008 | 67,839 | 11.2 | | Source: RBI. | VIII.12 In the past, the Committee-recommended state-wise WMA limits remained effective till the next review by the subsequent Committee/Group set up by the Reserve Bank, unless there were compelling reasons for a review in between. The Committee is of the view that more frequent revision in WMA limits consistent with change in state’s budget size can be considered. Such revision would capture inflation, changes in budget size and fiscal capacity of the states. The Committee, however, is clear that increase in budget size would not automatically lead to proportionate increase in temporary cash flow mismatches. The Committee has also taken note of states’ growing reliance on SDF as compared to WMA/OD for meeting their temporary mismatches and the extant arrangement for computing SDF limits against CSF/GRF balances which allows the accrued interest to be reckoned as part of the corpus eligible for SDF. The Committee, therefore, recommends that the Reserve Bank may consider undertaking the exercise of yearly revision of state-wise WMA limits based on final accounts data as available for latest three years by using the methodology suggested by this Committee. It may, however, be ensured that the annual increase in WMA limits is capped at four per cent that would make the total financial accommodation available to the states under SDF/WMA to grow by about six per cent annually, even if, there is no fresh contribution to CSF/GRF during the year. At the same time, it may be ensured that the revised limit of any state is not set lower than its existing WMA limit. IX. RECOMMENDATIONS The recommendations of the Committee, grouped under various sub-heads, are briefly summarised hereunder: A. Cash Management IX.2 The liquidity support available from the Reserve Bank is essentially meant to manage cash flows mismatches on a temporary basis and not to finance the budget deficit. States should take advantage of the liquidity support available through SDF/WMA/OD to manage their short-term cash flow mismatches without taking recourse to unplanned market borrowings. At the same time, states may avoid building up high precautionary cash balances. (Paras IV.7-IV.8) IX.3 States may spread out their market borrowings throughout the year and avoid concentration in the fourth quarter of the financial year. (Para IV.8) IX.4 Adoption of BIS for market borrowings can help the states in more effective cash and debt management. Majority of the states have already adopted BIS. Remaining states may also adopt BIS at the earliest. (Para IV.8) B. Ways and Means Advances (WMA) – Fixation of Limits and Annual Revision IX.5 Aggregate state-wise WMA limit may be revised to ₹67,839 crore from the extant limit of ₹61,008 crore. For arriving at the revised WMA limits, the ‘base’ has been taken as adjusted revenue receipts (revenue receipts minus lottery related expenditure plus net expenditure on natural calamities, if it is positive) using accounts level data (2022-23 to 2024-25). (Paras VIII.10-VIII.11) IX.6 The Reserve Bank may consider undertaking annual revision of state-wise WMA limits based on their latest three years’ accounts data, as available, using the methodology suggested by this Committee. Considering the likely enhancement in SDF limits due to increase in outstanding balances of CSF/GRF corpus on account of interest accrued on Government securities held therein, the annual upward revision in WMA may be capped at four per cent. At the same time, it may be ensured that the revised limit of any state is not set lower than its existing WMA limit. (Para VIII.12) C. Review of Overdraft (OD) Facility IX.7 There has been a significant decline in the usage of OD by the states in recent years. Accordingly, the maximum number of consecutive working days a state can remain in OD may be reduced from 14 to 10. Also, the maximum number of working days a state can be in OD in a calendar quarter may be brought down from 36 to 30. (Para V.12) D. Review of Special Drawing Facility (SDF) IX.8 Some of the states are yet to reach the desirable corpus level of five per cent in CSF and GRF, managed by the Reserve Bank on behalf of the states, for meeting any unexpected redemption and payment obligations due to invocation of guarantees. To incentivise the states towards making voluntary contributions in these funds for reaching the desirable level, SDF limit against the investments held in CSF may be increased from the existing 50 per cent to 75 per cent. Also, the relaxations temporarily allowed by the Reserve Bank in January 2026 in respect of SDF against CSF/GRF may be extended beyond end-September 2026. (Para VII.23) IX.9 The concessional liquidity support from the Reserve Bank under SDF may be limited to CSF/GRF balances up to five per cent of state’s outstanding marketable debt/guarantees. In case the corpus of CSF/GRF exceeds five per cent of the state’s outstanding marketable debt/guarantees, it may be allowed to avail liquidity support against the excess CSF/GRF balances at a rate, higher than that is applicable for SDF, which may be decided by the Reserve Bank. (Para VII.22) E. Interest Rate on Various Financial Accommodation Facilities from the Reserve Bank IX.10 The interest rate charged on various financial accommodation facilities (SDF/WMA/OD) provided to the states may be decided by the Reserve Bank, keeping in view the interest of the states and the intended purpose for which CSF/GRF are maintained. (Para V.15) F. Operationalisation of Reserve Funds: CSF/GRF IX.11 Member states should make conscious efforts towards progressively building up the corpus in CSF/GRF to desirable level of at least five per cent of their total outstanding marketable debt/ guarantees. Some of the states, which have not yet become member of CSF/GRF, may join at the earliest. (Para VII.20) IX.12 To provide greater flexibility to the members of CSF/GRF, withdrawal from either of the funds may be permitted for any purpose, including, inter fund transfer, provided that the balance in the source fund does not fall below five per cent post such withdrawal/ transfer. For states, which have not attained the desirable minimum level of five per cent, withdrawal may be permitted from CSF/GRF only for meeting redemption liabilities /guarantees invoked during the year, as per the extant withdrawal guidelines. In view of the changes suggested, the requirement of lock-in period for withdrawal of funds parked in CSF/GRF may be dispensed with. (Paras VII.20 – VII.21) G. Next Review of WMA for State Governments IX.13 As the devolution formula recommended by the Finance Commission can have a significant bearing on the fiscal and liquidity position of the states, the timing of review of WMA scheme may be aligned with the Finance Commission report submission cycle. Accordingly, the next Committee to review the WMA to State Governments may be set up post release of the report of the Seventeenth Finance Commission. (Para V.10)
| Annexure 1: WMA Revision – Recommendations by the Past Committees/Groups | | Normal WMA Facility | | Items | Vithal Committee | Group of SFS | Ramachandran Committee | Bezbaruah Committee | Sumit Bose Committee | Sudhir Shrivastava Committee | Group on Review of WMA | | Computation of State-wise WMA Limits | Average of revenue receipts and capital expenditure of the preceding three years, multiplied by a factor of 2.25 per cent for non-SCS and 2.75 per cent for SCS. | Average of revenue receipts and capital expenditure of the preceding three years multiplied by a factor of 2.4 per cent for non- SCS and 2.9 per cent for SCS. | Average of only revenue receipts of preceding three years, multiplied by a factor of 3.19 per cent for non-SCS and 3.84 per cent for SCS. | Average of total expenditure of the preceding three years, adjusted for ad hoc expenditure and multiplied by a factor of 3.1 per cent for non-SCS and 4.1 per cent for SCS. | Average of total expenditure, excluding lottery expenditure and multiplied by a factor of 2.78 per cent for SCS and 2.03 per cent for non-SCS. | Average of total expenditure excluding ad hoc and volatile expenditure like lottery expenditure, natural calamities, etc. The state-wise WMA limits for SCS and non-SCS were obtained using a multiplying factor of 2 per cent and 1.75 per cent, respectively. | Same as suggested by the Shrivastava Committee, by considering three years accounts data, i.e., 2019-20 to 2021-22. | | Aggregate WMA Limits | ₹3,941 crore | ₹5,283 crore | ₹7,170 crore | ₹9,875 crore | ₹32,225 crore | ₹47,010 crore | ₹60,118 crore40 | | i) Non-Special Category States (Non-SCS) | ₹3,589 crore | ₹4,794 crore | ₹6,445 crore | ₹8,820 crore | ₹28,035 crore | ₹41,992 crore | ₹53,732 crore | | ii) Special Category States (SCS) | ₹352 crore | ₹489 crore | ₹725 crore | ₹1,055 crore | ₹4,190 crore | ₹5,018 crore | ₹6,386 crore | | SDF/ Special WMA Facility | | Items | Vithal Committee | Group of SFS | Ramachandran Committee | Bezbaruah Committee | Sumit Bose Committee | Sudhir Shrivastava Committee | Working Group on CSF/GRF | | Computation of State-wise SDF Limits | SWMA were provided against investment in G-secs. | SWMA were provided against investment in G-secs. | SWMA were provided against investment in G-secs. | Investments in G-Secs plus incremental investment in CSF/GRF subject to a maximum of Normal WMA limit. | SDF limit was linked to the incremental investment in CSF/GRF and ATB holdings. | SDF limit was linked to the incremental investment in CSF/GRF and investment in ATB holdings. | SDF linked was linked to the total size of CSF/GRF corpus41 and investment in ATBs. | | Use of SDF | To be availed after Normal WMA | To be availed after Normal WMA | To be availed before utilising Normal WMA | To be availed before utilising Normal WMA | To be availed before utilising Normal WMA | To be availed before Normal WMA | To be availed before Normal WMA | | Overdraft Facility | | Items | Vithal Committee | Group of SFS | Ramachandran Committee | Bezbaruah Committee | Sumit Bose Committee | Sudhir Shrivastava Committee | Group on Review of WMA | | Maximum Consecutive Working Days | 10 | 12 | 14 | 14 | 14 | 14 | 14 | | Maximum Working Days in a Quarter | - | - | 36 | 36 | 36 | 36 | 36 | | Source: RBI. |
| Annexure 2: Minimum Cash Balance and WMA Limits for States - Historical Trend | | (₹ crore) | | Sl. No. | Effective Date | Minimum Cash Balance (Total for all states) | Normal WMA Limit (In Multiples of Minimum Cash Balance) | Special WMA/SDF Limit (In Multiples of Minimum Cash Balance) | | 1 | April 1, 1938 | 1.95 | 1.95 (1) | + | | 2 | April 1, 1953 | | | 2.00& | | | a) Friday | 3.94 | 7.88 (2) | | | | b) Other Days | 3.38 | | | | | c) Before WMA Repayment | 4.50 | | | | 3 | March 1, 1967 | 6.25 | 18.75 (3) | 37.50 (6) | | 4 | May 1, 1972 | 6.50* | 78.00 (12) | 42.66 (6) | | 5 | May 1, 1976 | 13.00 | 130.00 (10) | 130.00 (10) | | 6 | October 1, 1978 | 13.00 | 260.00 (20) | 130.00 (10) | | 7 | July 1, 1982 | 13.00 | 520.00 (40) | 260.00 (20) | | 8 | October 1986 – March 1987 | 13.00 | 624.00 (48) | 260.00 (20) | | | April – September 1987 | 13.00 | 676.00 (52) | 260.00 (20) | | 9 | March 1, 1988 | 13.30** | 744.80 (56) | 266.00 (20) | | 10 | November 1, 1993 | 13.30 | 1,117.20 (84) | 425.60 (32) | | 11 | August 1, 1996 | 13.30 | 2,234.40 (168) | 851.20 (64) | | 12 | March 1, 1999 | 41.04# | 3,685^ | ++ | | 13 | November, 2000 | 41.04 | 3,941^^ | ++ | | 14 | February 1, 2001 | 41.04 | 5,283^^^ | ++ | | 15 | April 1, 2002 | 41.04 | 6,035^^^^ | ++ | | 16 | March 3, 2003 | 41.04 | 7,170 | ++ | | 17 | April 1, 2005 | 41.04 | 8,935 | ++ | | 18 | April 4, 2006 | 41.04 | 9,875 | +++ | | 19 | December 17, 2007 | 41.19**** | 9,925 | +++ | | 20 | April 1, 2011 | 42.33***** | 10,240 | +++ | | 21 | November 11, 2013 | 42.33 | 15,360 | +++ | | 22 | February 1, 2016 | 42.33 | 32,225 | ++++ | | 23 | April 1, 2020 | 42.33 | 41,893@ | ++++ | | 24 | April 17, 2020 | 42.33 | 51,560@ | ++++ | | 25 | April 01, 2022 | 42.33 | 47,010 | ++++ | | 26 | July 01, 2024 | 42.33 | 60,118 | +++++ | | 27 | January 09, 2026 | 43.25****** | 61,008 | +++++ | | Notes: Figures in brackets in columns 4 and 5 are the total monetary limits for all the states/UTs. | | +: Secured Ways and Means Advances were occasionally granted on an ad-hoc basis. | | &: An additional limit of ₹2.00 crore against the pledge of Central Government Securities was also granted to each state as special or secured advances over and above the clean advances. | | *: The increase of ₹0.25 crore was due to fixation of minimum balance for four states viz. Himachal Pradesh, Manipur, Meghalaya and Tripura. | | **: The increase of ₹0.30 crore was due to the fixation of minimum balance for Goa. | | ^: The aggregate WMA limit of ₹3,685.00 crore was fixed based on the recommendation of IAC (1998). The base for the revised WMA limit was three-year average of revenue receipts plus capital expenditure. | | #: The minimum balance was revised upwards linking it to the same base as for WMA, which was enforced from the date RBI received concurrence from the State Governments. | | ++: The limit for special WMA was made directly proportional to the holdings of Government of India securities with no ceiling. | | ^^: Limits were fixed in November 2000 for six re-organised states. | | ^^^: The aggregate WMA limit of ₹5,283.00 was fixed based on the recommendations of GFSs (2000). | | ^^^^: The normal WMA limits of states were revised, with minimum limit of ₹50 crore for individual state. | | +++: The net incremental annual investment in CSF/GRF were also made eligible for availing Special WMA/SDF, up to a ceiling equivalent to their Normal WMA limit. | | ****: The increase of ₹0.15 crore was due to the fixation of minimum balance for Puducherry. | | *****: The increase of ₹1.14 crore was due to the fixation of minimum balance for Jammu and Kashmir. | | ++++: Net incremental annual investment in CSF/GRF were also made eligible for availing Special WMA/SDF. | | @: Interim measures in response to the fiscal stress caused by the COVID-19 pandemic. | | +++++: The total outstanding balances in CSF/GRF and ATBs considered for determining SDF limits of states/UTs. | | ******: The increase of ₹0.92 crore was due to the fixation of minimum balance for Delhi | | Source: RBI |
| Annexure 3: Interest Rate on WMA, SDF and OD – Historical Trend | | Sl. No | Period | Normal WMA | SDF (Special WMA) | OD | | 1 | Prior to Mar 1967 | 1 per cent below Bank Rate | i) Up to ₹50 lakh: 0.25 per cent below Bank Rate
ii) ₹51 lakh to ₹125 lakh: 0.50 per cent below Bank Rate on the entire amount
iii) Over ₹125 lakh: Bank Rate on the entire amount | Bank Rate | | 2 | Mar 1967 to Apr 1976 | 1 per cent below Bank Rate | 1 per cent below Bank Rate | Bank Rate | | 3 | May 1976 to Aug 1996 | i) First 90 days: 1 per cent below Bank Rate
ii) 91-180 days: 1 per cent above Bank Rate
iii) Beyond 180 days: 2 per cent above Bank Rate | i) First 90 days: 1 per cent below Bank Rate
ii) 91-180 days: 1 per cent above Bank Rate
iii) Beyond 180 days: 2 per cent above Bank Rate | i) First 7 days: Bank Rate
ii) Beyond 7 days: 3 per cent above Bank Rate | | 4 | Aug 1996 to Jan 15, 1998 | Bank Rate | Bank Rate | 3 per cent above Bank Rate | | 5 | Jan 16, 1998 to Mar 18, 1998 | 2 per cent below Bank Rate | 2 per cent below Bank Rate | Bank Rate | | 6 | Mar 19, 1998 to Apr 2, 1998 | 1.5 per cent below Bank Rate | 1.5 per cent below Bank Rate | 0.50 per cent above Bank Rate | | 7 | Apr 3 to Apr 28, 1998 | 1 per cent below Bank Rate | 1 per cent below Bank Rate | 1 per cent above Bank Rate | | 8 | Apr 29, 1998 to Mar 2, 2003 | Bank Rate | Bank Rate | 2 per cent above Bank Rate | | 9 | Mar 3, 2003 to Mar 3, 2006 | i) First 90 days: Bank Rate
ii) Beyond 90 days: 1 per cent above Bank Rate | 1 per cent below Bank Rate | i) OD up to 100 per cent of NWMA: 3 per cent above Bank Rate
ii) OD exceeding 100 per cent of NWMA: 6 per cent above Bank Rate | | 10 | Mar 4, 2006 to May 2018 | i) First 90 days: Repo Rate
ii) Beyond 90 days: 1 per cent above Repo Rate | 1 per cent below Repo Rate | i) OD up to 100% of NWMA: 2% above Repo Rate
ii) OD exceeding 100% of NWMA: 5% above Repo Rate | | 11 | Jun 2018 - Till Date | i) First 90 days: Repo Rate
ii) Beyond 90 days: 1 per cent above Repo Rate | i) SDF against ATBs: 1 per cent below Repo Rate
ii) SDF against CSF/GRF: 2 per cent below Repo Rate | i) OD up to 100 per cent of NWMA: 2 per cent above Repo Rate
ii) OD exceeding 100 per cent of NWMA: 5 per cent above Repo Rate | | Source: RBI |
Annexure 4: Special Assistance to States for Capital Investment: 2026-27 Strategic and sustained capital investment is widely recognised as a cornerstone of inclusive and sustainable economic growth. Considering this, the Central Government launched the ‘Scheme for Special Assistance to States for Capital Expenditure’ in 2020-21 to boost capital expenditure by the states, given its higher multiplier effect and positive influence on the economy’s future productive capacity. In view of the positive response to the Scheme and considering the requests of the states, the Government of India had redesigned and expanded the Scheme in 2022-23 and renamed it as ‘Special Assistance to States for Capital Investment (SASCI)’. Under SASCI, financial assistance is provided to the states in the form of a 50-year interest-free loan for capital investment projects. This loan is over and above the net borrowing ceiling (NBC) allowed to the states. Over the years, SASCI has undergone significant expansion, evolving from a pandemic recovery initiative into a systematic, reform-driven framework for capital expenditure and development. Budgetary allocation under successive SASCI schemes have risen from ₹12,000 crore in 2020–21 to ₹1.5 lakh crore in 2025–26. Since its inception, SASCI has supported and incentivised key initiatives such as PM GatiShakti, digitisation, citizen-centric infrastructure, including, Unity Malls and digital panchayat libraries, industrial policy reforms, and urban planning reforms. SASCI has been revamped for the FY 2026-27, and its budgetary allocation has been further enhanced to ₹2 lakh crore, of which Government has so far earmarked an amount of ₹1.75 lakh crore (Table A1), to be allocated among states based on ‘XII Parameters’. Part-I constitutes the untied component of SASCI loans, allocated in proportion to each state’s share in Central taxes and duties as determined by the Finance Commission. The remaining Parts (II to XII) are tied components, allocations under them are based on specific conditions and criteria. For the first time, Government has introduced a criterion for incentivising “Fiscal Discipline and Fiscal Consolidation” under Part-XI of the SASCI scheme. An amount of ₹3,000 crore is earmarked under this Part, which would be made available to the states on a first-come-first-served basis subject to fulfilment of certain criteria. | Table A1: Various Parts of Scheme for SASCI: 2026-27 | | (₹ crore) | | Parts | Criteria | Amount Earmarked | | Part–I | Untied Funds | 75,000 | | Part-II | State/UT Share of Centrally Sponsored Schemes and Central Projects | 10,000 | | Part-III | Incentives for Achieving Targets for Capital Expenditure | 25,000 | | Part-IV | Strengthening Public Finance IT Infrastructure in States | 4,000 | | Part-V | Mining Sector Reforms | 5,000 | | Part-VI | Implementation of the Right of Way Rules, 2024 under the Telecommunications Act, 2023 | 4,000 | | Part-VII | Digital Public Infrastructure for Agriculture – AgriStack | 13,000 | | Part-VIII | Livestock Sector Reforms | 3,000 | | Part-IX | Incentives to States for Efficiency in Financial Management | 5,000 | | Part-X | Pride of Hills: Special Development Assistance for the Hill States under SASCI | 25,000 | | Part-XI | Fiscal Discipline and Fiscal Consolidation | 3,000 | | Part-XII | Compressed Bio-Gas (CBG) Sector Reforms | 3,000 | | Total | | 1,75,000 | | Source: Government of India. | The objective of Part-XI is to encourage the states to maintain fiscal discipline, promote sound debt management and prudent borrowing practices, strengthen fiscal risk management, and enhance transparency in fiscal reporting. Under this Part, states are expected to adopt or adhere to the following: adoption of a BIS, conduct of switches/buybacks, preparation of a Medium-Term Debt Management Strategy (MTDS), adherence to their indicative borrowing calendar, reduction of market borrowings in the fourth quarter, and transparency in fiscal reporting to be eligible to receive funds. To qualify for incentives under this Part, a state must obtain a minimum of 60 per cent of the prescribed marks under the evaluation framework. Amount of incentive will be proportionate to the marks scored.
| Annexure 5: Revenue Receipts Based Revised WMA Limits | | (₹ crore) | | States/ UTs | Revenue Receipts | Expenditure on Lotteries | Net Expenditure on Natural Calamities | Average Base | Revised WMA | | 2022-23 | 2023-24 | 2024-25 | 2022-23 | 2023-24 | 2024-25 | 2022-23 | 2023-24 | 2024-25 | | | | | (i) | (ii) | (iii) | (iv) | (v) | (vi) | (vii) | (viii) | (ix) | (x) | (xi) | | Andhra Pradesh | 1,57,768 | 1,73,767 | 1,67,676 | 0 | 0 | 0 | 321 | 339 | 1,400 | 1,67,090 | 3,197 | | Arunachal Pradesh | 23,788 | 27,441 | 30,307 | 0 | 0 | 2 | -32 | 274 | 84 | 27,298 | 423 | | Assam | 89,742 | 91,534 | 96,908 | 0 | 0 | 0 | 864 | -419 | 679 | 93,242 | 1,889 | | Bihar | 1,72,688 | 1,93,347 | 2,18,658 | 0 | 0 | 0 | 750 | 1,610 | 1,698 | 1,96,250 | 3,056 | | Chhattisgarh | 93,877 | 1,03,508 | 1,20,290 | 0 | 0 | 0 | 131 | 428 | 311 | 1,06,182 | 1,628 | | Goa | 17,284 | 18,272 | 20,191 | 1 | 2 | 1 | 14 | 4 | 5 | 18,588 | 293 | | Gujarat | 1,99,408 | 2,22,763 | 2,18,554 | 0 | 0 | 0 | 998 | 607 | 348 | 2,14,226 | 3,504 | | Haryana | 89,195 | 1,01,315 | 1,06,429 | 0 | 0 | 0 | 269 | 333 | 630 | 99,390 | 2,012 | | Himachal Pradesh | 38,090 | 39,173 | 40,872 | 38 | 0 | 0 | 343 | 923 | 333 | 39,899 | 843 | | Jammu and Kashmir | 68,976 | 70,108 | 74,401 | 0 | 0 | 0 | 311 | 311 | 311 | 71,472 | 1,415 | | Jharkhand | 80,245 | 87,929 | 94,489 | 0 | 0 | 0 | -1 | 536 | 492 | 87,897 | 1,379 | | Karnataka | 2,29,080 | 2,33,343 | 2,58,153 | 0 | 0 | 0 | 2,351 | 534 | 3,841 | 2,42,434 | 4,433 | | Kerala | 1,32,725 | 1,24,486 | 1,24,861 | 10,972 | 11,401 | 11,722 | 108 | 254 | 189 | 1,16,176 | 2,503 | | Madhya Pradesh | 2,03,986 | 2,34,026 | 2,50,498 | 0 | 0 | 0 | 345 | 1,099 | 1,118 | 2,30,358 | 3,876 | | Maharashtra | 4,05,678 | 4,30,596 | 4,81,906 | 49 | 46 | 51 | 4,599 | 4,534 | 5,290 | 4,44,152 | 6,969 | | Manipur | 15,893 | 14,706 | 16,776 | 0 | 0 | 0 | -31 | -14 | 47 | 15,807 | 305 | | Meghalaya | 14,820 | 17,978 | 17,154 | 1 | 1 | 1 | 21 | 7 | 13 | 16,663 | 302 | | Mizoram | 10,282 | 11,414 | 11,064 | 2 | 3 | 3 | -16 | -54 | 46 | 10,933 | 234 | | Nagaland | 14,099 | 16,155 | 16,087 | 3 | 12 | 4 | 114 | 36 | 194 | 15,555 | 300 | | NCT Delhi | 62,703 | 56,798 | 62,233 | 0 | 0 | 0 | 372 | 159 | 1 | 60,755 | 971 | | Odisha | 1,50,462 | 1,79,593 | 1,83,963 | 0 | 0 | 0 | 504 | 1,453 | 1,141 | 1,72,372 | 2,357 | | Puducherry | 9,635 | 10,042 | 10,517 | 0 | 0 | 0 | -2 | 7 | 212 | 10,138 | 194 | | Punjab | 87,616 | 89,192 | 93,207 | 98 | 75 | 120 | 45 | 647 | 350 | 90,255 | 1,674 | | Rajasthan | 1,94,988 | 2,03,276 | 2,27,250 | 0 | 0 | 0 | 574 | 1,077 | 1,736 | 2,09,634 | 3,970 | | Tamil Nadu | 2,43,749 | 2,64,597 | 2,82,829 | 0 | 0 | 0 | 947 | 1,278 | 780 | 2,64,727 | 5,097 | | Telangana | 1,59,350 | 1,69,293 | 1,67,804 | 0 | 0 | 0 | 63 | 195 | 282 | 1,65,662 | 2,733 | | Tripura | 18,309 | 20,538 | 21,104 | 0 | 0 | 0 | 23 | 23 | 194 | 20,064 | 387 | | Uttar Pradesh | 4,17,242 | 4,65,801 | 5,10,213 | 0 | 0 | 0 | 519 | 810 | 1,483 | 4,65,356 | 7,199 | | Uttarakhand | 49,083 | 50,615 | 51,473 | 0 | 0 | 0 | 263 | 543 | 607 | 50,861 | 927 | | West Bengal | 1,95,544 | 2,00,268 | 2,13,700 | 0 | 0 | 0 | 433 | 735 | 905 | 2,03,861 | 3,769 | Notes: Average Base (2022-23 to 2024-25) = Average of Adjusted Revenue Receipts 2022-23, 2023-24 and 2024-25
For example, Adjusted Revenue Receipts of 2022-23 = (i) – (iv) + (vii), provided (vii) > 0; else, (i)-(iv)
Source: CAG (2026); and RBI (2026). |
Select References CAG (2026). State Finances 2024-25: Decadal Analysis. Comptroller and Auditor General of India, June. Finance Commission of India (1989). Second Report of the Ninth Finance Commission. Reserve Bank of India (1999). Report of the Informal Advisory Committee on Ways and Means Advances to State Governments (Chairman: Vithal, B P R). Reserve Bank of India, March. Reserve Bank of India (2003). Report of the Advisory Committee on Ways and Means Advances to State Governments (Chairman: Ramachandran, C). Reserve Bank of India, March. Reserve Bank of India (2006). Report of the Advisory Committee on Ways and Means Advances to State Governments (Chairman: Bezbaruah, M P). Reserve Bank of India, April. Reserve Bank of India (2016). Report of the Advisory Committee on Ways and Means Advances to State Governments (Chairman: Sumit Bose). Reserve Bank of India, January. Reserve Bank of India (2021). Report of the Advisory Committee on Ways and Means Advances to State Governments (Chairman: Sudhir Shrivastava). Reserve Bank of India, May. Saxena, S. (2017). How to Strengthen the Management of Government Guarantees, IMF. Ulgenturk, L. (2017). The role of public debt managers in contingent liability management. OECD Working Papers on Sovereign Borrowing and Public Debt Management No. 8.
|