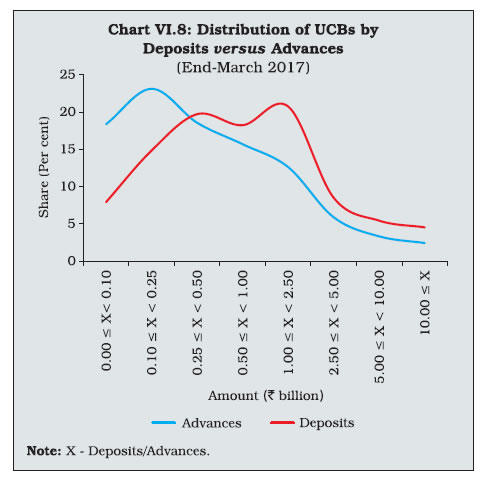
Co-operatives, which have often been plagued by fragile financial health, on the whole, portrayed a sanguine picture in the financial results of the latest year. Following on-going consolidation efforts, urban co-operative banks exhibited expansion in balance sheet size and recorded improved profitability. Developments in the rural co-operative sector ensured a turnaround in the performance of the apex-level long-term rural credit co-operatives while the short-term rural credit co-operatives continued to exhibit improved performance. I. Introduction VI.1 Credit co-operatives, comprising of urban co-operative banks (UCBs) and rural co-operative credit institutions, were formed as exclusive institutions to meet specific developmental objectives embodied in the extension of formal financial services to villages and small towns in India. Their geographic and demographic outreach plays a pivotal role in credit delivery and inclusiveness in the financial system. Yet their share is relatively small in the bank-dominated Indian financial system. At the end of March 2016, the assets of rural and urban co-operatives taken together were 10.6 per cent of the total assets held by SCBs.1 There were 1,562 UCBs and 94,384 rural co-operatives, including short-term and long-term co-operatives, at end-March 2017 (Chart VI.1). Rural co-operatives accounted for a predominant share in the assets of the co-operative sector (Chart VI.2). 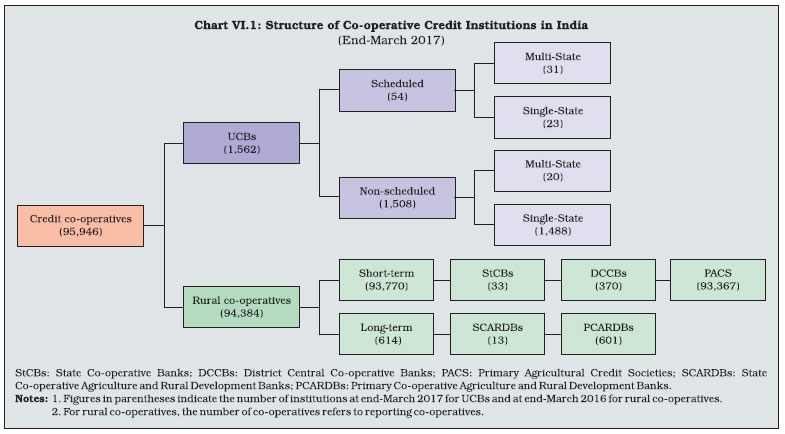 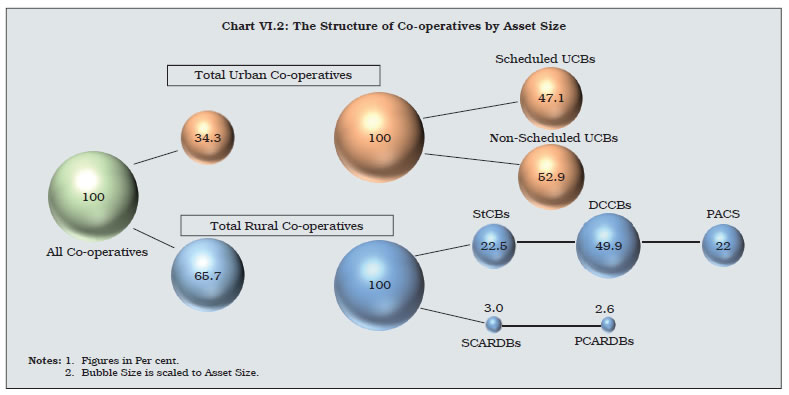 VI.2 Co-operatives have been hamstrung by fragile financial health stemming from operational and governance-related issues2. Remedial measures have been implemented from time to time, shaping the emergence of a consolidated and resilient urban co-operative banking sector. However, in the case of rural co-operatives and particularly long-term institutions, financial debilities persist. VI.3 Against this backdrop, this chapter analyses the performance of co-operatives in 2016-17. The rest of the chapter is organised into four sections. Section II reviews the performance of UCBs, based on financial and soundness indicators. Section III assesses the short-term and long-term rural co-operative credit structure. Section IV provides a comparative assessment of short-term and long-term rural co-operative credit institutions. Section V gives an overall assessment. II. Urban Co-operative Banks VI.4 In pursuance of the recommendations of the Marathe Committee (1992), the Reserve Bank followed an active licensing policy for UCBs to allow them to tap area-specific deposit mobilisation and credit absorption potential. As a result, the period 1993-2004 witnessed a proliferation in the number of UCBs. Their poor financial health prompted the Reserve Bank to conceive a Vision Document in 2005, which envisaged a multi-layered regulatory and supervisory strategy aimed at shoring up their viability. The ensuing mergers/ amalgamations/exits led to a reduction in the number of UCBs (Chart VI.3). Beginning with 2004-05, the UCB sector has undergone 128 mergers till March 2017 with Maharashtra accounting for the maximum number of them, followed by Gujarat and Andhra Pradesh (Chart VI.4). 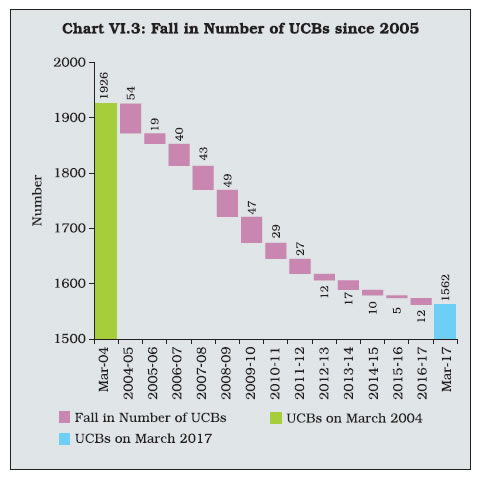 VI.5 Notwithstanding the sharp fall in the number of UCBs, there was a massive expansion in their balance sheets underscoring the effectiveness of the consolidation drive. In recent years though, UCBs’ growth in assets has decelerated to close to its long run average (Chart VI.5). VI.6 The success of the consolidation drive of the UCBs is visible in other parameters as well. The share of Tier II UCBs3 – both in number and assets – has increased rapidly over time (Chart VI.6 and Table VI.1). VI.7 Along with consolidation, a significant development has been the movement in the mode of distribution of total deposits of the UCBs to larger size buckets. This is indicative of the expansion and diversification of their customer base (Table VI.2 and Chart VI.7). VI.8 In 2016-17, the shift in the distribution of advances towards larger buckets was less discernible than the shift in the distribution of deposits (Chart VI.8).
Table VI.1: Tier-wise Distribution of Urban Co-operative Banks
(End-March 2017) | | (Amount in ₹ billion) | | Tier Type | Number of Banks | Deposits | Advances | Assets | | Number | % to Total | Amount | % to Total | Amount | % to Total | Amount | % to Total | | 1 | 2 | 3 | 4 | 5 | 6 | 7 | 8 | 9 | | Tier I UCBs | 1,083 | 69.3 | 603.3 | 13.6 | 317.8 | 12.2 | 745.0 | 13.8 | | Tier II UCBs | 479 | 30.7 | 3,831.4 | 86.4 | 2,294.4 | 87.8 | 4,654.1 | 86.2 | | All UCBs | 1,562 | 100.0 | 4,434.7 | 100.0 | 2,612.2 | 100.0 | 5,399.1 | 100.0 | | Note: Data are provisional. |
Table VI.2: Distribution of UCBs by Deposits and Advances
(End-March 2017) | Deposits
(₹ billion) | Number of UCBs | Amount of Deposits | Advances
(₹ billion) | Number of UCBs | Amount of Advances | | Number | % Share | Amount | % Share | Number | % Share | Amount | % Share | | 1 | 2 | 3 | 4 | 5 | 6 | 7 | 8 | 9 | 10 | | 0.0 - 0.10 | 124 | 7.9 | 7.5 | 0.2 | 0.00 - 0.10 | 287 | 18.4 | 16.1 | 0.6 | | 0.10 - 0.25 | 232 | 14.9 | 41.7 | 0.9 | 0.10 - 0.25 | 361 | 23.1 | 62.0 | 2.4 | | 0.25 - 0.50 | 308 | 19.7 | 118.4 | 2.7 | 0.25 - 0.50 | 290 | 18.6 | 105.3 | 4.0 | | 0.50 - 1.00 | 285 | 18.2 | 210.2 | 4.7 | 0.50 - 1.00 | 245 | 15.7 | 181.3 | 6.9 | | 1.00 - 2.50 | 324 | 20.7 | 537.7 | 12.1 | 1.00 - 2.50 | 197 | 12.6 | 315.4 | 12.1 | | 2.50 - 5.00 | 133 | 8.5 | 506.8 | 11.4 | 2.50 - 5.00 | 92 | 5.9 | 331.0 | 12.7 | | 5.00 - 10.00 | 85 | 5.4 | 627.5 | 14.1 | 5.00 - 10.00 | 52 | 3.3 | 363.4 | 13.9 | | 10.00 and above | 71 | 4.5 | 2,385.0 | 53.8 | 10.00 and above | 38 | 2.4 | 1,237.8 | 47.4 | | Total | 1,562 | 100.0 | 4,434.7 | 100.0 | Total | 1,562 | 100.0 | 2,612.3 | 100.0 | Notes: 1. Data are provisional.
2. Components may not add up to the total due to rounding off. |
 VI.9 The UCB sector has also witnessed a high degree of asset concentration. The bi-modality of the asset-class distribution in 2014-15 has transformed into a unimodal pattern in a higher size asset class. The share of UCBs with an asset size of more than ₹10 billion increased from 4.6 per cent in 2014-15 to 6.2 per cent in 2016-17 (Chart VI.9). The number of scheduled UCBs increased from 50 in 2014-15 to 54 in 2016-17, although the increase in the asset share of scheduled UCBs (SUCBs) moderated in 2016-17 (Chart VI.10).4 Balance Sheet VI.10 Balance sheet of UCBs expanded in 2016- 17 on account of an increased growth in net worth (capital plus reserves) and deposits on the liability side. An increase in investments and other assets also contributed to balance sheet expansion. Loans and advances of UCBs witnessed muted growth reflecting subdued demand conditions in the economy, which manifested into, among other things, a slowdown in the growth of the small-ticket retail loans and the housing loans segments, which the urban-focused UCBs mainly cater to (Table VI.3). 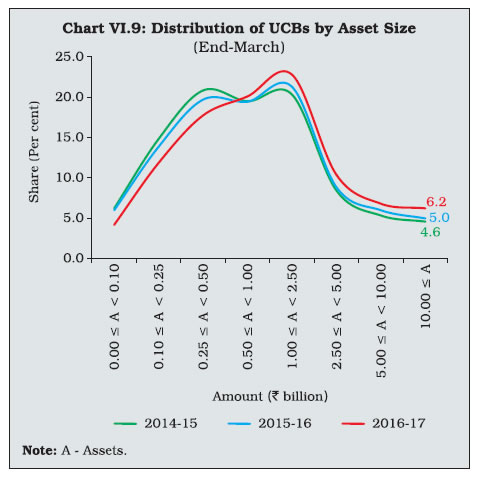 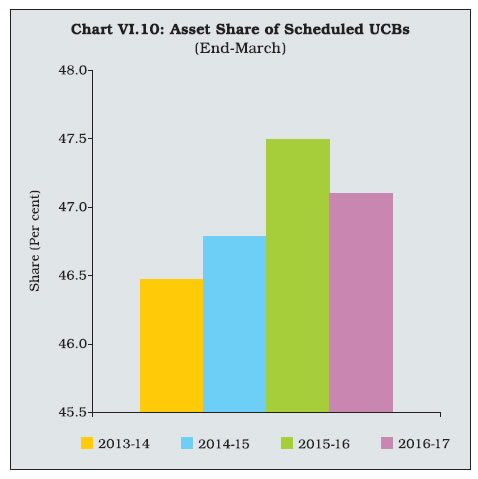
Table VI.3: Liabilities and Assets of Urban Co-operative Banks
(End-March) | | (Amount in ₹ billion) | | Assets/Liabilities | Scheduled UCBs | Non-Scheduled UCBs | All UCBs | Rate of Growth (%) (All UCBs) | | 2016 | 2017 | 2016 | 2017 | 2016 | 2017 | 2015-16 | 2016-17 | | 1 | 2 | 3 | 4 | 5 | 6 | 7 | 8 | 9 | | Liabilities | | | | | | | | | | 1. Capital | 36 | 40 | 74 | 82 | 110 | 122 | 10.6 | 10.5 | | | (1.6) | (1.6) | (3.0) | (2.9) | (2.3) | (2.3) | | | | 2. Reserves | 142 | 158 | 154 | 177 | 296 | 335 | 8.1 | 13.3 | | | (6.3) | (6.2) | (6.1) | (6.2) | (6.2) | (6.2) | | | | 3. Deposits | 1,844 | 2,073 | 2,078 | 2,362 | 3,922 | 4,435 | 10.4 | 13.1 | | | (81.1) | (81.5) | (82.6) | (82.7) | (81.9) | (82.1) | | | | 4. Borrowings | 24 | 31 | 2 | 3 | 26 | 34 | 16.5 | 29.8 | | | (1.1) | (1.2) | (0.1) | (0.1) | (0.5) | (0.6) | | | | 5. Other Liabilities | 228 | 242 | 209 | 232 | 437 | 474 | 7.8 | 8.5 | | | (10.0) | (9.5) | (8.3) | (8.1) | (9.1) | (8.8) | | | | Assets | | | | | | | | | | 1. Cash in Hand | 12 | 15 | 30 | 30 | 42 | 45 | 12.1 | 6.0 | | | (0.5) | (0.6) | (1.2) | (1.0) | (0.9) | (0.8) | | | | 2. Balances with RBI | 87 | 99 | 15 | 15 | 102 | 115 | 4.5 | 12.8 | | | (3.8) | (3.9) | (0.6) | (0.5) | (2.1) | (2.1) | | | | 3. Money at Call and Short Notice | 18 | 39 | 14 | 12 | 33 | 51 | 56.0 | 55.1 | | | (0.8) | (1.5) | (0.6) | (0.4) | (0.7) | (0.9) | | | | 4. Investments | 585 | 662 | 624 | 759 | 1,209 | 1,420 | 63.9 | 17.5 | | | (25.7) | (26.0) | (24.8) | (26.6) | (25.3) | (26.3) | | | | 5. Loans and Advances | 1,187 | 1,292 | 1,262 | 1,320 | 2,449 | 2,612 | 9.2 | 6.7 | | | (52.2) | (50.8) | (50.2) | (46.2) | (51.2) | (48.4) | | | | 6. Other Assets | 235 | 259 | 159 | 290 | 394 | 549 | 8.0 | 39.5 | | | (10.3) | (10.2) | (6.3) | (10.1) | (8.2) | (10.2) | | | | Total Liabilities/Assets | 2,274 | 2,543 | 2,514 | 2,856 | 4,788 | 5,399 | 10.0 | 12.8 | | | (100) | (100) | (100) | (100) | (100) | (100) | | | Notes: 1. Data for 2017 are provisional.
2. Figures in parentheses are percentages to total liabilities / assets.
3. Components may not add up to the total due to rounding off.
4. Y-o-y variations could be slightly different because absolute numbers have been rounded off to ₹1 billion in the table. | VI.11 Historically, investments have been the preferred use of funds among UCBs resulting in low credit-to-deposit ratios. During 2016-17, however, incremental credit-to-deposit ratio of UCBs was higher than that of SCBs (Chart VI.11). The investment-to-deposit ratio of UCBs had dipped below that of the SCBs for the first time in 2015-16 as balances with central/state co-operative banks ceased to be reckoned as SLR investments from April 1, 2015. The wedge between the investment-to-deposit ratio of SCBs and UCBs narrowed down in 2016-17 (Chart VI.12). VI.12 There was a turnaround in the growth of UCBs’ SLR investments, which had declined a year ago and also there was an accelerated pace of growth in non-SLR investments in 2016-17 (Chart VI.13 and Table VI.4). VI.13 The increase in SLR investments, despite easing regulatory requirements, reflected a sharp hike in investment in Central and State Government securities.5 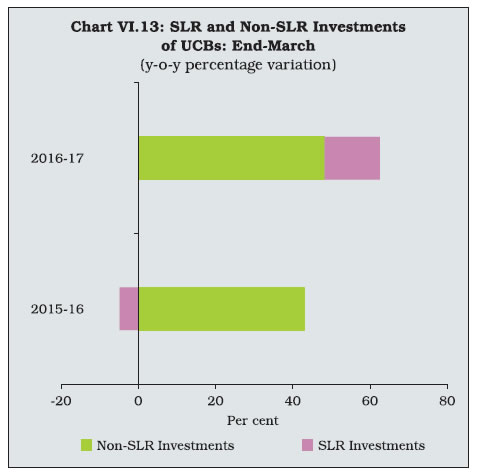
| Table VI.4: Investments by Urban Co-operative Banks | | (Amount in ₹ billion) | | Item | End-March | Variation (%) | | 2015 | 2016 | 2017 | 2015-16 | 2016-17 | | 1 | 2 | 3 | 4 | 5 | 6 | | Total Investments (A + B) | 1,231 | 1,209 | 1,420 | -1.8 | 17.5 | | | (100.0) | (100.0) | (100.0) | | | | A. SLR Investments (i to iv) | 1,152 | 1,096 | 1,253 | -4.8 | 14.3 | | | (93.6) | (90.7) | (88.2) | | | | (i) Central Government Securities | 792 | 878 | 954 | 11.0 | 8.7 | | | (68.7) | (80.1) | (76.2) | | | | (ii) State Government Securities | 175 | 215 | 293 | 22.9 | 36.7 | | | (15.2) | (19.6) | (23.4) | | | | (iii) Other Approved Securities | 4 | 3 | 5 | -20.4 | 61.5 | | | (0.4) | (0.3) | (0.4) | | | | (iv) Balances with Central / State Co-operative Banks | 181 | | | | | | | (15.7) | | | | | | B. Non-SLR Investments | 79 | 113 | 167 | 43.0 | 48.2 | | | (6.4) | (9.3) | (11.8) | | | Notes: 1. Data for 2017 are provisional.
2. Figures in parentheses are share in respective type of investments.
3. Components may not add up to the total due to rounding off.
4. The reckoning of the balances with Central / State Co-operative Banks has been discontinued for SLR since April 1, 2015.
5. Y-o-y variations could be slightly different because absolute numbers have been rounded off to ₹1 billion in the table. |
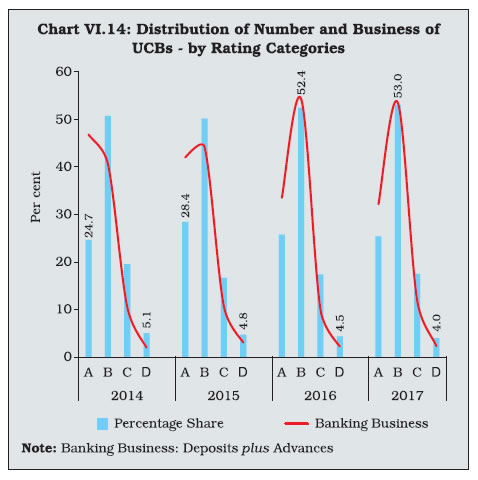 Soundness VI.14 The financial strength of an UCB is adjudged by the CAMELS rating assigned to it.6 The share of UCBs in the lowest CAMELS rating category ‘D’ has consistently come down since 2013-14. The distribution of UCBs in rating categories other than ‘D’ did not show any perceptible change between March 2016 and March 2017 (Chart VI.14 and Table VI.5). Table VI.5: Rating-wise Distribution of UCBs
(End-March 2017) | | (Amount in ₹ billion) | | Ratings | Number | Deposits | Advances | | Banks | % Share in Total | Amount | % Share in Total | Amount | % Share in Total | | 1 | 2 | 3 | 4 | 5 | 6 | 7 | | A | 397 | 25.4 | 1,443 | 32.5 | 824 | 31.6 | | B | 828 | 53.0 | 2,356 | 53.1 | 1,411 | 54.0 | | C | 274 | 17.6 | 528 | 12.0 | 319 | 12.1 | | D | 63 | 4.0 | 108 | 2.4 | 59 | 2.3 | | Total | 1,562 | 100.0 | 4,435 | 100.0 | 2,613 | 100.0 | Notes: 1. Data are provisional.
2. Components may not add up to the total due to rounding off.
3. Ratings are based on the inspections conducted during the financial years 2015-16 and 2016-17. | Capital Adequacy VI.15 Capital is a critical criterion for determining the business model of the UCBs given their permissible activities. It is also an important parameter in the CAMELS rating. Against the statutory minimum requirement of CRAR for UCBs at 9 per cent, 82 per cent of the non-scheduled UCBs maintained CRAR above 12 per cent in 2016-17 (Table VI.6). VI.16 Non-scheduled UCBs (NSUCBs) that are characterised by a smaller business size, have had stronger capital positions than scheduled UCBs (SUCBs). In 2016-17, SUCBs’ capital position exhibited remarkable improvement as reflected in the increase in the share of SUCBs with CRAR above 9 per cent (Chart VI.15). While 90 per cent of the SUCBs met the minimum CRAR stipulation, four registered negative capital adequacy ratios in 2016-17. The growth in net worth (capital plus reserves) of non-scheduled UCBs led to higher growth in assets in 2016-17 (Chart VI.16). Asset Quality VI.17 Since 2015-16, the NPA ratio of the UCBs has fallen below that of SCBs (Chart VI.17). The reason for this divergence could be that large infrastructure and industrial projects that have traditionally been catered to by SCBs were afflicted by impairments unlike the retail and small business segment which the UCBs cater to. Table VI.6: CRAR-wise Distribution of UCBs
(End-March 2017) | | CRAR (in Per cent) | Scheduled UCBs | Non-scheduled UCBs | All UCBs | | 1 | 2 | 3 | 4 | | CRAR < 3 | 4 | 110 | 114 | | 3 <= CRAR < 6 | 0 | 9 | 9 | | 6 <= CRAR < 9 | 1 | 8 | 9 | | 9 <= CRAR < 12 | 4 | 150 | 154 | | 12 <= CRAR | 45 | 1,231 | 1,276 | | Total | 54 | 1,508 | 1,562 | | Note: Data are provisional. |
VI.18 The provision coverage ratio (PCR) for UCBs declined during the year. The movement of gross non-performing assets (GNPAs) and PCR in recent years reflects a lagged response by the UCBs in building up buffers against the increase in non-performing assets (Chart VI.18). VI.19 This suggests that the increase in the GNPA ratio in 2016-17 may require higher provisioning in the future (Table VI.7). VI.20 Higher provisioning is also expected in view of the worsening of the solvency position of UCBs – measured in terms of the proportion of non-performing assets covered by total capital plus reserves on the banks’ balance sheets (Chart VI.19).
Table VI.7: Non-Performing Assets of UCBs
(End-March) | | (Amount in ₹ billion) | | Item | 2016 | 2017 | | 1 | 2 | 3 | | 1. Gross NPAs | 150 | 186 | | 2. Net NPAs | 51 | 68 | | 3. Gross NPA Ratio (%) | 6.1 | 7.1 | | 4. Net NPA Ratio (%) | 2.2 | 2.7 | | 5. Provisioning (1-2) | 99 | 118 | | 6. Provisioning Coverage Ratio (Per cent) (5/1) | 65.9 | 63.5 | | Note: Data for 2017 are provisional. | Financial Performance and Profitability VI.21 UCBs recorded accelerated growth in net profits in 2016-17, reflecting growth in both interest and non-interest incomes. While the slowdown in loans and advances led to some deceleration in interest income, non-interest income increased sharply due to the diversification by UCBs into a host of fee-earning activities to compensate for the slack in lending activity (Table VI.8). 
| Table VI.8: Financial Performance of Scheduled and Non-scheduled Urban Co-operative Banks | | (Amount in ₹ billion) | | Item | Scheduled UCBs | Non-scheduled UCBs | All UCBs | Variation (%) | | 2015-16 | 2016-17 | 2015-16 | 2016-17 | 2015-16 | 2016-17 | 2015-16 | 2016-17 | | 1 | 2 | 3 | 4 | 5 | 7 | 8 | 9 | 10 | | A. Total Income [i+ii] | 212 | 231 | 266 | 294 | 478 | 525 | 8.7 | 9.8 | | | (100.0) | (100.0) | (100.0) | (100.0) | (100.0) | (100.0) | | | | i. Interest Income | 192 | 202 | 253 | 273 | 445 | 475 | 9.4 | 6.9 | | | (90.7) | (87.6) | (94.8) | (92.8) | (93.0) | (90.5) | | | | ii. Non-interest Income | 20 | 29 | 14 | 21 | 34 | 50 | -0.2 | 48.6 | | | (9.3) | (12.4) | (5.2) | (7.2) | (7.0) | (9.5) | | | | B. Total Expenditure [i+ii] | 182 | 194 | 229 | 253 | 412 | 447 | 9.8 | 8.6 | | | (100.0) | (100.0) | (100.0) | (100.0) | (100.0) | (100.0) | | | | i. Interest Expenditure | 137 | 143 | 172 | 190 | 309 | 333 | 9.4 | 7.8 | | | (75.0) | (73.8) | (75.2) | (75.0) | (75.1) | (74.5) | | | | ii. Non-interest Expenditure | 46 | 51 | 57 | 63 | 103 | 114 | 11.0 | 9.9 | | | (25.0) | (26.2) | (24.8) | (25.0) | (24.9) | (25.5) | | | | of which: Staff Expenses | 22 | 24 | 31 | 34 | 53 | 58 | 8.0 | 9.9 | | C. Profits | | | | | | | | | | i. Amount of Operating Profits | 29 | 37 | 37 | 42 | 67 | 78 | 2.3 | 17.0 | | ii. Provision, Contingencies | 9 | 14 | 8 | 11 | 17 | 25 | 1.2 | 49.5 | | iii. Provision for Taxes | 6 | 6 | 7 | 7 | 13 | 14 | -2.4 | 3.7 | | iv. Amount of Net Profit before Taxes | 20 | 22 | 30 | 31 | 50 | 53 | 2.7 | 6.0 | | v. Amount of Net Profit after Taxes | 14 | 16 | 23 | 24 | 37 | 39 | 4.6 | 6.8 | Notes: 1. Figures in parentheses are share in total income/expenditure.
2. Y-o-y variations could be slightly different because absolute numbers have been rounded off to ₹1 billion in the table.
3. Components may not add up to the total due to rounding off.
4. Data for 2016-17 are provisional. |
 VI.22 During 2016-17, the share of non-interest income in total income showed a pronounced increase for UCBs, signifying a shift from traditional intermediation and a diversification of their income structure to offset declining interest margins (Chart VI.20). A shift towards activities generating non-interest income entails higher capital buffers due to higher volatility of non-interest income. VI.23 An analysis of SUCBs shows that the diversification of UCBs, as reflected in a higher share of non-interest income in total income was not complemented by the maintenance of higher capital buffers (Chart VI.21).7 VI.24 Both return on assets (RoA) and return on equity (RoE) of UCBs moderated in 2016-17 (Chart VI.22). But within the UCBs, the profitability indicators of the scheduled UCBs improved vis-à-vis that of the non-scheduled UCBs (Chart VI.23). VI.25 Scheduled UCBs not only registered marginally higher profitability in 2016-17 but also showed an improvement in efficiency as their net interest margins (NIMs) decreased, indicating a decline in the cost of financial intermediation. Profitability indicators of non-scheduled UCBs remained higher but more variable than those of scheduled UCBs (Table VI.9).
| Table VI.9: Select Indicators of Profitability of UCBs | | (per cent) | | Indicators | Scheduled UCBs | Non-scheduled UCBs | All UCBs | | 2015-16 | 2016-17 | 2015-16 | 2016-17 | 2015-16 | 2016-17 | | 1 | 2 | 3 | 4 | 5 | 6 | 7 | | Return on Assets | 0.64 | 0.65 | 0.95 | 0.88 | 0.80 | 0.77 | | Return on Equity | 8.13 | 8.29 | 10.43 | 9.70 | 9.42 | 9.09 | | Net Interest Margin | 2.57 | 2.43 | 3.33 | 3.11 | 2.97 | 2.79 | | Note: Data for 2016-17 are provisional. | VI.26 At a disaggregated level, profitability indicators for the scheduled and non-scheduled UCBs have showed different movements. A Du Pont analysis of the drivers of profitability of these two UCB groups during different phases of consolidation and reforms points to differences in efficient utilisation of assets and prudent cost management (Box VI.1). Box VI.1: What Drives the Profitability of Scheduled and Non-scheduled UCBs?: A Du Pont Analysis A multi-layered strategy outlined in the Vision Document of 2005 for the revival of UCBs has been pursued actively. This has borne results in the form of the emergence of a strong and viable urban co-operative banking sector with improved financials. An analysis of this phase of revival of UCBs divulges several interesting features. Consolidation in the sector through mergers and amalgamations and exit of unviable entities formed the fulcrum of this strategy till 2009-10. Since 2012-13, the focus has shifted to making the UCBs operationally more efficient. Two phases of consolidation, 2006-09 – (the early phase) and 2012-17 – (the late phase), can thus be identified. The profitability indicators during these two phases reflect improvement in the financial performance of the UCB sector over time (Charts 1.A and 1.B).  A Du Pont analysis decomposes the drivers of profitability between efficiency and increased leverage. The profitability metric of return on equity (RoE) is a composite of the return on assets (RoA) (also a qualifier of financial performance) and an indicator of the debt-equity composition in the banks’ funding structure – leverage ratio or the equity multiplier. RoA, in turn, is the sum total of the quality of asset utilisation and cost management by the banks. These two form the basis of the Du Pont identity. 
 The first and the second terms in decomposition 2 stand for effective asset utilisation and cost management, respectively. To understand the individual contribution of each of the components of RoE, the product form in decomposition 1 is log transformed into a sum of its components and the growth rates of the components are compared with the growth rate of the whole to complete the analysis. A similar analysis is carried out for the second decomposition but without the log transformation. If higher RoE is driven by substitution of equity capital with lower cost long-term debt, then it is an indication of a buildup of stress in the future. For instance, between 2013 and 2015, NSUCBs experienced growth in their profitability where an increase in RoE was driven by a build-up in the leverage even though RoA fell (Chart 1.C). During this phase, there was an excessive proliferation of assets driven by borrowed rather than internal funds. In 2016-17, leverage played a much larger role than RoA in improving the RoE of the SUCBs. While asset growth of SUCBs has remained at the average level, growth in borrowings has doubled (refer to Table VI.3). Despite the facilities given for raising capital from the market, the SUCBs seem to have substituted costlier equity with cheaper debt.8 Leverage for NSUCBs too increased in 2016- 17 though by a much lower rate, but the high growth in assets could not yield high returns (Chart 1.D).
In 2016-17, the increased return on assets of the SUCBs came about because of better cost management due to increased emphasis on adopting technologies like the core banking solution (CBS) instead of better asset utilisation. In 2016-17, NSUCBs suffered from poor asset utilisation (Chart 1.E). To sum up, the increase in profitability of SUCBs during the early phase of consolidation was due to higher income from their assets alone while during the latter phase, their increase in profitability stemmed from better cost management as the expansion in assets from a higher leverage could not yield enough returns. The profitability of NSUCBs, on the other hand, has been beleaguered by poor asset utilisation irrespective of the phase of consolidation. | Priority Sector Advances VI.27 Priority sector lending must constitute at least 40 per cent of the adjusted net bank credit (ANBC) of UCBs.9 Given their urban focus, unlike SCBs, UCBs do not have a mandate for agricultural lending. Credit to micro and small enterprises, housing, micro-credit and the ‘others’ components form a major part of their priority sector advances (Table VI.10). 10,11 Table VI.10: Composition of Credit to Priority Sectors by UCBs
(End-March 2017) | | (Amount in ₹ billion) | | Item | Priority Sector Advances | | Amount | Share in Total Advances (%) | | 1 | 2 | 3 | | 1. Agriculture Credit | 76 | 3.0 | | 1.1 Direct Agricultural Credit | 32 | 1.2 | | 1.2 Indirect Agricultural Credit | 44 | 1.7 | | 2. Micro and Small Enterprises | 732 | 28.0 | | 2.1 Direct Credit to Small and Micro Enterprises | 576 | 22.1 | | 2.2 Indirect Credit to Small and Micro Enterprises | 156 | 6.0 | | 3. Micro Credit | 108 | 4.1 | | 4. State-Sponsored Organisations for SCs / STs | 2 | 0.1 | | 5. Education Loans | 22 | 0.8 | | 6. Housing Loans | 253 | 9.7 | | 7. Total (1 to 6) | 1192 | 45.6 | | of which, Advances to Weaker Sections | 271 | 10.4 | Notes: 1. Data for 2017 are provisional.
2. Percentages are with respect to total credit of UCBs.
3. Components may not add up to total due to rounding off. | VI.28 Historically, lending to the priority sector by UCBs has been higher than by PSBs, but in 2016-17, UCBs recorded a dip in the share of priority sector advances in total advances. Within the priority sectors, credit to micro and small enterprises, micro-credit and agriculture increased while lending to other sectors dropped sharply (Chart VI.24). VI.29 Given the mandate for UCBs to advance a part of their priority sector corpus towards the weaker sections such that it forms at least 10 percent of their ANBC12, on an average, 26 per cent of their priority sector lending has been typically allocated to the weaker sections. This share declined in 2016-17 (Chart VI.25). VI.30 Since April 2016, “financially sound” UCBs13 with priority sector loan portfolio not less than 90 per cent of their gross loans have been allowed to grant unsecured advances to the extent of 35 per cent of their total assets (beyond the extant ceiling of 10 per cent of total assets as per audited balance sheets as on March 31 of the previous financial year) to provide further impetus to financial inclusion. The condition is that the entire unsecured loan portfolio in excess of the normally permitted 10 per cent comprises of priority sector loans and the exposure to any individual borrower does not exceed ₹40,000. VI.31 To sum up, the ongoing consolidation efforts were reflected in various performance indicators of UCBs during the year. Growing deposits and higher investments led to a robust increase in the balance sheet size of UCBs. In tandem, UCBs exhibited better performance in terms of profitability, partly due to the diversification strategies facilitated by improving capital positions. But their asset quality witnessed some deterioration partly due to temporary problems in repayments faced by small borrowers following the immediate impact of demonetisation. III. Rural Co-operatives14 VI.32 Rural co-operative credit institutions in India consist of two distinct sets – short-term and long-term institutions – each with specific objectives. Short-term co-operatives primarily provide short-term15 crop loans and working capital loans to farmers and rural artisans, while long-term co-operatives typically provide medium to long-term loans for making investments in agriculture, including land development, farm mechanisation and minor irrigations; rural industries; and lately, housing. A profile of rural co-operatives is presented in Table VI.11. VI.33 The share of rural co-operatives in total institutional credit to agriculture fell from 64 per cent in 1992-93 to 17 per cent in 2015-16. In consonance, the share of credit from long-term rural credit co-operatives in agricultural gross capital formation, also declined (Table VI.12). VI.34 To improve the functioning and performance of short-term rural co-operative structure, the Reserve Bank and the NABARD have taken several measures based on the recommendations of various expert committees over the last decade17. These measures largely addressed the deficiencies in the short-term credit structure. Table VI.11: A Profile of Rural Co-operatives
(As at end-March 2016) | | (Amount in ₹ billion) | | Item | Short-term | Long-term | | StCBs | DCCBs | PACS | SCARDBs | PCARDBs | | 1 | 2 | 3 | 4 | 5 | 6 | | A. Number of Co-operatives | 33# | 370 | 93367 | 13 | 601 | | B. Balance Sheet Indicators | | | | | | | i Owned Funds (Capital + Reserves) | 151 | 340 | 244 | 50 | 36 | | ii. Deposits | 1,093 | 2,982 | 1,011 | 24 | 14 | | iii. Borrowings | 688 | 836 | 1,127 | 146 | 143 | | iv. Loans and Advances | 1,229 | 2,427 | 1,808 | 204 | 127 | | v. Total Liabilities/Assets | 2,067 | 4,582 | 2,013* | 275 | 241 | | C. Financial Performance | | | | | | | i. Institutions in Profit | | | | | | | a. Number | 28 | 319 | 45,241 | 9 | 306 | | b. Amount of Profit | 7 | 17 | 41 | 0.98 | 0.18 | | ii. Institutions in Loss | | | | | | | a. Number | 5 | 51 | 36,695 | 4 | 295 | | b. Amount of Loss | 1 | 6 | 65 | 0.95 | 3.63 | | iii. Overall Profits (+)/ Loss (-) | 6 | 11 | -24 | 0.03 | -3.45 | | D. Non-performing Assets | | | | | | | i. Amount | 56 | 227 | 299** | 34 | 47 | | ii. Share in Loans Outstanding (Per cent) | 4.5 | 9.3 | 18.9 | 16.6 | 37.0 | | E. Recovery of Loans to Demand Ratio*** (Per cent) | 91.7 | 79.6 | 82.4 | 63.6 | 51.5 | Notes: StCBs: State Co-operative Banks; DCCBs: District Central Co-operative Banks; PACS: Primary Agriculture Credit Societies; SCARDBs: State Co-operative Agriculture and Rural Development Banks; PCARDBs: Primary Co-operative Agriculture and Rural Development Banks.
#: Consequent to the bifurcation of the state of Andhra Pradesh under the Andhra Pradesh Reorganisation Act, 2014, the Andhra Pradesh State Co-operative Bank was bifurcated into the Andhra Pradesh State Co-operative Bank and the Telangana State Co-operative Apex Bank.
*: Working Capital; **: Total Overdues; ***: This ratio captures the share of outstanding non-performing loan amounts that have been recovered.
Source: NABARD and NAFSCOB.16 |
| Table VI.12: Share in Credit Flow – Rural Co-operatives | | (Figures in Per cent) | | | Share in Credit Flow to Agriculture | Share of Credit from Long-Term Rural Credit Co-operatives in Agricultural Gross Capital Formation | | Co-operative Banks | Regional Rural Banks | | 2012-13 | 18.0 | 11.0 | 12.5 | | 2013-14 | 17.0 | 12.0 | 12.0 | | 2014-15 | 17.0 | 12.0 | 13.0 | | 2015-16 | 17.0 | 13.0 | 12.6 | | Source: NABARD. | VI.35 Short-term co-operative credit institutions continue to occupy a significant position in institutional credit flows to agriculture and remain a potent instrument for furthering the financial inclusion agenda, even after the advent and spread of commercial and regional rural banks.18 As of March 2016, short-term co-operatives had between themselves a branch network of 108,776 branches as against 110,361 branches of PSBs, local area banks (LABs) and regional rural banks (RRBs) taken together.19 VI.36 A number of measures aimed at the revival of these short-term credit institutions has resulted in an improvement in their financial health over time. At the end of March 2016, short-term credit co-operatives comprising StCBs, DCCBs and PACS, accounted for 94.4 per cent of the total assets of the rural co-operative credit structure, up from 92.8 per cent at end-March 2015.20 At the same time, their numbers also increased with the increase in the number of PACS across regions. VI.37 These short-term credit co-operatives need to play a much larger role in fulfilling the requirements of agricultural credit. Nonetheless, their overall profitability turned negative in 2015-16, driven down by increased loss incurred by PACS. However, over time, the performance of short-term co-operatives has improved, on the whole, which could be attributed, inter alia, to mandatory licensing, prescription of minimum capital requirements in a phased manner, consolidation, increasing adoption of technology and efforts to improve governance.21 VI.38 Recommendations for reforming the long-term co-operative credit structure remain to be implemented and its share in total assets of all rural co-operatives has been dwindling steadily (Chart VI.26). VI.39 The number of long-term institutions – SCARDBs and PCARDBs – continued to decline as well (Chart VI.27). Low outreach, limited range of credit products and resource constraints had adverse implications on the performance of these institutions. Moreover, the inherent deficiencies associated with their design – non-resource based specialised term-lending institutions – severely restrict their ability to fulfil their role adequately. Short-term Rural Credit Co-operatives VI.40 Short-term rural credit co-operatives operate in most of the states in a three-tier structure with StCBs at the apex level and DCCBs as its principal members, DCCBs as the intermediate structure with PACS as principal affiliated members, and PACS at the base (village) level with farmers as their members. In principle, PACS are expected to mobilise deposits from farmer members and use them for providing crop loans to members. When deposits are not enough to meet the loan requirements of borrowing members, PACS draw support from higher tier institutions, DCCBs/StCBs. DCCBs were constituted as small banks in small towns to mobilise deposits from the public and support the credit needs of PACS and their members. State Co-operative Banks VI.41 StCBs, the apex institutions in the short-term rural co-operative structure, mobilise deposits and thus provide the required liquidity and technical assistance/ guidance to both DCCBs and PACS to help them fulfill their obligations towards their farmer members. StCBs are also expected to mobilise liquidity and refinance support from higher refinancing institutions like the NABARD for supporting the crop loan needs of affiliated DCCBs and PACS. With refinance support from NABARD, over time, StCBs have diversified their operations towards providing medium-term loans for investments in agriculture and for the rural sector, in general. Balance Sheet Operations VI.42 The balance sheet of the StCBs, the apex institutions in the short-term co-operative credit structure, expanded moderately in 2015-16. On the liabilities side, deposits turned around from a contraction in 2014-1522 and on the assets side, loans and advances grew at a lower rate due to two consecutive years of poor agricultural growth. Agricultural loans account for more than 60 per cent of their loan portfolios (Table VI.13). VI.43 Information on scheduled StCBs (17 out of the 33 total StCBs) available from Section 42(2) returns for 2016-17 suggests that their deposit growth could be even higher. Notwithstanding the liberalisation of norms for co-operative banks which allow them access to non-SLR instruments, StCBs’ SLR investments increased faster in 2016-17 than in the preceding year (Table VI.14). | Table VI.13: Liabilities and Assets of State Co-operative Banks | | (Amount in ₹ billion) | | Item | As at end-March | Variation (%) | | 2015 | 2016 | 2014-15 | 2015-16 | | 1 | 2 | 3 | 4 | 5 | | Liabilities | | | | | | 1. Capital | 54 | 56 | 45.1 | 5.0 | | | (2.7) | (2.73) | | | | 2. Reserves | 88 | 94 | -5.2 | 7.1 | | | (4.4) | (4.6) | | | | 3. Deposits | 1,028 | 1,093 | -1.5 | 6.3 | | | (51.7) | (52.9) | | | | 4. Borrowings | 687 | 688 | 12.7 | 0.1 | | | (34.6) | (33.3) | | | | 5. Other Liabilities | 131 | 136 | 9.1 | 3.5 | | | (6.6) | (6.58) | | | | Assets | | | | | | 1. Cash and Bank Balances | 66 | 64 | -50.6 | -3.8 | | | (3.3) | (3.1) | | | | 2. Investments | 699 | 690 | 5.1 | -1.2 | | | (35.2) | (33.4) | | | | 3. Loans and Advances | 1,145 | 1,229 | 11.1 | 7.3 | | | (57.6) | (59.4) | | | | 4. Other Assets | 78 | 85 | 5.0 | 8.5 | | | (3.9) | (4.1) | | | | Total Liabilities/Assets | 1,989 | 2,067 | 4.4 | 4.0 | | | (100) | (100) | | | Notes: 1. Figures in parentheses are percentages to total liabilities/ assets.
2. Y-o-y variations could be slightly different because absolute numbers have been rounded off to ₹1 billion in the table.
3. Components may not add up to the total due to rounding off.
Source: NABARD. | Profitability VI.44 StCBs’ net profits declined by 44.5 per cent in 2015-16 on account of higher growth in expenditure relative to income. Although the interest component of expenditure moderated with a reduction in interest rate on refinance from 7.85 per cent to 6.20 per cent following two successive rounds of revision, a sharp increase in provisions and contingencies pushed up non-interest expenditure sharply. Slower growth in credit, coupled with a decline in investments, resulted in muted growth in interest income that forms almost 95 per cent of the total income of StCBs (Table VI.15). | Table VI.14: Select Banking Indicators of Scheduled State Co-operative Banks | | (Amount in ₹ billion. Growth Rates in Per cent) | | Item | 2013-14 | 2014-15 | 2015-16 | 2016-17 | | 1 | 2 | 3 | 4 | 5 | | Deposits | 777 | 772 | 796 | 903 | | | (8.7) | (-0.6) | (3.0) | (13.5) | | Credit | 939 | 1038 | 1074 | 1109 | | | (10.0) | (10.6) | (3.4) | (3.3) | | SLR Investments | 240 | 233 | 242 | 262 | | | (7.0) | (-3.1) | (4.0) | (8.3) | | Credit plus SLR Investments | 1179 | 1271 | 1316 | 1371 | | | (9.4) | (7.8) | (3.5) | (4.2) | Note: Figures in brackets are growth rates in per cent over previous year.
Source: Form B under Section 42 of RBI Act. |
| Table VI.15: Financial Performance of State Co-operative Banks | | (Amount in ₹ billion) | | Item | As during | Variation (%) | | 2014-15 | 2015-16 | 2014-15 | 2015-16 | | A. Income ( i+ii) | 149 | 153 | 5.6 | 2.6 | | | (100.0) | (100.0) | | | | i. Interest Income | 143 | 145 | 6.3 | 1.6 | | | (95.9) | (95) | | | | ii. Other Income | 6 | 8 | -6.9 | 27 | | | (4.1) | (5.0) | | | | B. Expenditure (i+ii+iii) | 139 | 147 | 4.1 | 6.3 | | | (100.0) | (100.0) | | | | i. Interest Expended | 116 | 119 | 5.4 | 3 | | | (83.4) | (80.8) | | | | ii. Provisions and Contingencies | 7 | 12 | -19.9 | 61.8 | | | (5.2) | (8.0) | | | | iii. Operating Expenses | 16 | 16 | 9.3 | 4.8 | | | (11.3) | (11.2) | | | | of which : Wage Bill | 10 | 11 | 1.5 | 11.6 | | | (6.9) | (7.3) | | | | C. Profits | | | | | | i. Operating Profits | 18 | 18 | 4 | -1.8 | | ii. Net Profits | 11 | 6 | 29.9 | -44.5 | Notes: 1. Figures in parentheses are proportion to total income/ expenditure in per cent.
2. Y-o-y variations could be slightly different because absolute numbers have been rounded off to ₹1 billion in the table.
3. Components may not add up to the total due to rounding off.
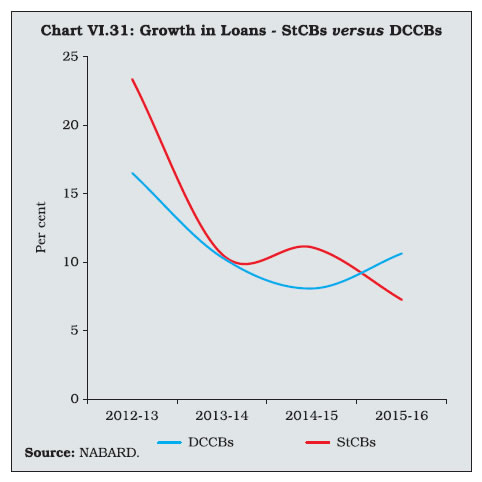
Source: NABARD. | Asset Quality VI.45 During 2015-16, the NABARD’s increased focus on monitoring of accumulated losses and NPA management of the StCBs led to a reduction in NPAs of StCBs both in absolute terms and as a proportion of loans and advances (Table VI.16 and Chart VI.28). | Table VI.16: Soundness Indicators of State Co-operative Banks | | (Amount in ₹ billion) | | Item | As at end-March | Variation (%) | | 2015 | 2016 | 2014-15 | 2015-16 | | 1 | 2 | 3 | 4 | 5 | | A. Total NPAs (i+ii+iii) | 57 | 56 | 0.4 | -2.8 | | i. Sub-standard | 21 | 19 | 0.5 | -9.1 | | | (36.3) | (33.9) | | | | ii. Doubtful | 25 | 25 | -5.4 | 0.9 | | | (43.2) | (44.9) | | | | iii. Loss | 12 | 12 | 15.0 | 0.6 | | | (20.5) | (21.2) | | | | B. NPAs to Total Loans Ratio (%) | 5.0 | 4.5 | - | - | | C. Recovery to Demand Ratio (%) | 94.9 | 91.7 | - | - | Notes: 1. Figures in parentheses are shares in total NPAs (%).
2. Y-o-y variations could be slightly different because absolute numbers have been rounded off to ₹1 billion in the table.
3. Components may not add up to the total due to rounding off.
Source: NABARD. | VI.46 The eligibility of the StCBs for drawing refinance from the NABARD and for deciding on the quantum of refinance, has for some time now, been linked to various financial parameters. Net NPAs is one of them. This has perhaps nudged these institutions to make improvements in their asset quality. VI.47 The improvement in the NPA ratio has been steadily occurring over the recent years with the central region being the only aberration. In the northern, central, western and southern regions, the recovery ratio has remained more or less stable at a higher level. On the other hand, in the eastern region, it has remained volatile ranging between 90 and 55 per cent in the last four years despite an improvement in the asset quality. Recoveries have increased in the north-eastern region. (Chart VI.29). VI.48 There has always been a disparity in the financial health of the StCBs across different regions. Over time, however, the difference between the highest and the lowest NPA ratios across regions has decreased (Chart VI.30). VI.49 At end-March 2016, NPAs still ranged between 13.1 per cent in the north-eastern region to 1.7 per cent in the northern region (Table VI.17). District Central Co-operative Banks VI.50 The DCCBs form the second tier of the three-tiered short-term rural co-operative structure. The resource base of DCCBs comprised of deposits (65.1 per cent) and borrowings (18.2 per cent) as at end-March 2016. Out of total borrowings, 98 per cent were in the form of loans from StCBs and the NABARD. Consequently, the growth in loans and advances of the DCCBs move closely with that of the StCBs (Chart VI.31). Even with higher credit disbursal than StCBs in absolute terms, DCCBs typically had a lower credit-to-deposit ratio than StCBs due to a broadening of their deposit base. (Chart VI.32). Balance Sheet Operations VI.51 During 2015-16, the balance sheet of the DCCBs expanded at a higher rate than in the preceding year. Accelerated growth in deposits, capital and reserves on the liability side was matched by an increase in investments and accelerated increase in growth of loans and advances on the asset side (Table VI.18). DCCBs typically hold a high share of their medium-term loan portfolio in the form of non-agricultural loans. Consequently, their credit expansion was not impacted by the slowdown in the agricultural sector during 2014-15 and 2015-16 as much as it was in the case of StCBs. Stable fixed deposits form a large proportion of the sources of funds of DCCBs, reflecting efforts aimed at mobilising resources through deposits to meet higher credit demand. | Table VI.17: Regional Disparity in Financial Health of StCBs | | | Highest NPA Ratio | Lowest NPA Ratio | Range | | 2012-13 | 23.2 | 2.1 | 21.1 | | 2013-14 | 17.1 | 1.9 | 15.2 | | 2014-15 | 14.5 | 1.8 | 12.7 | | 2015-16 | 13.1 | 1.7 | 11.4 | | Source: NABARD. |
| Table VI.18: Liabilities and Assets of District Central Co-operative Banks | | (Amount in ₹ billion) | | Item | As at end-March | Variation (%) | | 2015 | 2016 | 2014-15 | 2015-16 | | 1 | 2 | 3 | 4 | 5 | | Liabilities | | | | | | 1. Capital | 131 | 165 | 14.2 | 25.6 | | | (3.2) | (3.6) | | | | 2. Reserves | 163 | 175 | 2.3 | 7.9 | | | (4.0) | (3.8) | | | | 3. Deposits | 2,588 | 2,982 | 9.3 | 15.2 | | | (63.5) | (65.1) | | | | 4. Borrowings | 800 | 836 | 10.1 | 4.5 | | | (19.6) | (18.2) | | | | 5. Other Liabilities | 395 | 424 | 8.2 | 7.3 | | | (9.7) | (9.3) | | | | Assets | | | | | | 1. Cash and Bank Balances | 220 | 233 | 9.5 | 5.7 | | | (5.4) | (5.1) | | | | 2. Investments | 1,385 | 1,615 | -33.3 | 16.7 | | | (34.0) | (35.3) | | | | 3. Loans and Advances | 2,194 | 2,427 | 8.1 | 10.6 | | | (53.8) | (53.0) | | | | 4. Other Assets | 278 | 307 | 9.3 | 10.5 | | | (6.8) | (6.7) | | | | Total Liabilities/Assets | 4,077 | 4,582 | 9.2 | 12.4 | | | (100.0) | (100.0) | | | Notes: 1. Figures in parentheses are percentages to total liabilities/ assets.
2. Y-o-y variations could be slightly different because absolute numbers have been rounded off to ₹1 billion in the table.
3. Components may not add up to the total due to rounding off.
Source: NABARD. | Profitability VI.52 The net profits of DCCBs increased sharply in 2015-16 as against a decline during 2014-15. This improvement could be attributed to a lower growth in expenditure on account of an absolute fall in the level of provisions and contingencies as well as to a lower growth in interest and operating expenses, despite higher wage bill. On the income side, as with the StCBs, other income recorded higher growth, while interest income decelerated (Table VI.19). | Table VI.19: Financial Performance of District Central Co-operative Banks | | (Amount in ₹ billion) | | Item | As during | Variation (%) | | 2014-15 | 2015-16 | 2014-15 | 2015-16 | | 1 | 2 | 3 | 4 | 5 | | A. Income (i+ii) | 338 | 367 | 9.3 | 8.4 | | | (100.0) | (100.0) | | | | i. Interest Income | 323 | 347 | 9.5 | 7.7 | | | (95.4) | (94.8) | | | | ii. Other Income | 16 | 19 | 4.0 | 23.2 | | | (4.6) | (5.2) | | | | B. Expenditure (i+ii+iii) | 331 | 355 | 12.2 | 7.3 | | | (100.0) | (100.0) | | | | i. Interest Expended | 230 | 250 | 11.8 | 8.8 | | | (69.4) | (70.4) | | | | ii. Provisions and Contingencies | 30 | 29 | 26.8 | -4.0 | | | (9.1) | (8.1) | | | | iii. Operating Expenses | 71 | 76 | 7.4 | 6.9 | | | (21.5) | (21.5) | | | | of which : Wage Bill | 43 | 48 | 4.6 | 10.7 | | | (13.1) | (13.5) | | | | C. Profits | | | | | | i. Operating Profits | 37 | 40 | -1.4 | 8.4 | | ii. Net Profits | 7 | 11 | -49.9 | 62.5 | Notes: 1. Figures in parentheses are percentages to total income/ expenditure.
2. Y-o-y variations could be slightly different because absolute numbers have been rounded off to ₹1 billion in the table.
3. Components may not add up to the total due to rounding off.
Source: NABARD. | Asset Quality VI.53 The asset quality of DCCBs improved marginally during 2015-16 as reflected in the decline in their NPA ratios, despite an accumulation of assets in the sub-standard and doubtful categories (Table VI.20). VI.54 Post a dip in 2014-15, the recovery-to-demand ratio improved during 2015-16, although it remained significantly lower than that of StCBs (Chart VI.33). VI.55 Weak performance of a lower tier institution can eventually pose risks to the apex institutions. Reforms in the rural co-operative sector have focused on all tiers of the co-operative structure. In short-term credit institutions, the focus has been on improving the asset quality of both the StCBs and DCCBs. However, since the DCCBs are directly affected by geographical and seasonal risks associated with agricultural yields, they have persistently shown higher NPAs and lower recovery to demand ratios than StCBs (Chart VI.34). Operating expenses on staff and other heads also elevated the share of operating expenses in the total expenditure of DCCBs as compared to the StCBs due to their large district-level set-up and lagged adoption of technology (Chart VI.35).23 Moreover, StCBs have more assured sources of liquidity than DCCBs.24 | Table VI.20: Soundness Indicators of District Central Co-operative Banks | | (Amount in ₹ billion) | | Item | As at end-March | Variation (%) | | 2015 | 2016 | 2014-15 | 2015-16 | | 1 | 2 | 3 | 4 | 5 | | A. Total NPAs (i+ii+iii) | 208 | 227 | -0.5 | 9.0 | | i. Sub-standard | 93 | 95 | -7.0 | 1.6 | | | (44.8) | (41.7) | | | | ii. Doubtful | 91 | 109 | 4.8 | 19.6 | | | (43.8) | (48.1) | | | | iii. Loss | 24 | 23 | 8.3 | -2.2 | | | (11.4) | (10.2) | | | | B. NPAs to Loans Ratio (%) | 9.5 | 9.3 | - | - | | C. Recovery to Demand Ratio (%) | 77.3 | 79.6 | - | - | Notes: 1. Figures in parentheses are percentages to total NPAs.
2. Y-o-y variations could be slightly different because absolute numbers have been rounded off to ₹1 billion in the table.
3. Components may not add up to the total due to rounding off.
Source: NABARD. |
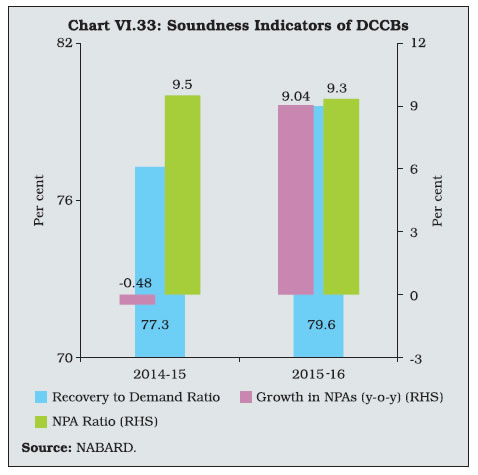 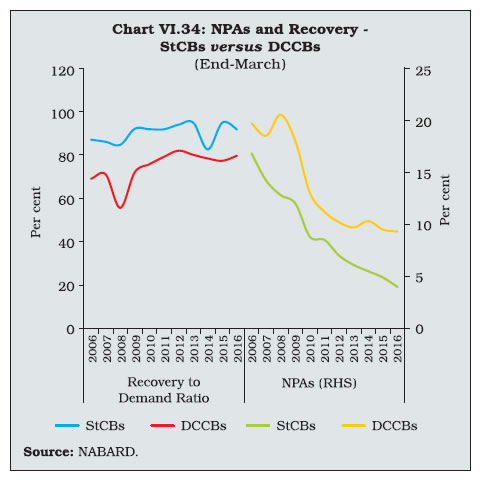 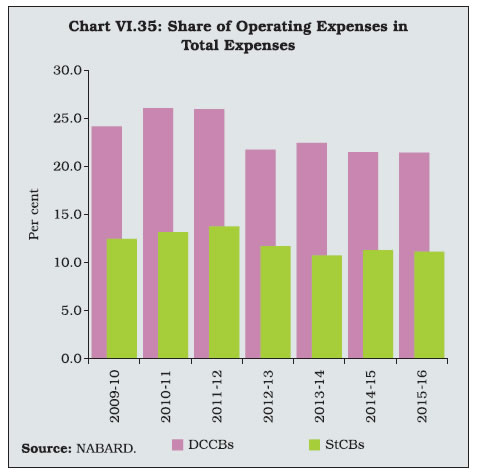  VI.56 The overall recovery-to-demand ratio at an all-India level improved for DCCBs during 2015-16, mainly due to a turnaround in recovery in the southern region coupled with a steady increase in the western region. District-level performance of the co-operatives in both northern and western regions deteriorated and their NPA ratios increased in 2015-16 (Chart VI.36). VI.57 Nonetheless, regional disparity has diminished over the period (Chart VI.37 and Table VI.21). | Table VI.21: Regional Disparity in Financial Health of DCCBs | | (Per cent) | | | Highest NPA Ratio | Lowest NPA Ratio | Range | | 2013 | 17.8 | 5.7 | 12.1 | | 2014 | 12.7 | 5.3 | 7.4 | | 2015 | 14.3 | 5.2 | 9.1 | | 2016 | 12.9 | 5.6 | 7.3 | | Source: NABARD. |
Primary Agricultural Credit Societies (PACS) VI.58 PACS form the grass-root level tier of the short-term co-operative credit structure that directly interfaces with individual borrowers to provide them short and medium-term credit. Reflecting co-operative culture, PACS advances loans only to their members.25 Borrowings from higher tier co-operative credit institutions constitute the majority of funds for the PACS, which cater to a variety of other associated activities. They arrange for the supply of agricultural inputs, distribution of consumer articles and marketing of produce for their members through co-operative marketing societies. Balance Sheet Operations VI.59 PACS witnessed a slowdown in credit growth in 2015-16 in relation to the preceding year (Table VI.22 and Chart VI.38). PACS largely cater to agricultural borrowers. Subdued demand conditions due to muted growth in the agricultural sector resulted in their low credit growth. | Table VI.22: Primary Agricultural Credit Societies – Select Balance Sheet Indicators | | (Amount in ₹ billion) | | Item | As at end-March | Variation (%) | | 2015 | 2016 | 2014-15 | 2015-16 | | 1 | 2 | 3 | 4 | 5 | | A. Liabilities | | | | | | 1. Total Resources (2+3+4) | 2,063 | 2,382 | 4.9 | 15.5 | | 2. Owned Funds (a+b) | 217 | 244 | 14.7 | 12.8 | | a. Paid-up Capital | 111 | 123 | 12.9 | 11.0 | | Of which, | | | | | | Government Contribution | 8 | 8 | 19.1 | -4.3 | | b. Total Reserves | 106 | 122 | 16.5 | 14.7 | | 3. Deposits | 846 | 1,011 | 3.3 | 19.4 | | 4. Borrowings | 1,000 | 1,127 | 4.4 | 12.7 | | 5. Working Capital | 2,237 | 2,013 | 5.3 | -10.0 | | B. Assets | | | | | | 1. Total Loans Outstanding (a+b) | 1,472 | 1,585 | 13.2 | 7.7 | | a) Short-Term | 1,036 | 1,171 | 7.3 | 13.0 | | b) Medium-Term | 437 | 414 | 30.0 | -5.1 | Note: Y-o-y variations could be slightly different because absolute numbers have been rounded off to ₹1 billion in the table.
Source: NAFSCOB. | VI.60 Among the three short-term rural credit institutions, PACS are the most dependent on borrowed resources and own funds (capital and reserves) while DCCBs rely primarily on stable deposits as their chief funding source (Chart VI.39). This, in turn, reflects on their performance. Credit Deployment VI.61 PACS extend credit only to their members. Therefore, a useful indicator for both access to and demand for credit from PACS is the borrower-to-member ratio. This ratio has generally remained below 50 per cent, suggesting that less than half the members of PACS access credit from the institutions themselves. Marginal farmers, followed by small farmers, form the majority of PACS’ members and their shares in membership increased during 2015-16, while that of the scheduled castes / scheduled tribes and the rural artisans group declined (Chart VI.40). The borrower to member ratio fell across all categories, resulting in an overall decline in the borrower-member ratio (Chart VI.41). VI.62 An analysis of the extent of shortfall of the access to credit from an aspired level of 50 per cent reveals that the shortfall in credit off-take during 2015-16 was the highest for rural artisans and small and marginal farmers (Chart VI.42). Hence, despite the increase in the membership share of the major groups, overall credit growth slowed down for PACS in 2015-16. VI.63 Notwithstanding the fact that the main objective of PACS is the delivery of agricultural credit, their share of non-agricultural loans has increased consistently at the cost of agricultural loans since 2010. The share of agricultural loans has, however, stabilised in the recent period and disbursal of short-term loans, that form a core function of PACS, has picked up (Chart VI.43). 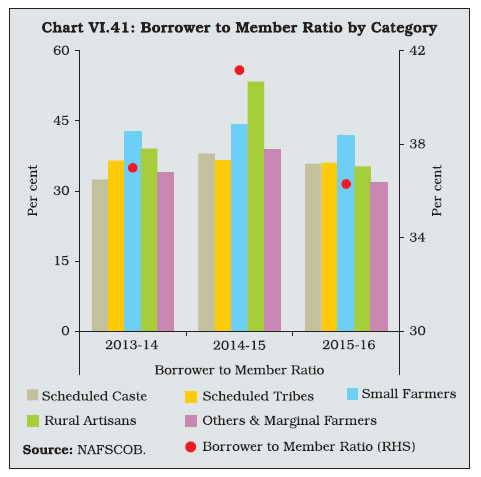 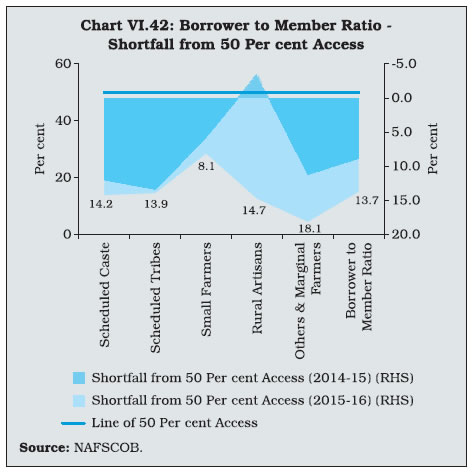 VI.64 A distinct pattern is observed in the financial performance of PACS. In contrast with a steady increase in the share of profit-making PACS, the decline in share of loss-making PACS has been sticky in recent years. At end-March 2016, the proportion of loss-making PACS stood at 39.7 per cent (marginally down from 40.6 per cent in 2012-13), while those in profit accounted for 48.1 per cent of the total number of PACS, up from 45.6 per cent in 2012-13 (Chart VI.44).26 As compared with higher tier short-term credit institutions, the profitability of the PACS has, however, worsened in the last three years (Chart VI.45). 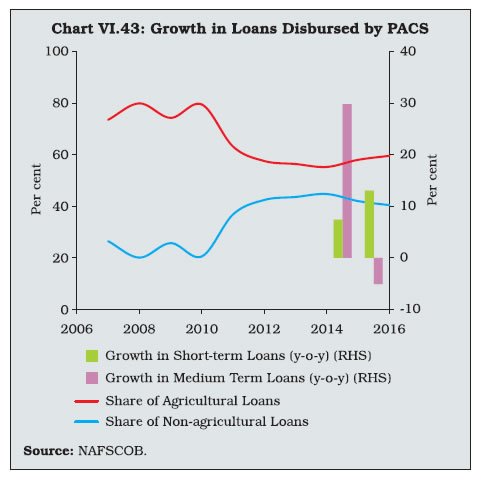 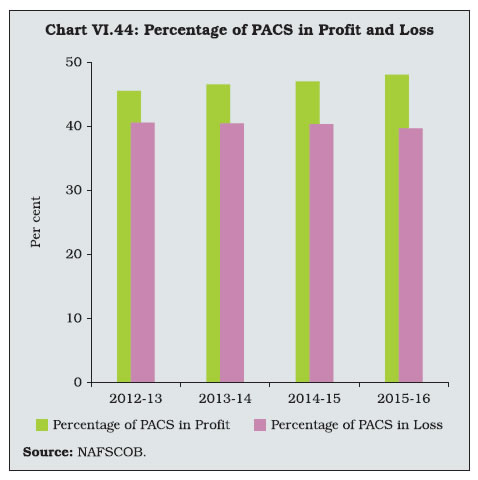 VI.65 From a regional perspective also, the proportion of profit-making PACS has been higher than that of loss-making ones in most of the regions, but net profits in absolute term have been negative across the board barring the western region (Chart VI.46). This suggests that it is mostly the larger sized credit societies in these regions that are performing poorly. On the other hand, the share of loss-making PACS exceeded that of the profit-making ones in the eastern and north-eastern regions (Chart VI.47). The rural economy in both the regions has been lagging behind due to topographical constraints and inadequate infrastructure resulting in volatile agricultural productivity. In addition, the co-operative structure not being a development indigenous to these regions, lack of awareness among the people in these regions about the advantages of the co-operative credit system and lack of technical know-how and training among the co-operative personnel, over the years have led to organisationally and financially weak base level institutions in these regions. 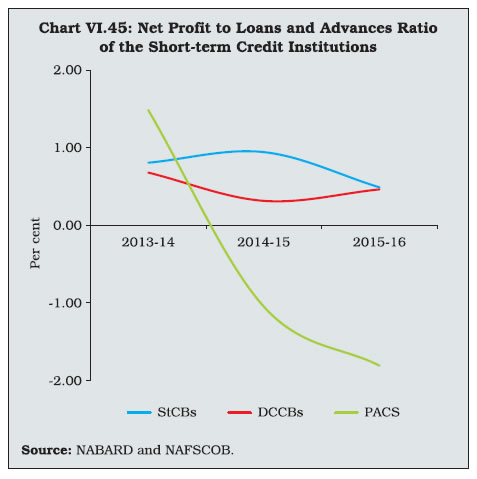 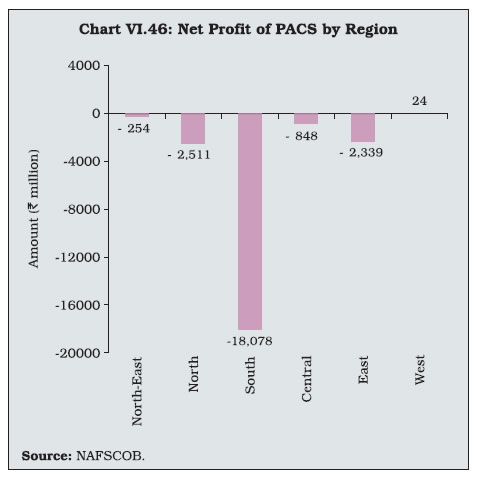 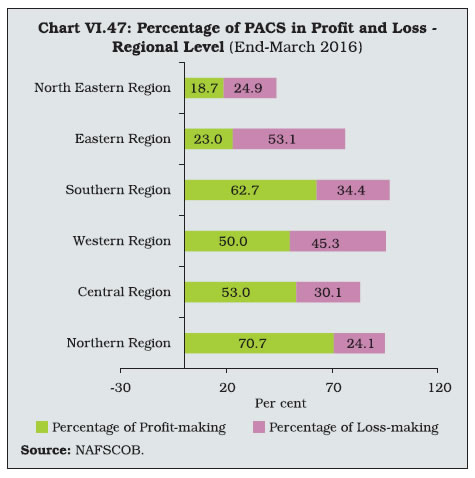 Status of Licensing of Short-term Rural Co-operatives VI.66 Two issues pertaining to the co-operative banking sector that the Committee on Financial Sector Assessment, 2009 (Chairman: Rakesh Mohan) had identified were capital adequacy and licensing of co-operative institutions. The Committee noted that even though Section 7 of the Banking Regulation Act, 1949 (AACS) prohibits the use of the words ‘bank’, ‘banker’ or ‘banking’ by any co-operative society other than a co-operative bank as part of its name, this provision does not apply to a PACS or a primary credit society (PCS). As per the Act, a primary credit society can automatically convert to a co-operative bank if it has banking as one of its main activities. It is required to apply to the Reserve Bank within three months of attaining capital plus reserves of ₹1 lakh for a license under Section 22 of the Banking Regulation Act (AACS), 1949 but it can carry on with the banking business unless the license application is refused. At one time, this led to the presence of a large number of unlicensed banks. The continued existence of such unlicensed co-operative institutions poses a risk to depositors’ interests and moreover, these institutions could resort to activities that are not very clearly defined. It was hence recommended that a roadmap be drawn up whereby banks, which failed to obtain a license by March 2012 would not be allowed to operate. This was to expedite the process of consolidation and the weeding out of non-viable entities from the cooperative space. As of April 16, 2016, all StCBs had been issued licenses. In comparison, the licensing of DCCBs, has been a slower process. Of the 371 DCCBs, 221 were licensed as of March 2011. To protect the interests of the depositors, the Reserve Bank prohibited the DCCBs that remained unlicensed beyond March 2012 from accepting fresh deposits. As of date, three DCCBs remain unlicensed (Chart VI.48).27 VI.67 Keeping in view the need to improve the banks’ preparedness for facing risks in an increasingly competitive business environment, the Reserve Bank stipulated that the banks maintain a minimum CRAR of 4 per cent for being eligible for a license. Further, in January 2014, StCBs and DCCBs were advised to achieve and maintain on an ongoing basis a CRAR of 7 per cent from March 31, 2015 and 9 per cent from March 31, 2017 as part of the harmonisation of capital regulations across all co-operative banks. The leverage (capital to assets) ratio for the DCCBs improved after capital infusions from state governments in 2012-13.28 The capital-to-assets ratios of both the StCBs and DCCBs were given an impetus in January 2014, when the Reserve Bank allowed them to issue Long-Term (Subordinated) Deposits (LTD) and Innovative Perpetual Debt Instruments (IPDI) to facilitate raising of capital funds (Tier I and Tier II) for the purpose of compliance with the prescribed CRAR norms (Chart VI.49). Consequently, the share of StCBs with CRAR above 9 per cent increased sharply in 2015-16. DCCBs exhibited similar but more subdued movements across the CRAR buckets (Chart VI.50). 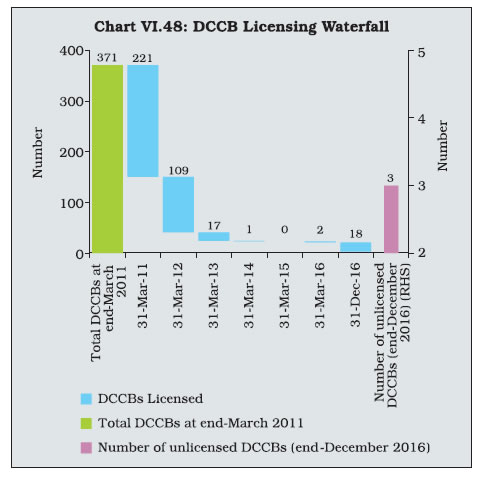 Long-term Rural Co-operatives VI.68 Long-term rural co-operatives include State Co-operative Agriculture and Rural Development Banks (SCARDBs) operating at the state-level and Primary Co-operative Agriculture and Rural Development Banks (PCARDBs) operating at the district/block level. Notwithstanding the deterioration in their financial health over time, Agricultural and Rural Development Banks (ARDBs) have historically played a very important role in improving the productivity of land through development of minor irrigation and facilitating farm mechanisation, promoting capital formation in agriculture and financing rural non-farm sector projects. State Co-operative Agriculture and Rural Development Banks VI.69 In most north-eastern states, except Assam and Tripura, there is no separate structure of long-term rural co-operatives. In Assam and Tripura, as also in Bihar, Uttar Pradesh, Jammu and Kashmir and Gujarat, there is a unitary structure, with SCARDBs operating through their branches at the district-level, there being no separate entity of PCARDBs. By contrast, in other states except Himachal Pradesh and West Bengal, there is a federal structure, with SCARDBs operating through PCARDBs. In Himachal Pradesh and West Bengal, there is a mixed structure, with SCARDBs operating through PCARDBs as well as through their branches. Balance Sheet Operations VI.70 The consolidated balance sheet of SCARDBs contracted in 2015-16 as almost all components except deposits on the liability side and cash and bank balances on the asset side fell. (Table VI.23).29 VI.71 On the asset side, credit disbursement contracted in 2015-16 constrained by the shrinking of internal resources, i.e., capital and reserves (broadly defined as net worth here) (Chart VI.51). Contraction in all major components of balance-sheet of SCARDBs during the year was mainly on account of liquidation of loss-making SCARDBs. | Table VI.23: Liabilities and Assets of State Co-operative Agriculture and Rural Development Banks | | (Amount in ₹ billion) | | Item | As at end-March | Variation (%) | | 2015 | 2016 | 2014-15 | 2015-16 | | 1 | 2 | 3 | 4 | 5 | | Liabilities | | | | | | 1. Capital | 10 | 9 | 4.8 | -6.8 | | | (2.9) | (3.3) | | | | 2. Reserves | 65 | 41 | 6.3 | -37 | | | (19.5) | (14.9) | | | | 3. Deposits | 18 | 24 | 18.4 | 29.8 | | | (5.5) | (8.7) | | | | 4. Borrowings | 161 | 146 | 5.3 | -9.5 | | | (48.4) | (53) | | | | 5. Other Liabilities | 79 | 55 | 11.6 | -29.5 | | | (23.6) | (20.2) | | | | Assets | | | | | | 1. Cash and Bank Balances | 4.3 | 4.4 | 43.4 | 4 | | | (1.3) | (1.6) | | | | 2. Investments | 30 | 29.6 | 9.9 | -1.3 | | | (9.0) | (10.8) | | | | 3. Loans and Advances | 212 | 204 | 5.2 | -3.7 | | | (63.7) | (74.2) | | | | 4. Other Assets | 87 | 37 | 11.5 | -57.3 | | | (26.0) | (13.4) | | | | Total Liabilities/Assets | 333 | 275 | 7.6 | -17.3 | | | (100) | (100) | | | Notes: 1. Figures in parentheses are percentages to total liabilities/ assets.
2. Y-o-y variations could be slightly different because absolute numbers have been rounded off to ₹1 billion in the table.
3. Components may not add up to the total due to rounding off.
Source: NABARD. | Profitability VI.72 The financial performance of SCARDBs remained weak, reflecting a sharp fall in income from other sources coupled with a decline in interest income by 11.4 per cent. However, a reduction in expenditure, due to a decline in provisions and contingencies and interest expenses resulted in a turnaround in profits of these institutions (Table VI.24). Asset Quality VI.73 The asset quality of SCARDBs has witnessed noteworthy improvement since 2012-13 as reflected in the consistent decline in their NPAs and an increase in the recovery-to-demand ratio since 2013-14 (Chart VI.52 and Table VI.25). VI.74 Concerted policy efforts are responsible for this decline. In 2015, the Board of Management of the National Co-operative Agriculture and Rural Development Banks Federation Limited launched an accelerated recovery and NPA management drive to revamp the existing repayment and recovery systems and improve the financial health of the SCARDBs. The drive aimed at reducing gross NPAs below the 10 per cent level in two years. | Table VI.24: Financial Performance of State Co-operative Agriculture and Rural Development Banks | | (Amount in ₹ billion) | | Item | As during | Variation (%) | | 2015 | 2016 | 2014-15 | 2015-16 | | 1 | 2 | 3 | 4 | 5 | | A. Income (i+ii) | 25 | 22 | -0.2 | -12.1 | | | (100.0) | (100.0) | | | | i. Interest Income | 24 | 22 | -1.2 | -11.4 | | | (96.4) | (97.2) | | | | ii. Other Income | 0.9 | 0.6 | 42.2 | -30.8 | | | (3.6) | (2.8) | | | | B. Expenditure (i+ii+iii) | 29 | 22 | -0.9 | -23.9 | | | (100.0) | (100.0) | | | | i. Interest Expended | 18 | 14 | 5.3 | -21.6 | | | (62.0) | (63.9) | | | | ii. Provisions and Contingencies | 6 | 4 | -28.9 | -37.7 | | | (21.1) | (17.3) | | | | iii. Operating Expenses | 5 | 4 | 36.7 | -15.5 | | | (16.9) | (18.8) | | | | C. Profits | | | | | | i. Operating Profits | 2 | 4 | -50.2 | 71.1 | | ii. Net Profits | -3.88 | 0.03 | -5.4 | 100.8 | Notes: 1. Figures in parentheses are percentages to total income/ expenditure.
2. Y-o-y variations could be slightly different because absolute numbers have been rounded off to ₹1 billion in the table.
3. Components may not add up to the total due to rounding off.
Source: NABARD. | VI.75 Moreover, in November 2014, a new fund, the “Long Term Rural Credit Fund (LTRCF)”, was set up in the NABARD for providing refinance support to co-operative banks and RRBs for their agricultural term-loan operations.30 The refinance facility is provided with a repayment period of five years at a concessional rate such that the banks pass on this benefit to the borrowing farmers (The NABARD revises this from time to time).31 In 2015-16, the number of fully functional SCARDBs came down to 13 from 18 in the previous year.32 SCARDBs that contributed the most to the accumulated losses are under liquidation and hence are no longer functioning (NABARD Annual Report, 2016-17). These developments fructified in the form of a decline in the NPA ratio from 35.6 per cent in 2013-14 to 16.6 per cent in 2015-16, while the recovery-to-demand ratio witnessed steady improvements from 33.3 per cent to 63.6 per cent over the same period. A comparison of SCARDBs with StCBs and UCBs puts into perspective how much of an impact these developments have had in uplifting the quality of assets of SCARDBs. The decline in NPAs of StCBs that operate under almost identical economic circumstances seems barely perceptible in comparison to that of the SCARDBs (Chart VI.53). 
| Table VI.25: Asset Quality of State Co-operative Agriculture and Rural Development Banks | | (Amount in ₹ billion) | | Item | As at end-March | Variation (%) | | 2015 | 2016 | 2014-15 | 2015-16 | | 1 | 2 | 3 | 4 | 5 | | A. Total NPAs (i+ii+iii) | 64 | 34 | -11.3 | -47.3 | | i. Sub-standard | 25 | 19 | -20.9 | -22.2 | | | (38.1) | (56.4) | | | | ii. Doubtful | 39 | 15 | -5.2 | -62.5 | | | (60.9) | (43.4) | | | | iii. Loss | 0.6 | 0.1 | 445.5 | -86.7 | | | (0.93) | (0.24) | | | | B. NPAs to Loans Ratio (%) | 30.3 | 16.6 | - | - | | C. Recovery to Demand Ratio (%) | 46.7 | 63.6 | - | - | Notes: 1. Figures in parentheses are percentages to total NPAs.
2. Y-o-y variations could be slightly different because absolute numbers have been rounded off to ₹1 billion in the table.
3. Components may not add up to the total due to rounding off.
Source: NABARD. | Asset Quality of SCARDBs: A Regional Perspective VI.76 From a regional perspective, the financial health of SCARDBs became more skewed during 2015-16. At end-March 2015, the northern and southern regions had high recovery to demand ratios and low (relative to the all-India average) NPA ratios, thus figuring in the quadrangle of the strongest financial health. Only two regions – central and western – figured in the quadrangle of the weakest financial health with high NPA ratios and low recovery to demand ratios (relative to the all-India average) (Chart VI.54 (a)). At end-March 2016, however, only the southern region remained in the sound performing (relative to all-India average) quadrangle while four regions (north; north-east; central; and western) feature in the quadrangle of weakest financial health. Within the weakest quadrangle, the financial health of the western region has improved while the financial health of SCARDBs in the central region deteriorated further, paralleling the poor performance of StCBs in the region (Chart VI.54 (b)).  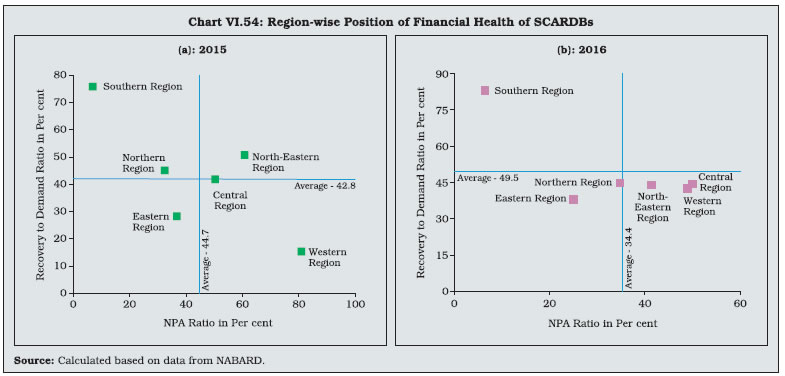 Primary Co-operative Agriculture and Rural Development Banks VI.77 PCARDBs are the lowest layer of long-term credit co-operatives. PCARDBs operate in close contact with their borrowers – farmers, artisans, craftsmen and other qualified persons – to sustainably develop their economic conditions. As in the case of SCARDBs, PCARDBs primarily draw on borrowings for lending purposes. Balance Sheet Operations VI.78 The consolidated balance sheet of PCARDBs also witnessed substantial contraction in 2015-16. All components of uses of funds, including the major components of loans and advances and other assets, declined from their levels in 2014-15. Sources of funds also recorded a decline from their levels in 2014-15, with deposits being the only exception (Table VI.26). | Table VI.26: Liabilities and Assets of Primary Co-operative Agriculture and Rural Development Banks | | (Amount in ₹ billion) | | Item | As at end-March | Variation (%) | | 2015 | 2016 | 2014-15 | 2015-16 | | 1 | 2 | 3 | 4 | 5 | | Liabilities | | | | | | 1. Capital | 13 | 11 | 3.7 | -17.8 | | | (4.3) | (4.5) | | | | 2. Reserves | 40 | 25 | -0.5 | -38.4 | | | (13.1) | (10.3) | | | | 3. Deposits | 10 | 14 | 15.9 | 33.2 | | | (3.3) | (5.6) | | | | 4. Borrowings | 164 | 143 | 5.6 | -12.8 | | | (53.3) | (59.3) | | | | 5. Other Liabilities | 79 | 49 | 4.4 | -38.7 | | | (25.9) | (20.2) | | | | Assets | | | | | | 1. Cash and Bank Balances | 3.9 | 3.6 | 10.4 | -9.4 | | | (1.3) | (1.5) | | | | 2. Investments | 20 | 15 | -1.3 | -25.9 | | | (6.6) | (6.2) | | | | 3. Loans and Advances | 148 | 127 | 7.2 | -14.4 | | | (48.3) | (52.7) | | | | 4. Other Assets | 135 | 95 | 2.8 | -29.2 | | | (43.9) | (39.6) | | | | Total Liabilities/Assets | 307 | 241 | 4.7 | -21.6 | | | (100.0) | (100.0) | | | Notes: 1. Figures in parentheses are percentages to total liabilities/ assets.
2. Y-o-y variations could be slightly different because absolute numbers have been rounded off to ₹1 billion in the table.
3. Components may not add up to the total due to rounding off.
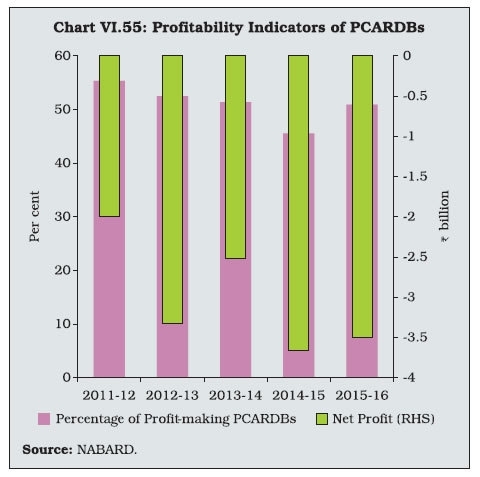
Source: NABARD. | Profitability VI.79 PCARDBs reported net losses in 2015-16 but of a lower order than in 2014-15, reflecting an increase in the proportion of profit-making PCARDBs (Table VI.27 and Chart VI.55). Financial Health of PCARDBs versus Financial Health of SCARDBs VI.80 The apex-level long-term co-operative structure showed some sign of revival during 2015-16. The financial health of PCARDBs deteriorated slightly during 2015-16, although the absolute level of NPAs of PCARDBs fell as the institutions contributing the most to their losses were liquidated (Table VI.28). | Table VI.27: Financial Performance of Primary Co-operative Agriculture and Rural Development Banks | | (Amount in ₹ billion) | | Item | As during | Variation (%) | | 2015 | 2016 | 2014-15 | 2015-16 | | 1 | 2 | 3 | 4 | 5 | | A. Income ( i+ii) | 24 | 21 | 3.8 | -13.4 | | | (100.0) | (100.0) | | | | i. Interest Income | 20 | 18 | 2.4 | -9.3 | | | (79.9) | (83.7) | | | | ii. Other Income | 5 | 3 | 9.8 | -29.9 | | | (20.1) | (16.3) | | | | B. Expenditure (i+ii+iii) | 28 | 25 | 7.8 | -12.4 | | | (100.0) | (100.0) | | | | i. Interest Expended | 17 | 15 | 8.3 | -11.4 | | | (60.2) | (60.9) | | | | ii. Provisions and Contingencies | 6 | 5 | 9.9 | -23.9 | | | (21.3) | (18.5) | | | | iii. Operating Expenses | 5.2 | 5.1 | 4.0 | -2.5 | | | (18.5) | (20.6) | | | | C. Profits | | | | | | i. Operating Profits | 2 | 1 | -20.5 | -52.4 | | ii. Net Profits | -3.66 | -3.45 | -45.2 | -5.7 | Notes: 1. Figures in parentheses are percentages to total income/ expenditure.
2. Y-o-y variations could be slightly different because absolute numbers have been rounded off to ₹1 billion in the table.
3. Components may not add up to the total due to rounding off.
Source: NABARD. |
 VI.81 The NPA ratio of the PCARDBs continued to remain much higher than that of the SCARDBs, while their recovery ratio remained below that of the SCARDBs in 2015-16 (Chart VI.56). | Table VI.28: Asset Quality of Primary Co-operative Agriculture and Rural Development Banks | | (Amount in ₹ billion) | | Item | As at end-March | Variation (%) | | 2015 | 2016 | 2014-15 | 2015-16 | | 1 | 2 | 3 | 4 | 5 | | A. Total NPAs (i+ii+iii) | 54 | 47 | 11.5 | -12.4 | | i. Sub-standard | 27 | 25 | 23.6 | -9.3 | | | (50.9) | (52.8) | | | | ii. Doubtful | 26 | 22 | 1.4 | -15.7 | | | (48.5) | (46.6) | | | | iii. Loss | 0.32 | 0.29 | -13.5 | -9.4 | | | (0.60) | (0.62) | | | | B. NPAs to Loans Ratio (%) | 36.2 | 37.0 | - | - | | C. Recovery to Demand Ratio (%) | 44.6 | 43.6 | - | - | Notes: 1. Figures in parentheses are percentages to total NPAs.
2. Y-o-y variations could be slightly different because absolute numbers have been rounded off to ₹1 billion in the table.
3. Components may not add up to the total due to rounding off.
Source: NABARD. |
IV. A Comparative Assessment of Short-term and Long-term Rural Credit Co-operatives VI.82 The turnaround in the financial performance of the long-term rural co-operative credit institutions in 2015-16 augurs well as these institutions cater to the long-term financial needs of the rural economy. A comparison of the apex-level institutions of short-term and long-term co-operatives, StCBs and SCARDBs, brings out the dwindling asset and credit sizes and weakening capital positions of long-term vis-à-vis short-term credit institutions. A consistent fall in the relative asset size/credit/capital of SCARDBs for every ₹100 of total assets/credit/capital of StCBs over the past few years reflects the extent of the problems faced by these long-term credit institutions (Table VI.29). VI.83 With the ongoing liquidation of unviable institutions, the number of long-term credit institutions has been on a decline for some time now. In addition, as mentioned before, in January 2014, StCBs/DCCBs were also permitted to issue LTDs and IPDIs to facilitate raising of capital funds (Tier I and Tier II) for the purpose of compliance with the prescribed CRAR. Consequently, the capital base of the StCBs expanded by a larger extent than that of SCARDBs since 2014-15. In July 2016, urban and short-term rural co-operative banks were given more freedom for raising capital. Co-operative banks fulfilling certain financial soundness criteria were permitted to raise LTDs without prior approval of the Reserve Bank, subject to the condition that the outstanding amount of LTDs, which is eligible to be reckoned as Tier II capital, is limited to 50 per cent of Tier I capital. | Table VI.29: Comparison of Assets, Credit and Capital Size of SCARDBs and StCBs | | Year | Amount of Assets of SCARDBs per ₹100 of Assets of StCBs | Amount of Credit of SCARDBs per ₹100 of Credit of StCBs | Amount of Capital of SCARDBs per ₹100 of Capital of StCBs | | 2012-13 | 18.3 | 20.1 | 29.0 | | 2013-14 | 16.3 | 19.5 | 25.1 | | 2014-15 | 16.7 | 18.5 | 18.2 | | 2015-16 | 13.3 | 16.6 | 16.1 | | Source: NABARD. | VI.84 There exists a wide gap between StCBs and SCARDBs in terms of various other performance indicators. The former remained profitable (albeit with some moderation in profits in 2015-16) coupled with the lowest NPA ratios and the highest recovery ratios among the co-operatives, in contrast to SCARDBs, which had for long incurred losses and had impaired asset quality. SCARDBs’ RoA, however, turned around in 2015-16 as against negative returns recorded in the previous four years, while StCBs continued to record positive RoAs (Chart VI.57). The relatively better performance of StCBs reflects the concerted efforts made by the Central and State Governments along with the Reserve Bank and the NABARD in implementing various reforms aimed at strengthening the short-term credit institutions. 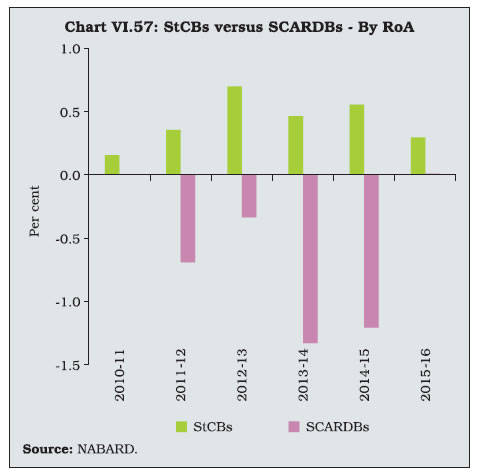 VI.85 From a business perspective, while the StCBs exhibited slower growth in credit in 2015-16, credit growth for DCCBs picked up in 2015-16. The NABARD had introduced a norm of linking the refinance eligibility of the StCBs with their CRAR for better accountability in 2012-13. Consequently, StCBs improved their capital positions considerably in 2014-15 and the refinance disbursed to them by the NABARD increased by 12.15 per cent. This may have provided a boost to growth in loans and advances of StCBs in 2014-15 which, in turn, led to a higher growth in DCCBs’ loans and advances in 2015-16. Credit off-take of PACS also grew at a slower pace, despite an increase in their numbers. VI.86 While refinancing through the Long Term Rural Credit Fund and active liquidation of unviable institutions may have played a role in improving the financial health of the long-term credit co-operatives, the general improvement in the NPA ratio and recovery performance of the short-term co-operatives could also be attributed to thorough monitoring by the NABARD. In addition, an incentive of additional rebate of 3 per cent given to farmers for prompt repayment of crop loans as part of the on-going interest subvention scheme for short-term crop loans could have played a role as well.33 VI.87 The capital position of both the StCBs and DCCBs have improved in 2015-16. The Reserve Bank will pursue the process of recapitalisation and licensing of the remaining three DCCBs in Jammu and Kashmir under the rehabilitation scheme approved by the government to create an environment where only licensed rural co-operative banks operate in the banking space. Keeping in view the need to improve the preparedness of the banks for facing risks in an increasingly competitive business environment, the NABARD has issued a guidance note on strengthening capital funds and improving CRAR of co-operative banks in 2015-16 and has conducted a workshop to facilitate the process. During the past few years, initiatives to train co-operative banks personnel have gained ground. It is hoped that with more streamlined training, there will be more efficient delivery of banking and financial services by the co-operatives which will, in turn, improve their operating efficiency across the tiers. V. Overall Assessment VI.88 The balance sheet of UCBs expanded in 2016-17, driven by demonetisation-induced growth in deposits, which got channelled into higher investments rather than credit. Reflecting continuing efforts at the consolidation of UCBs, their performance lifted in terms of their incremental credit-to-deposit ratio and profitability though their asset quality was affected by subdued economic conditions. VI.89 The Government and the Reserve Bank are undertaking several initiatives to further improve the financial health of the UCBs. The proposals of the Union Budget 2017-18 to shift from an accrual basis to an actual receipt basis for taxation of interest income on UCBs’ non-performing assets, as is the case for SCBs, and increasing the limit for tax deduction with respect to provisions on bad debt for all banks to 8.5 per cent from the earlier 7.5 per cent are important. The High-Powered Committee on Urban Co-operative Banks has suggested a way forward for UCBs by considering their conversion into SCBs and other differentiated banking institutions with the aim of subjecting them to harmonised regulations. At the same time, the Reserve Bank has relaxed the exposure limits on unsecured advances, subject to higher lending to the priority sectors, to incentivise UCBs to compete successfully with small finance banks that operate with similar loan portfolios but under more stringent regulatory norms. In 2016-17, the Reserve Bank also permitted all salary earners’ banks to grant advances against term deposits of non-members. Alongside, the Reserve Bank also plans to review the supervisory action framework for UCBs framed in 2014, such that the banks concerned can be engaged at an early stage for corrective action. Moving ahead, increased competition from other segments may necessitate efforts on the part of UCBs to adjust to the dynamic competitive environment on the one hand and continuing of regulatory reforms, on the other. VI.90 The expansion in size and improved capital position due to consolidation has facilitated the diversification of businesses by UCBs into non-traditional areas. Even as the phase of consolidation continues, efforts are being made to improve their operational efficiency. Proactive steps by the Reserve Bank in the form of providing financial assistance to UCBs for implementation of core banking solutions (CBS) and permitting them to offer all their products and services through ATM channels combined with allowing all co-operatives in May 2017 to deploy point of sale (POS) terminals and issue prepaid instruments will promote digitisation. VI.91 The short-term credit structure of rural co-operatives continued to show consistent improvements due to various regulatory reforms undertaken in recent years. On the contrary, the lowest tier, PACS, continued to be afflicted by structural deficiencies resulting in their weak performance. In this regard, while some of the recommendations of the Vaidyanathan Committee (2004) have been implemented, the recommendations that address governance issues and insuring deposits of PACS to protect the interests of member depositors will be beneficial in the long-term. NABARD in 2016-17 opened new lines of credit, viz. Additional Short Term (Seasonal Agricultural Operations) [ST-SAO] to help the rural co-operatives tide over their liquidity problems. The ST-SAO, for instance, is provided to SCBs for financing the PACS in such areas where the DCCBs are financially weak or are unable to finance PACS adequately so as to ensure credit flow to farmers. On the asset side as well, the NABARD has extended financial support to StCBs/DCCBs/ PACS to develop PACS as multi service centres (MSCs) so that they can increase their business portfolios and avenues of earning revenue and become self-sustainable entities. Union Budget 2017-18 has made an allocation of ₹1,900 crore over three years for bringing digital banking to PACS. This will link 63,000 societies with CBS of DCCBs allowing new generation banking services to be made available to the small and marginalised farmers who are members of these co-operative societies for the first time. All these measures are expected to improve the performance of the PACS going forward. VI.92 Despite the recent turnaround, the long-term rural co-operative credit structure continues to under-perform due to its inherent weaknesses. In this regard, the recommendations of the Task Force on the Revival of Rural Co-operative Credit Institutions (Long Term), 2006 (Chairman: Shri A. Vaidyanathan) regarding expanding the deposit, capital and product bases of these institutions merits consideration. A build-up of internal resources can help the long-term credit co-operatives to improve their credit disbursements, going forward. Given their significance in meeting the investment needs of the agricultural sector, it is critical that the long-term rural co-operative credit institutions be revived through concerted policy efforts.
|