|
I ECONOMIC REVIEW
I. MACROECONOMIC POLICY ENVIRONMENT
I.1.1 Global economic activity recorded robust growth in the first half of 2004 before encountering some slackening of pace in the second half of the year and in the first half of 2005. The possibility of downside risks arising from high and volatile crude oil prices, record macroeconomic imbalances in the US, fears of disruptive currency adjustments and asset bubbles weighed upon the global recovery which had been firming up since late 2003. Moreover, the recent divergences in growth patterns became more pronounced in 2004 with the burden of sustaining global growth gravitating towards the US, China and other emerging and developing economies in Asia and Latin America. By contrast, in Europe and Japan – which account for more than a fifth of world GDP – growth stalled in the second half of 2004. Consumer price inflation remained relatively benign worldwide in 2004 and financial market conditions turned favourable with ample liquidity and the continuing search for yields driving down risk spreads. Global growth reached a 28-year peak in 2004 and world trade volumes as well as net capital flows to developing economies returned to 1997 (pre-East Asian crisis) levels. Nevertheless, the persistence of the risk factors and the potential impact of the upturn in the international interest rate cycle on consumer indebtedness and asset prices make macroeconomic prospects for 2005 somewhat less sanguine than projected earlier. In its April 2005 World Economic Outlook, the International Monetary Fund (IMF) has trimmed its forecast for global growth in 2005 to 4.3 per cent from 5.1 per cent in 2004.
I.1.2 Against this backdrop, the Indian economy recorded one of the highest growth rates in the world in 2004-05, despite some setbacks arising from an insufficient monsoon and sporadic supply-side pressures on inflation. Real GDP growth at 6.9 per cent in 2004-05 despite a sharp slowdown in agriculture propelled average growth to 6.5 per cent in the first three years of the Tenth Five Year Plan period (2002-07). It exceeded, by a full percentage point, the average real GDP growth of 5.5 per cent achieved in the Ninth Plan period (1997-2002), while being broadly in line with the average of 6.7 per cent in the Eighth Plan period (1992-97). Noteworthy features of India’s macroeconomic performance in 2004-05 include: first, the improvement in investment climate and pick-up in industrial and service sector activity; second, emergence of buoyant exports as a driver of demand in a large spectrum of industries; third, modest consolidation in the fiscal position; fourth, successful management of liquidity in the backdrop of continuing capital flows; fifth, healthy investor confidence, as India received more than a quarter of the global portfolio flows to emerging market economies (EMEs) in 2004 though India’s share in foreign direct investment continued to be low at around 3 per cent; and finally, foreign exchange reserves reached US $ 141.5 billion at end-March 2005.
I.1.3 Underpinning the stronger than anticipated performance of the economy in 2004-05 was the quality and response of macroeconomic management in the face of some adversity. In view of the potential of destabilising pressures from increases in international fuel and other commodity prices, and the shock to food prices in the wake of the uneven South-West monsoon, policy coordination involved a continuous rebalancing of the weights assigned to growth and macroeconomic stability. A judicious mix of supply management, fiscal measures to contain the pass-through of imported inflation and monetary policy action to stabilise inflationary expectations helped in containing inflation from a mid-year peak of
* While the Reserve Bank of India’s accounting year is July-June, data on a number of variables are available on a financial year basis, i.e., April-March, and hence, the data are analysed on the basis of the financial year. Where available, the data have been updated beyond March 2005. For the purpose of analysis and for providing proper perspectives on policies, reference to past years as also prospective periods, wherever necessary, has been made in this Report.
8.7 per cent to 5.1 per cent by the close of the year, consistent with the projection given in the Annual Policy Statement of the Reserve Bank in May 2004. The Indian economy today is characterised by an environment of confidence, positive business expectations, a renewal of rule-based fiscal consolidation, stable and orderly financial markets and institutions and progressive integration with the global economy.
I.1.4 It is in this context that this survey of macroeconomic policy in 2004-05 highlights the blending of real sector policies designed to step up the momentum of growth with financial policies that ensure macroeconomic and financial stability. Concurrently, monetary policy operated as the anchor of the economy, ensuring liquidity, credit and interest rate conditions conducive to maintaining both growth and stability. Financial sector policies pursued the development and integration of financial markets and the soundness and efficiency of financial intermediaries that operate in an increasingly competitive environment. Improvements in credit delivery and customer satisfaction are the challenges that have to be addressed further.
REAL SECTOR POLICIES
I.1.5 In 2004-05, several policy initiatives were taken to strengthen the momentum of economic growth. Measures to boost agricultural productivity were supported by policies to expand the industrial base, especially through greater investment in infrastructure. In the context of globalisation of production systems, several initiatives were aimed at promoting exports, rationalising trade duties and preparing the economy for the commitments that may emerge from the Doha Round of the World Trade Organisation (WTO).
Agriculture and Allied Activities
I.1.6 The Government undertook several steps to expand the agricultural production frontier through diversification of production, spread of agricultural marketing, improvement of infrastructure including irrigation and extension of agricultural research during 2004-05. These measures were supported by parallel initiatives taken by the Reserve Bank and the National Bank for Agriculture and Rural Development (NABARD) to step up financing for agriculture. Several measures were also aimed at alleviating rural poverty.
I.1.7 In order to improve and expand irrigation facilities, the Fast Track Programme under the Accelerated Irrigation Benefit Programme (AIBP) was modified in April 2004 to provide Central assistance in the form of 70 per cent loan and 30 per cent grant for non-special category States and 10 per cent loan and 90 per cent grant for special category States. For projects outside the Fast Track Programme, an incentive of conversion of the loan to a grant is offered if projects are completed on schedule. The outlay for the AIBP in the Union Budget, 2005-06 was increased to Rs.4,800 crore from Rs.2,800 crore in 2004-05 to improve the pace of implementation.
I.1.8 A pilot scheme for repair, renovation and restoration of water bodies directly linked to agriculture is proposed to be taken up during the remaining period of the Tenth Plan. The Command Area and Water Management Programme was restructured in April 2004 to bring about better water management practices and efficient utilisation of irrigation water. The Union Budget, 2005-06 has also envisaged a national project for repair, renovation and restoration of water bodies in 16 districts in nine States covering about 20,000 hectares of additional land. Recognising the importance of water harvesting, the Department of Agriculture and Co-operation has formulated a scheme for enhancing sustainability of dryland rainfed farming with an allocation of Rs.200 crore for 2005-06. The scheme aims at addressing issues like rainwater harvesting and its efficient utilisation, soil moisture conservation, use of organic manures and adoption of improved dryland farming technologies. The scheme will be implemented in the arid and semi-arid regions of the country, particularly in the districts receiving annual rainfall less than 750 mm and with assured irrigation coverage less than 30 per cent of the net sown area.
I.1.9 The Union Budget for 2005-06 envisages that the Ministry of Agriculture would prepare a roadmap for agricultural diversification focusing mainly on fruits, vegetables, flowers, dairy, poultry, fisheries, pulses, oilseeds and other allied activities in a planned manner. An expert committee was appointed by the Government to suggest improvements in the price stabilisation fund to address the difficulties of the plantation sector. The Union Budget, 2004-05 had proposed a National Horticultural Mission with a view to doubling horticultural production by 2011-12. The Union Budget, 2005-06 allocated Rs.630 crore to the National Horticultural Mission. Critical to the success of the diversification programme as well as that of the National Horticulture Mission is the progress that States make towards amending their State Agricultural Produce Marketing Committee (APMC) Acts. While nine States and four Union Territories (UTs) have amended their APMC Acts, six States have initiated partial reforms.
I.1.10 The Government continued to strengthen agricultural marketing reforms during 2004-05. The Union Budget for 2005-06 has allocated Rs.72 crore for a new scheme of development of agricultural marketing with a view to inducing large investments from the private and the cooperative sectors for setting up agricultural markets, marketing infrastructure and support services such as grading, standardisation and quality certification. This is also expected to give a boost to commodity futures markets as grading and standardisation of agricultural commodities would facilitate the development of warehouse receipts. Several measures have been initiated to develop commodity futures markets. There are, at present, three multi-commodity exchanges and 22 regional exchanges in India.
I.1.11 In March, 2005 the Government approved a scheme to support the State programmes for extension reforms. The aim is to provide decentralised and demand-driven extension system by way of technology dissemination in the form of an Agricultural Technology Management Agency (ATMA) at the district level.
I.1.12 The National Commission on Farmers was reconstituted in November 2004 to address issues relating to a comprehensive medium-term strategy for food and nutrition security. It has recommended the establishment of Rural Knowledge Centres all over the countr y using modern information and communication technology. The Government proposes to join Mission 2007, a national initiative launched by an alliance comprising nearly 80 organisations including civil society organisations, which plans to set up a knowledge centre in every village by 2007, the 60th anniversary of India’s Independence. The Government would route its support through the NABARD.
I.1.13 In June, 2004 the Government launched a credit package to enhance the flow of credit to agriculture, in consultation with the Reserve Bank, the NABARD and commercial banks. The Union Budget, 2005-06 advised commercial banks (including Regional Rural Banks) and cooperative banks to increase the flow of credit by another 30 per cent. Public sector banks were advised to increase the number of borrowers by another 5 million in 2005-06. The National Agricultural Insurance Scheme (NAIS), introduced in rabi 1999-2000, would be continued in its present form for kharif and rabi 2005-06.
I.1.14 The Union Budget, 2005-06 proposes to extend the coverage of the Antyodaya Anna Yojana from 20 million Below Poverty Line (BPL) families to 25 million BPL families in 2005-06. The allocation towards providing the cost of food grains for Mid-day Meal Scheme was increased to Rs.3,010 crore.
Manufacturing and Infrastructure
I.1.15 Macroeconomic measures taken during 2004-05 to boost industrial productivity were bolstered by sector-specific initiatives to raise foreign direct investment (FDI), promote exports/Special Economic Zones (SEZs) and gear up to operating in a post-WTO environment.
I.1.16 The National Manufacturing Competitiveness Council (NMCC), set up in September 2004, provides a forum for policy dialogue to energise and sustain the growth of manufacturing industries. A National Commission for Enterprises in the Unorganised Sector, set up in September 2004, acts as an advisory body and a watchdog for the informal sector. The Investment Commission was constituted in February 2005 to facilitate greater inflow of FDI into the country. A National Committee on Rural Infrastructure (NCRI), chaired by the Prime Minister, would initiate policies to ensure time-bound provision of quality infrastructure in rural areas. In order to encourage setting up of units in knowledge-based industries such as pharmaceuticals, bio-technology and information technology, equity support would be provided through the Small and Medium Enterprises Growth Fund (SGF), which was launched in October 2004 by the Small Industries Development Bank of India (SIDBI) jointly with major public sector banks.
I.1.17 The National Electricity Policy announced by the Government in February 2005 aims at accelerated development of the power sector for providing electricity to all areas and protecting the interests of consumers and other stakeholders, keeping in view availability of energy resources, technology available to exploit these resources, economies of generation using different resources and energy security issues. Keeping pace with the technological advancements, the Government announced a Broadband Policy in October, 2004 with a view to providing impetus to broadband and internet penetration in the country.
I.1.18 The Government reviewed, in January 2005, the guidelines notified vide Press Note 18, which had stipulated its approval for new proposals for foreign investment/technical collaboration in fields where the foreign investor has or had any previous joint venture or technology transfer/trademark agreement in India. In terms of the revised policy notified vide Press Note 1 of 2005, prior approval of the Government would be required only in cases where the foreign investor has an existing joint venture or technology transfer/ trademark agreement in the same field. Even in the same field, prior approval will not be required in investments to be made by venture capital funds, or if existing joint venture investment by either of the parties is less than 3 per cent, or if the existing venture/collaboration is defunct or sick.
I.1.19 In February, 2005 the Government enhanced the composite foreign holding in the telecommunication sector from 49 per cent to 74 per cent in a host of basic services such as international and national long distance services, basic telephone service, cellular mobile service and unified access service. With a view to catalysing investment, creating new employment opportunities and adding to the housing and infrastructure stock, the Government allowed in March, 2005 FDI up to 100 per cent under the automatic route in townships, housing, built-up infrastructure and construction-development projects, subject to some guidelines.
I.1.20 A new scheme to establish a Free Trade and Warehousing Zone (FTWZ) was launched in December 2004 to create trade-related infrastructure to facilitate the import and export of goods and services with freedom to carry out trade transactions in free currency, with benefits as applicable for SEZ units. The Foreign Trade Policy in April 2004 proposed that an exclusive Services Export Promotion Council (SEPC) be set up in order to map opportunities for key services in main markets, and develop strategic market access programmes, including brand building in coordination with sectoral players and recognised nodal bodies of the services industry.
I.1.21 India introduced a new product patents regime in March 2005 by approving the Patents (Amendment) Bill 2005 covering drugs, foods and chemicals. This was in compliance with the Trade-Related Intellectual Property Rights (TRIPS) agreement of the WTO. Stronger patent laws are expected to encourage foreign investment in research and development projects and benefit the Indian economy.
I.1.22 The Union Budget, 2005-06 carries several measures to speed up industrial growth such as dereservation of 108 items from the items exclusively reserved for the SSI sector and framing of a Manufacturing Competitiveness Programme to revive the manufacturing sector - particularly small and medium enterprises - to enable it to adjust to the competitive pressures caused by liberalisation and moderation of tariff rates. A 10 per cent capital subsidy scheme for the textile processing sector was announced in addition to the normal benefits available under the Technology Upgradation Fund (TUF) Scheme. Financially viable infrastructure projects would be funded through a Special Purpose Vehicle (SPV) covering projects in roads, ports, airports and tourism. Finally, customs duties on a range of products were reduced to bring the tax structure closer to that of East Asian neighbours.
FISCAL POLICY
Central Government
I.1.23 The conduct of fiscal policy during 2004-05 was shaped by the Fiscal Responsibility and Budget Management (FRBM) Act, 2003 and FRBM Rules 2004 (notified by the Central Government on July 5, 2004), which set a new beginning to the fiscal consolidation process. The Central Government planned sharper reductions in the revenue and the fiscal deficits for 2004-05 than the minimum thresholds of the FRBM on expectations of higher tax mobilisation and perseverance with prudent expenditure management.
I.1.24 Fiscal policy had to undertake a mid-course realignment in 2004-05 in the form of post-Budget reduction in duties of petroleum products and non-alloy steel so as to mitigate imported supply-side pressures on inflation. In order to remain on the path of fiscal consolidation, the Government undertook measures to accelerate recovery of tax arrears, boost non-tax revenue and reduce low priority expenditure in the latter half of the year. The provisional accounts of 2004-05 indicate that the fiscal deficit and the primary deficit of the Central Government turned out to be lower than the revised estimates. The Central Government was able to achieve not only the FRBM targets for all the deficit indicators but also the budget estimates in respect of the fiscal deficit and the primary deficit. The revenue deficit was, however, marginally higher than the budget estimate due to lower tax revenues than anticipated. Nevertheless, there has been a significant improvement in the gross tax/GDP ratio from 8.8 per cent in 2002-03 to 9.2 per cent in 2003-04 and further to 9.9 per cent in 2004-05. A noteworthy feature is a sustained rise in the direct tax/GDP ratio to 4.3 per cent in 2004-05 from around 2 per cent during the 1970s and 1980s and around 3 per cent in the late 1990s.
I.1.25 Tax reforms in 2004-05 focused on streamlining of tax administration, recovery of tax arrears, widening of tax base and provision of full tax rebate for taxable income up to Rs. one lakh pending the revision of tax slabs and rates. The scope of the service tax was widened and excise duties were rationalised, especially in preparation for the introduction of Value Added Tax (VAT).
I.1.26 Guidelines on Expenditure Management –Fiscal Prudence and Austerity were issued on October 1, 2004. The Guidelines stipulate, inter alia, a scrutiny of all on-going programmes and schemes, a 10 per cent cut in budgetary allocations under non-Plan and non-salary expenditure and that all profit making public sector undertakings declare a minimum dividend of 20 per cent. The Government also reiterated its commitment to utilise only 33 per cent of budgeted expenditure in the last quarter of the financial year. Improved cash management practices introduced in 2003-04 in nine high spending departments/ministries were carried forward during 2004-05.
I.1.27 The Union Budget for 2005-06 is committed to tax reforms, employment-oriented economic growth, strengthening the social and rural infrastructure, cooperative fiscal federalism and emphasis on realisation of outcomes from the proposed expenditures. The need to earmark higher transfers to the State Governments under taxes and grants as recommended by the Twelfth Finance Commission (TFC), the need to make provision for compensating States for any revenue loss that may result from the implementation of VAT and discontinuation of the practice of treating disinvestment proceeds as a budgetary source of funds necessitated a ‘pause’ in the FRBM path during 2005-06.
Tax Reforms
I.1.28 The Union Budget, 2005-06 has simplified and rationalised direct taxes. On the personal income tax, measures include raising the exemption limit up to Rs. one lakh; reducing the effective tax rates through scaling up of tax brackets (i.e., 10 per cent for income between Rs.1 lakh and Rs.1.5 lakh, 20 per cent for income between Rs.1.5 lakh and Rs.2.5 lakh and 30 per cent for income above Rs.2.5 lakh); and removal of sectoral caps in tax savings to allow for a consolidated limit of Rs. one lakh. The threshold exemption levels for women and senior citizens were fixed higher at Rs 1.35 lakh and Rs 1.85 lakh, respectively. The level of taxable income at which the surcharge of 10 per cent would apply has been raised to Rs.10 lakh. These measures would increase disposable income and give taxpayers flexibility in planning their saving and investment. The corporate tax rate was reduced to 30 per cent from 35 per cent, though the surcharge was increased from 2.5 per cent to 10 per cent. The withholding tax on technical services was reduced from 20 per cent to 10 per cent so as to encourage technological upgradation.
I.1.29 Two new taxes have been introduced viz., the banking cash transaction tax (BCTT) and the fringe benefit tax (FBT). The BCTT was proposed to be levied at the rate of 0.1 per cent on cash withdrawals of over Rs.10,000 or more on a single day from banks to establish a trail to check tax evasion. The BCTT was, however, subsequently made applicable to cash withdrawals of Rs.25,000 and above in respect of individuals and Rs. one lakh and above for corporates from accounts other than savings accounts. The FBT was introduced to tax perquisites (excluding transport and canteen services) that are enjoyed collectively by employees and cannot be collected individually, and hence were escaping the tax net. The rates of securities transaction tax (STT) on various transactions were raised marginally.
I.1.30 On indirect taxes, the peak rate of customs duty on non-agricultural imports was reduced from 20 per cent to 15 per cent with a few exceptions. Customs duties on select capital goods and parts thereof were also reduced. In order to expand the coverage of goods under the Central Value Added Tax (CENVAT) rate of 16 per cent, three out of the five items – polyester filament yarn, tyres and air conditioners –were moved from the 24 per cent level to the CENVAT rate of 16 per cent. Excise duties were abolished on liquefied petroleum gas (LPG) for domestic consumption and on subsidised kerosene. The excise duty on other petroleum products, including petrol and diesel, has been fixed as a combination of ad valorem and specific duties. The service tax net was expanded to include nine additional services while retaining the tax rate at 10 per cent. Small service providers with gross turnover not exceeding Rs. four lakh per annum were exempted from service tax.
Expenditure Management
I.1.31 The Union Budget, 2005-06 has emphasised the need to reorient expenditure whereby performance is monitored in terms of outcomes rather than outlays. With a view to enhancing the effectiveness of implementation of various programmes, greater flexibility is accorded to ministries/depar tments in managing their departmental budgets with concomitant incentives and disincentives. To enhance transparency and accountability, ministries would be required to disseminate information regarding their expenditure and receipts to the general public on a frequent basis. Subsidies would be restructured and properly targeted so that the benefits are not usurped by those for whom they are not intended. The user charges would be reviewed to increase non-tax revenue and reduce the operational losses of commercial undertakings. In consonance with announcements in the Budget, the Central Government would be releasing an outcome budget which would specify the desired outcomes in quantitative terms with a time frame for achieving them.
State Governments
I.1.32 The policy framework for the State Governments in 2004-05 was shaped by three significant developments, viz., (i) the on-going fiscal and institutional reforms at the State level, facilitated and supplemented by initiatives of the Central Government and the Reserve Bank; (ii) the general acceptance of the recommendations of the TFC which would form the basis of federal fiscal relations over the five-year period beginning 2005-06; and (iii) the implementation of the VAT by a number of States with effect from April 1, 2005.
I.1.33 The Report of the Working Group of select State Finance Secretaries and a representative of the Central Government, constituted to frame a model fiscal responsibility legislation (FRL) at the State level, was finalised in January 2005 and subsequently placed in the public domain. It provides a framework for FRL and leaves it to the discretion of the States to work out the specifics in respect of various parameters. Manipur, Chhattisgarh and Tripura presented their FRL Bills while Andhra Pradesh promulgated an ordinance in this regard. Twelve States (Karnataka, Kerala, Punjab, Tamil Nadu, Uttar Pradesh, Orissa, Rajasthan, Maharashtra, Assam, Gujarat, Himachal Pradesh and Haryana) have already enacted their FRLs. Meghalaya, Madhya Pradesh and Uttaranchal have proposed FRL in their budgets for 2005-06.
I.1.34 The TFC Report tabled in Parliament in February 2005 contains the blueprint of fiscal federalism over the medium term (Box I.1). A larger amount of transfers than in the past has been considered so as to reverse the decline in the volume of transfers relative to GDP and to ensure minimum
Box I.1
Summary of Recommendations of the Twelfth Finance Commission
The major recommendations of the Twelfth Finance Commission (TFC) (Chairman: Dr. C. Rangarajan) for the award period 2005-06 to 2009-10 pertain to restructuring of public finances, resource transfers from the Centre to States through tax devolution, grants and debt relief.
Under the TFC’s recommendations, the targets for the fiscal and the revenue deficit (relative to GDP) for the Centre and States are placed at three per cent and zero, respectively. The targets for the revenue deficit and the fiscal deficit are to be achieved by 2008-09 and 2009-10, respectively. The targets for the combined (Centre and States) tax-GDP ratio and the debt-GDP ratio are set at 17.6 per cent and 75 per cent, respectively, to be achieved by 2009-10. Enactment of Fiscal Responsibility Legislation (FRL) by States is recommended. Furthermore, the system of on-lending by the Centre to the States is to be phased out.
Correction of vertical and horizontal imbalances is sought to be achieved by increasing States’ share in the divisible pool of taxes to 30.5 per cent from 29.5 per cent recommended by the Eleventh Finance Commission (EFC), implying transfer of an estimated Rs. 6,13,112 crore to the States during the award period. Furthermore, in case of enactment of any legislation on service tax, the revenue accruing to a State should not be less than the share that would accrue to it had the entire service tax proceeds been part of the shareable pool. Tax devolvement among the States has been based on weights to factors like per capita income distance, population, area, tax effort and fiscal discipline, i.e., similar to that adopted by the EFC with some variation in weights assigned to the different parameters.
The TFC also recommends that Central Plan assistance to States as a combination of loans and grants be discontinued and take the form of only grants with few conditionalities. Total grants are placed at Rs.1,42,640 crore which is about 2.5 times the amount recommended by the EFC.
A two-pronged approach to debt relief was adopted by the TFC in place of the Fiscal Reform Facility, viz: (i) a general scheme of debt relief by consolidating and rescheduling outstanding Central loans and (ii) a write-off scheme linked to fiscal performance. Loans given to States from the NSSF have been excluded from the scope of debt relief as they are in the Public Account. Moreover, enactment of FRL would be a necessary pre-condition for availing debt relief with the benefit accruing prospectively.
The TFC also recommended the provision of a sum of Rs. 25,000 crore to augment the consolidated fund of the States to supplement resources of local bodies. The enhancement of Calamity Relief Fund (CRF) for the period 2005-10 is also recommended. Other important suggestions include institutional reforms regarding constitution of ‘Loan Council’ to supervise State borrowings, setting up of sinking funds, guarantee redemption funds and sharing profit petroleum.
vertical transfers (between Centre and States) while correcting a larger horizontal imbalance (among States). Total resource transfers from the Centre to the States (comprising shareable tax revenue and grants) have been placed at Rs.7,55,752 crore for the period 2005-06 to 2009-10, nearly 74 per cent higher than for the period 2000-01 to 2004-05 recommended by the Eleventh Finance Commission.
I.1.35 The State Budgets for 2005-06 continued to place emphasis on fiscal consolidation through curtailment of unwarranted expenditure. Some State Governments have proposed to modify, if not revoke, the policy of providing free power to some sections of society. Some States have implemented Contributory Pension Funds in order to address their large pension obligations. Initiatives to clear the arrears of defaulting public sector undertakings as well as according high priority to power sector reforms were also evident in the State budgets.
I.1.36 An important achievement in the arena of tax reforms is the implementation of VAT by 20 State Governments with effect from April 1, 2005 following the release of a White Paper on the subject by the Empowered Committee of State Finance Ministers. Avoidance of the cascading effects of taxation and the promotion of tax compliance through a system of self-assessment, which are intrinsic to the VAT, would not only lead to enhanced economic efficiency but also to revenue buoyancy over a period of time. The Union Budget for 2005-06 includes a provision of Rs.5,000 crore as compensation to the States on account of shortfall in revenue that may arise due to implementation of State-level VAT. A major issue which the Empowered Committee would revisit during 2005-06 relates to the phasing out of the inter-State or Central Sales Tax (CST). The States mobilise around Rs.15,000 crore of revenue annually from this source.
EXTERNAL SECTOR POLICIES
I.1.37 The dynamics of global trade and the opportunities provided by bilateral and multilateral trading platforms have necessitated a continuous realignment of India’s international trade strategies and priorities. In this regard, a comprehensive Foreign Trade Policy 2004-09 (FTP 2004) was announced on August 31, 2004. The basic objective of the policy is to double India’s share of global merchandise trade by 2009 and to make exports an effective instrument of economic growth and employment generation. The key strategies adopted in the FTP to enhance exports include facilitating the development of India as a global hub for manufacturing, trading and services; identifying and nurturing special focus areas like agriculture, handlooms, handicraft, gems and jewellery, leather and footwear, and marine sectors; simplification of procedures; reduction in transaction costs; and neutralisation of incidence of all levies and duties on inputs used for exports. In addition, export promotion schemes such as ‘Vishesh Krishi Upaj Yojna’ and ‘Served from India’ were also announced to accelerate the growth of agricultural and service exports. FTP 2004 also revamps and revitalises the Board of Trade to advise the Government on policy measures for preparation and implementation of short-term and long-term plans for increasing exports.
I.1.38 In February, 2005 certain ‘thrust areas’ were identified for policy implementation during 2005. These included the introduction of Electronic Data Interchange (EDI) with regard to foreign trade for online filing and data collection; implementation of the Report of the Task Force on Project Exports; shaping of the contents of SEZ and Competitive Economic Zone Policy, including the Central SEZ Act, to enable world class infrastructure through private participation and a hassle-free regulatory regime in various areas including taxation, customs and labour, in the SEZs; and institutional reform in terms of decentralisation, simplification, transparency, accountability and e-governance.
I.1.39 The FTP was backed by a number of measures to accord greater flexibility to exporters in their foreign exchange transactions. Exporters were allowed to approach banks to open/hire warehouses abroad initially for one year on a renewal basis. Payments in foreign currency were allowed by units in domestic tariff areas (DTAs) towards goods supplied to them by units in SEZs and by project/ service exporters to their Indian suppliers/ service providers. Realisation of export proceeds up to 360 days from the date of shipment was allowed for export of goods on a consignment basis. Exporters, including those in small and medium sectors, with good track record were made eligible for the Gold Card scheme for easy availability of export credit.
I.1.40 The FTP was fine-tuned in April 2005. The Policy provides a package of incentives and promotional measures for agriculture, marine products, export oriented units and service sectors. It envisages major procedural simplification to reduce transaction costs and the setting up of an Inter-State Trade Council to engage State Governments more actively in the export effort. It also proposes to abolish cess on export of all agricultural and plantation commodities levied under the various Commodity Board Acts. In order to give a boost to agricultural exports, benefits under the Vishesh Krishi Upaj Yojana have been extended to poultry and dairy products in addition to flowers, fruits, vegetables, minor forest produce and value added products.
I.1.41 Impor ters have been accorded greater flexibility in transactions. Documentation for import remittances made into India has to be provided only for amounts above US $ 100,000. The limit for accepting exchange control (EC) copy of bill of entry for import remittances was also enhanced to US $ one million on a selective basis. Credit for imports up to US $ 20 million per transaction with a maturity period beyond one year and up to three years was permitted for import of capital goods. Limit for direct receipt of import bills/documents by non-corporate importers was raised to US $ 100,000 or its equivalent.
Management of Foreign Exchange Transactions
I.1.42 Several measures were undertaken by the Reserve Bank to liberalise foreign exchange transactions by residents during 2004-05. The condition that shares should be offered at a concessional price for the acquisition of foreign securities by residents under the Employees Stock Option Plan (ESOP) was dispensed with. Shares acquired under the ESOP were allowed to be sold without obtaining prior permission of the Reserve Bank, provided the proceeds thereof are repatriated to India.
I.1.43 With a view to promoting Indian investments overseas, the ceiling on overseas investment by Indian entities was raised from 100 per cent to 200 per cent of their net worth under the automatic route. Corporates were granted general permission for conversion of the ECBs into equity with the exception of import payables deemed as ECBs and subject to prescribed repor ting requirements. General permission was also granted for transfer of shares and convertible debentures (excluding financial services sector) subject to compliance with the terms and conditions and reporting requirements for transfer by a person resident in India to a person resident outside India and vice versa.
MONETARY POLICY FRAMEWORK1
I.1.44 The monetary policy stance for 2004-05 was conditioned by expectations of a normal monsoon, sustained growth in industry and exports, and the assumption of no significant supply shocks. The Reserve Bank’s Annual Policy Statement for 2004-05 recognised that international interest rates were hardening, international crude prices would remain elevated and volatile and capital inflows would persist. Consistent with the expectation of real GDP growth of 6.5 to 7 per cent, inflation at 5 per cent, non-food credit growth (adjusted) at 16 to 16.5 per cent and the Centre’s borrowing programme within a fiscal deficit of 4.4 per cent of GDP, the overall stance of monetary policy for 2004-05 was stated as:
• Provision of adequate liquidity to meet credit growth and support investment and export demand in the economy while keeping a very close watch on the movements in the price level.
• Consistent with the above, while continuing with the status quo, to pursue an interest rate environment that is conducive to maintaining the momentum of growth and macroeconomic and price stability.
I.1.45 During the year, however, monetar y management faced severe challenges, warranting a re-balancing of objectives in the context of underlying developments. The risks to stability being perceived as high from these developments, monetary policy measures were undertaken in a calibrated manner during the year. Even as the inflation projection was raised to around 6.5 per cent in the Mid-term Review October 2004, the Reserve Bank intensified the monitoring of price movements, switching its stance from a ‘very close watch on the movements in the price level’ in the Annual Policy Statement to ‘equal emphasis on price stability’ in the Mid-term Review. Similarly, the objective of liquidity management was changed from a provision of ‘adequate liquidity’ to ‘appropriate liquidity’.
I.1.46 The Reserve Bank’s Annual Policy Statement of April 2005 stated that the stance of monetary policy would depend on several factors, including macroeconomic prospects, global developments and the balance of risks. Assuming a normal monsoon, and barring the emergence of any adverse and unexpected developments in various sectors of the economy and keeping in view the inflationary situation, the overall stance of monetary policy for the year 2005-06 would continue to be as set out in the Mid-term Review of October 2004.
I.1.47 In its First Quarter Review of the Annual Statement on Monetary Policy (July 26, 2005), the Reserve Bank indicated that its current assessment
1 A detailed discussion of monetary management is presented in Section III (';Monetary and Credit Policy Operations';) of the Report.
of macroeconomic outlook and the overall stance remains broadly unchanged.
Credit Delivery System
I.1.48 The Reserve Bank intensified efforts to improve the credit delivery system with a view to stepping up credit to agriculture and small and medium enterprises. As a multi-pronged strategy for facilitating credit to the priority sector, the number of categories of advances under the ambit of the priority sector lending was enlarged and limits on loans under the priority sector were enhanced. Banks were allowed to advance loans to distressed urban poor to prepay their debt to non-institutional lenders against appropriate collateral or group security and classify the same under weaker sections within the priority sector.
I.1.49 Banks were advised to make efforts to increase their disbursements to small and marginal farmers to 40 per cent of their direct advances under special agricultural credit plans (SACPs) by March 2007. In view of the Union Finance Minister’s announcement in June 2004 for doubling the flow of credit to agriculture in the next three years, private sector banks were advised to fix the SACP target for the year 2005-06 showing a growth rate of 30 per cent over disbursements during the year 2004-05. Banks were allowed to waive margin/ security requirements for agricultural loans up to Rs.50,000 and in the case of agri-business and agri-clinics for loans up to Rs five lakh. Interest rates on the Rural Infrastructure Development Fund (RIDF) were revised downwards in alignment with the softening of the interest rate structure over the years.
I.1.50 Several initiatives were also taken to facilitate the development of micro-finance. The NABARD revised the Model Kisan Credit Card (KCC) scheme with a view to providing the comprehensive credit requirements of farmers - covering term credit, working capital for agriculture and allied activities and a reasonable component for consumption needs -under a single window in a timely manner.
FINANCIAL SECTOR POLICIES2
I.1.51 The thrust of the Reserve Bank’s financial sector policies continued to be on strengthening the health of financial institutions as well as on improving the efficiency of financial markets. Policy initiatives encompassed the adoption of international standards and codes in the banking system, strengthening urban cooperative banks (UCBs) and non-banking financial companies (NBFCs) and improvement in customer services. The Reserve Bank undertook several initiatives to improve corporate governance in the banking system. The Indian banking system became fully compliant with Basel I standards by March 2005.
I.1.52 The Reserve Bank intensified its efforts to ensure that UCBs emerge as a sound and healthy network of jointly owned, democratically controlled and ethically managed banking institutions providing need-based quality banking services essentially to the middle and lower middle classes and marginalised sections of the society. The Reserve Bank continued to take policy initiatives with a view to developing NBFCs as financially strong entities.
I.1.53 The Reserve Bank continued to stress the need to improve customer services by banks to ensure that the benefits of financial liberalisation percolate to the widest sections of society. Several measures were undertaken on the basis of the recommendations of the Committee on Procedures and Performance Audit on Public Services (Chairman: Shri S. S. Tarapore).
Policies for Financial Markets
I.1.54 During 2004-05, the Reserve Bank undertook several initiatives to further improve the functioning of the money, the debt and the foreign exchange markets. Internal technical groups on the money market, the Government securities market and the foreign exchange market were set up to chart a medium-term framework for the future course of market development in the context of the ongoing changes in the institutional framework and market dynamics.
I.1.55 In the capital market, policy initiatives were directed towards further broadening and deepening the markets, achieving better investor protection and making the market investor friendly. In the primary market, the share of retail investors’ in the public issues was raised from the existing 25 per cent to 35 per cent. The scope of retail investment was scaled up to Rs. one lakh from the earlier limit of Rs.50,000. In order to make the issue process user-friendly, disclosures in issue prospectus were simplified and presentation was made uniform. Steps were also taken for shortening the allotment period for the new issues. In the secondary market, a comprehensive risk management framework for the cash segment was
2 A detailed discussion of financial market and financial sector policies is presented in Section IV (';Development and Regulation of Financial Markets';) and Section V (';Financial Regulation and Supervision';) of the Report.
introduced to keep pace with the dynamic state of the markets. Risk containment measures and position limits in the equity derivatives were also modified.
I.1.56 In order to strengthen the corporate governance practices for the listed companies, the Securities and Exchange Board of India (SEBI) revised the existing Clause 49 of the listing agreement to introduce significant changes in areas such as composition of the board of directors, audit committee, report on corporate governance and compliance with the norms. The revised code comes into effect from January 1, 2006. The listing of all debt securities irrespective of the mode of issuance (i.e., whether issued on private placement basis or through public/ rights issue) is to be done through a separate listing agreement.
I.1.57 The Union Budget Speech, 2005-06 laid strong emphasis on strengthening the Indian capital market. With a view to developing the corporate bond market, a high-level expert committee on corporate bonds and securitisation was proposed to examine legal, regulatory, tax and market design issues. The definition of ‘securities’ would be amended under the Securities Contracts (Regulation) Act, 1956 so as to provide a legal framework for trading of securitised debt, including mortgage-backed debt. It was also decided to allow FIIs to submit appropriate collateral, in cash or otherwise, as prescribed by the SEBI, while trading in derivatives in the domestic market.
I.1.58 The Union Budget, 2005-06 envisages the provision of legal validity for over-the-counter (OTC) derivative contracts. Mutual funds would be allowed to introduce Gold Exchange Traded Funds (GETFs) in consultation with the Reserve Bank. To make Mumbai a regional hub for finance, a high-powered expert committee is proposed to be set up in consultation with the Reserve Bank to advise the Government.
Changes in the Legal Framework
I.1.59 Several significant initiatives were undertaken in 2004-05 towards improving the legal infrastructure. The Enforcement of Security Interest and Recovery of Debt Laws (Amendment) Act, 2004 amended the Securitisation and Reconstruction of Financial Assets and Enforcement of Security Interest Act, 2002 (SARFAESI), the Recovery of Debts Due to Banks and Financial Institutions Act, 1993 and the Companies Act, 1956. The Banking Regulation (Amendment) and Miscellaneous Provisions Act, 2004 came into force in September 2004. The Credit Information Companies (Regulation) Act, 2005 requires companies in the business of credit infor mation to obtain a cer tificate of registration from the Reserve Bank.
I.1.60 A number of key reform bills were introduced in the Parliament. The Government Securities Bill, 2004 introduced in the Lok Sabha in December 2004 proposes to consolidate and amend the laws relating to the Government securities and its management by the Reserve Bank.
I.1.61 The Reserve Bank of India (Amendment) Bill, 2005 seeks to amend the Reserve Bank of India Act, 1934 to define the expressions ‘derivative’, ‘repo’ and ‘reverse repo’. The Reserve Bank would be empowered to deal in derivatives, to lend or borrow securities and to undertake repos or reverse repos. The lower floor and upper ceiling on the cash reserve ratio (CRR) would be removed to provide the flexibility to the Reserve Bank to specify the CRR. The ambiguity regarding the legal validity of OTC derivative products is also being addressed through amendment to the Reserve Bank of India Act. The Reserve Bank would be empowered to lay down policy and issue directions to any agency dealing in various kinds of contracts in respect of Government securities, money market instruments and derivatives and to inspect such agencies.
I.1.62 Although there is no specific restriction in the Banking Regulation Act on acquisition of shares in a banking company, no person can at present exercise voting right in excess of 10 per cent of the total voting rights of all the share holders. The Banking Regulation (Amendment) Bill, 2005 seeks to amend the Banking Regulation Act, 1949 to include provisions for removing the restriction on voting rights concurrently with the stipulation of the statutory requirement of prior approval for acquisition of shares above five per cent of the voting rights in banking companies. The Reser ve Bank would now be accorded the power to specify Statutory Liquidity Ratio (SLR) without any floor, subject to the existing ceiling of 40 per cent of total demand and time liabilities. It may also specify any security as an approved security for this purpose. The Reserve Bank would have the right to call for information and returns from the associate enterprises of banking companies also and inspect them, if necessary. It would have the authority to supersede the board of directors of a bank and appoint an administrator to manage the bank till alternative arrangements are made. Finally, the Reserve Bank would also be vested with the powers to order a special audit of co-operative banks in the public interest.
II. THE REAL ECONOMY
I.2.1 Setbacks from an uneven and deficient South-West monsoon and high international crude oil prices in 2004-05 tempered the robust resurgence of growth that had been achieved in the preceding year. Although real GDP growth slowed to 6.9 per cent in relation to the 8.5 per cent in 2003-04, the overall macroeconomic performance was impressive during 2004-05. India remained one of the fastest growing emerging market economies. The growth of real GDP originating in agriculture and allied activities in 2004-05 turned out to be more resilient than anticipated and a certain degree of insulation from weather shocks seems to have set in. The firming up and spread of the upturn in industrial activity led by manufacturing was supported by a positive investment climate, business confidence and buoyant external demand. Financial performance of the corporate sector was robust during the year. However, it was the services sector that anchored the growth process during the year, contributing as much as 70.5 per cent to the real GDP growth in 2004-05 (Table 1.1 and Appendix Table I.4). Trade, transpor tation, communication, business and financial services, software services including Information Technology Enabled Services (ITES)-Business Process Outsourcing (BPO) were the key movers of services sector growth in 2004-05.
AGGREGATE SUPPLY
Agriculture
I.2.2 Growth of real GDP originating from ‘agriculture and allied activities’ decelerated sharply to 1.1 per cent during 2004-05 from 9.6 per cent a year ago. This was essentially the outcome of the uneven and deficient South-West monsoon besides the base effect of the high growth of 2003-04. During 2004, the South-West monsoon turned erratic with an unusual warming of sea surface temperatures over the Equatorial Central Pacific region leading, in turn, to prolonged weakness/break in the monsoon over different parts of India.
Table 1.1: Growth Rates of Real GDP
| |
|
|
|
|
|
|
|
|
|
|
|
| |
|
|
|
|
|
|
|
|
|
|
|
|
|
(Per cent) |
| |
|
|
|
|
|
|
|
|
|
|
|
|
|
|
|
|
Sector |
|
|
|
2004- |
2003- |
1993-94 to |
|
2004-05 |
|
|
2003-04 |
|
| |
|
|
|
|
05# |
04* |
2002-03 |
Q1 |
Q2 |
Q3 |
Q4 |
Q1 |
Q2 |
Q3 |
Q4 |
| |
|
|
|
|
|
|
(Average) |
|
|
|
|
|
|
|
|
| |
|
|
|
|
|
|
|
|
|
|
|
|
|
|
|
|
1 |
|
|
|
|
2 |
3 |
4 |
5 |
6 |
7 |
8 |
9 |
10 |
11 |
12 |
| |
|
|
|
|
|
|
|
|
|
|
|
|
|
|
|
|
1. |
Agriculture and Allied Activities |
|
1.1 |
9.6 |
2.1 |
3.8 |
0.0 |
-0.5 |
1.8 |
0.1 |
7.2 |
18.2 |
10.4 |
| |
|
|
|
|
(20.5) |
(21.7) |
(26.5) |
|
|
|
|
|
|
|
|
| |
1.1 |
Agriculture |
|
|
n.a. |
10.3 |
2.0 |
|
|
|
|
|
|
|
|
|
2. |
Industry |
|
|
8.3 |
6.5 |
6.6 |
7.6 |
9.1 |
9.2 |
7.3 |
5.6 |
6.0 |
6.4 |
7.9 |
| |
|
|
|
|
(21.9) |
(21.6) |
(22.1) |
|
|
|
|
|
|
|
|
| |
2.1 |
Mining and Quarrying |
|
4.5 |
6.4 |
4.7 |
6.9 |
4.7 |
4.5 |
2.5 |
4.5 |
4.1 |
5.9 |
10.7 |
| |
2.2 |
Manufacturing |
|
|
9.2 |
6.9 |
7.1 |
7.9 |
9.6 |
10.5 |
8.6 |
6.1 |
6.9 |
7.0 |
7.6 |
| |
2.3 |
Electricity, Gas and Water Supply |
|
5.5 |
3.7 |
5.2 |
6.1 |
9.1 |
4.4 |
2.6 |
3.0 |
1.1 |
3.0 |
7.6 |
|
3. |
Services |
|
|
8.6 |
8.9 |
7.8 |
9.1 |
7.7 |
8.8 |
8.8 |
7.7 |
10.5 |
9.5 |
7.8 |
| |
|
|
|
|
(57.6) |
(56.7) |
(50.5) |
|
|
|
|
|
|
|
|
| |
3.1 |
Trade, Hotels, Restaurants, Transport, |
|
|
|
|
|
|
|
|
|
|
|
|
| |
|
Storage and Communication |
|
11.4 |
11.8 |
8.8 |
11.5 |
12.3 |
10.8 |
11.1 |
8.0 |
10.4 |
13.5 |
14.6 |
| |
3.2 |
Financing, Insurance, Real Estate and |
|
|
|
|
|
|
|
|
|
|
|
|
| |
|
Business Services |
|
7.1 |
7.1 |
8.0 |
7.0 |
5.5 |
8.2 |
7.7 |
6.4 |
7.2 |
7.3 |
7.6 |
| |
3.3 |
Community, Social and Personal Services |
5.9 |
5.8 |
6.9 |
8.2 |
3.0 |
5.6 |
7.2 |
9.0 |
14.9 |
5.2 |
-2.9 |
| |
3.4 |
Construction |
|
|
5.2 |
7.0 |
5.7 |
5.0 |
4.6 |
7.2 |
4.1 |
6.6 |
8.4 |
6.5 |
6.6 |
|
4. |
Real GDP at Factor Cost |
|
6.9 |
8.5 |
6.0 |
7.6 |
6.7 |
6.4 |
7.0 |
5.5 |
8.8 |
11.0 |
8.4 |
| |
|
|
|
|
(100) |
(100) |
(100) |
|
|
|
|
|
|
|
|
| |
|
|
|
|
|
|
|
|
|
|
|
|
|
|
|
|
*: Quick Estimates. # : Revised Estimates. n.a.: Not Available.
Note: 1. Figures in parentheses denote shares in real GDP.
2. Q1: First Quarter (April-June); Q2:Second Quarter (July-September); Q3: Third Quarter (October-December); and Q4: Fourth Quarter
January-March).
Source: Central Statistical Organisation. |
I.2.3 According to the Fourth Advance Estimates released by the Ministry of Agriculture on July 6, 2005, kharif foodgrains production is estimated at around 103 million tonnes during 2004-05 - a shortfall of around 12 per cent from the preceding year. The decline in foodgrains production emanated mainly from the slippage in the production of coarse cereals and rice. Kharif oilseeds also recorded a shortfall of around 11 per cent. Rabi production recouped some of the loss in kharif output. The rabi foodgrains production is estimated at over 101 million tonnes, exceeding the previous year’s level (around 97 million tonnes). The rabi output of rice and course cereals is expected to have scaled a new peak. Rabi oilseeds production is also expected to have exhibited a sharp rebound (31 per cent). Consequently, the total foodgrains production during 2004-05 is estimated at around 205 million tonnes, about four per cent lower than in the preceding year. Among the cash crops, the production of cotton and oilseeds is expected to have scaled a new high. The output of sugarcane is, however, expected to have suffered some losses. Overall, the index of agricultural production during 2004-05 is expected to have registered a decline of 1.2 per cent (Table 1.2).
I.2.4 In contrast to the decline in agricultural production during 2004-05, milk production exhibited an increase of 3.3 per cent, reflecting the relatively stable expansion of dairying activity as well as several initiatives by the Government to increase productivity of livestock. With a production of 91 million tonnes during 2004-05, India is the world's largest producer of milk. During the last two decades, while annual growth in food production was two per cent, annual milk production growth has been four per cent. At Rs.1,10,085 crore during 2003-04, the output of milk was almost 22 per cent of GDP originating from agricultural and allied activities. In this context, it may be noted that output of paddy and wheat constituted 15.4 per cent and 9.5 per cent, respectively, of GDP originating from agricultural and allied activities. The share of livestock sector output in GDP originating from agriculture and allied activities increased from 30.9 per cent during 1993-94 to 32.4 per cent during 2003-04. Trend in production of fruits and vegetables has also been encouraging. With 90 million tonnes of vegetable production in 2003-04, India is the largest producer of vegetables in the world. As regards fruits, India is the second largest producer in the world with a production of 47.5 million tonnes in 2003-04. The share of fruits and vegetables output in GDP originating from agriculture and allied activities
Table 1.2: Agricultural Production
| |
|
|
|
| |
|
|
|
|
|
|
Crop |
|
2004-05# |
2003-04 |
2002-03 |
|
1 |
|
|
2 |
3 |
4 |
| |
|
|
|
|
|
|
1. |
Growth Rate (Per cent)## |
|
|
|
| |
All Crops |
-1.2 |
21.8 |
-15.5 |
| |
a. |
Foodgrains |
-4.2 |
22.4 |
-18.4 |
| |
b. |
Non-foodgrains |
3.2 |
21.0 |
-11.1 |
|
2. |
Production (Million Tonnes) |
|
|
|
| |
a. |
Foodgrains |
204.6 |
213.5 |
174.8 |
| |
|
i. Rice |
85.3 |
88.3 |
71.8 |
| |
|
ii. Wheat |
72.0 |
72.1 |
65.8 |
| |
|
iii. Coarse Cereals |
33.9 |
38.1 |
26.1 |
| |
|
iv. Pulses |
13.4 |
14.9 |
11.1 |
| |
b. |
Non-foodgrains |
|
|
|
| |
|
i. Oilseeds++ |
26.1 |
25.3 |
14.8 |
| |
|
ii. Sugarcane |
232.3 |
237.3 |
287.4 |
| |
|
iii. Cotton@ |
17.0 |
13.9 |
8.6 |
| |
|
iv. Jute and Mesta+ |
10.5 |
11.2 |
11.3 |
| |
|
v. Tea* |
820.2 |
857.1 |
838.5 |
| |
|
vi. Coffee* |
N.A. |
270.5 |
275.3 |
| |
|
|
|
|
|
|
#: Fourth Advance Estimates as on July 6, 2005.
##: Based on Index of Agricultural Production with base triennium
ending 1981-82 = 100.
+: Million bales of 180 kg. each.
+ +: For nine oilseeds out of eleven in all.
@: Million bales of 170 kg. each.
*: Million kilograms and data for tea on a calendar year basis.
Source : Ministry of Agriculture, Government of India. |
increased sharply from 17.8 per cent during 1993-94 to 26.0 per cent during
2003-04.
I.2.5 As against the forecast of a normal monsoon by the India
Meteorological Department (IMD), the cumulative area-weighted rainfall during
the SouthWest monsoon season (June 1 to September 30) 2004 turned out to be
13 per cent below the Long Period Average (LPA) as against two per cent above
the LPA during the previous year. Notwithstanding an early onset, the monsoon
came to a halt for a fairly long duration during the critical sowing months
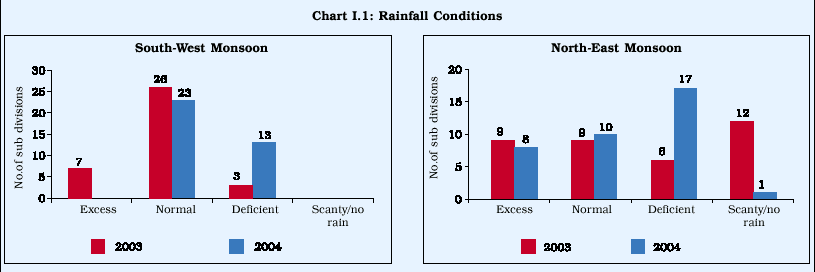
(June and July). The rainfall was also unevenly distributed with 23 out of 36
meteorological sub-divisions recording normal rainfall and 13 receiving deficient
rainfall (Chart I.1).
I.2.6 According to the IMD, although none of the sub-divisions
experienced severe drought conditions (seasonal rainfall deficiency exceeding
50 per cent), Himachal Pradesh, West Uttar Pradesh, Punjab, West Rajasthan,
Vidarbha and Telangana experienced moderate drought conditions (seasonal rainfall
deficiency between 25 and 50 per cent). Among the broad regions, North-West
India was severely affected with the seasonal rainfall deficiency
of 22 per cent followed by South Peninsula (15 per cent), Central
India (11 per cent) and North-East India (six per cent). Of the 524 meteorological
districts, 25 per cent of the districts experienced moderate drought, while
seven per cent of the districts experienced severe drought conditions at the
end of the season. During 2004, the total area of the sub-divisions experiencing
drought conditions was only 18 per cent and, therefore, it could not be classified
as an all-India drought year.
I.2.7 The progress of the monsoon during the North-East season
(October 1 to November 24, 2004) was initially satisfactory; however, it turned
below normal thereafter. Overall, the cumulative area-weighted rainfall during
October 1 to December 31, 2004 was 11 per cent below normal as compared with
nine per cent above normal during the corresponding period of the previous year.
I.2.8 An analysis of the trends in rainfall deficiency and
foodgrains production suggests a reduced dependence on the South-West monsoon
(which accounts for 80 per cent of rainfall in the year). The performance of
kharif production, however, depends critically on the progress of monsoon
during July (critical month of sowing season) as also its spatial and temporal
distribution and temperature conditions over the season. Illustratively, the
cumulative rainfall deficiency of 13 per cent during the South-West monsoon
in 2004 was, in fact, comparable with 1986. However, rainfall deficiency of
19 per cent during July 2004 far exceeded that in July 1986. Accordingly, the
decline in kharif foodgrains production during 2004-05 (12 per cent)
exceeded the fall in 1986-87 (6 per cent). Although the shor tfall in overall
foodgrains production during 2004-05 (4.1 per cent) turned out to be almost
the same as in 1986-87 (4.7 per cent), the decline in the index of overall agricultural
production during 2004-05 (around one per cent) was considerably lower than
in 1986-87 (around four per cent). This is attributable to the improved share
of rabi (from 44.1 per cent to 49.5 per cent) in the total foodgrains
production (Table 1.3).
Weather Insurance
I.2.9 Notwithstanding these recent developments, Indian agriculture
continues to depend on weather performance. In this context, imparting stability
to agriculture through measures of weather-proofing and protecting farm incomes
assumes significance, as it would lead to stability of increased output, increased
capital formation and enhanced productivity of Indian agriculture (Box I.2).
Table 1.3: Synoptic View of Drought Years
|
Deficient |
Cumula- |
Rainfall |
|
Production of Foodgrains |
|
Rainfall |
tive |
in July |
|
|
|
|
| |
|
|
Kharif |
Total |
Kharif |
Rabi |
|
Years |
Rainfall |
|
|
|
|
|
| |
|
|
|
|
|
|
| |
(% age deviation |
Decline (%) |
Share in |
| |
from normal) |
|
|
total (%) |
| |
|
|
|
|
|
|
|
1 |
2 |
3 |
4 |
5 |
6 |
7 |
| |
|
|
|
|
|
|
|
1972-73 |
-24 |
-31 |
-6.9 |
-7.7 |
60.4 |
39.6 |
|
1974-75 |
-12 |
-4 |
-12.9 |
-4.6 |
59.2 |
40.8 |
|
1979-80 |
-19 |
-16 |
-19.0 |
-16.8 |
57.7 |
42.3 |
|
1982-83 |
-14 |
-23 |
-11.9 |
-2.8 |
54.0 |
46.0 |
|
1986-87 |
-13 |
-14 |
-5.9 |
-4.7 |
55.9 |
44.1 |
|
1987-88 |
-19 |
-29 |
-7.0 |
-2.1 |
53.1 |
46.9 |
|
2002-03 |
-19 |
-49 |
-22.2 |
-17.9 |
50.2 |
49.4 |
|
2004-05 |
-13 |
-19 |
-11.6 |
-4.1 |
50.5 |
49.5 |
| |
|
|
|
|
|
|
|
Source :Economic Survey,2002-03; Agricultural Statistics at a
Glance, 2004, Ministry of Agriculture; India Meteorological
Department. |
Box I.2
Weather Insurance
There has been a growing interest into new approaches for linking credit to some form of weather insurance. A weather insurance provides cover against defined deviations from normal weather conditions, not just against extreme conditions like severe drought or flood. The weather-based index is designed to weight the more important periods of rainfall in the crop cycle. An agricultural producer can hedge his production risk by purchasing a contract that pays in the case rainfall falls below a certain threshold and thus share some of his risk exposure with markets. Applications of weather-based index insurance are in Canada which uses a rainfall index and temperature-heat units (in Alberta) for maize. A private milk company in Argentina offers a rainfall insurance contract to a milk producing cooperative. Recognising the importance of weather insurance, the International Finance Corporation (IFC) of the World Bank Group is working towards developing weather indices in developing countries.
Weather insurance scores over the traditional crop insurance schemes due to the ready availability of information on weather conditions. Banks and financial institutions can purchase such insurance to protect their portfolio against defaults. There are, however, challenges in developing weather insurance in developing countries as reliable historical data that would allow accurate pricing of the insurance are not available. Farmers may face basis risk if rainfall at weather stations is not highly correlated with rainfall at the individual far m. Furthermore, the degree of weather insurance will be dependent on the country circumstances and also on location within each country.
In India, a pilot weather insurance programme was introduced in Mahabubnagar district (Andhra Pradesh) by the World Bank in collaboration with the ICICI Lombard General Insurance Company. Krishna Bhima Samruddhi (KBS), a local area bank bought a bulk insurance policy from ICICI Lombard and sold individual insurance policies to over 200 groundnut and castor farmers. Besides, weather insurance has also been extended to 50 soya farmers in Madhya Pradesh through Pradan (a non-Government organisation) and to some paddy farmers in Aligarh (Uttar Pradesh) through an agri-business company. The Union Budget, 2004-05 recognised weather insurance as one of the promising tools of risk mitigation and proposed to introduce it on a trial basis through the Agricultural Insurance Company (AIC) in 20 rain gauge stations. Accordingly, the AIC introduced Varsha Bima, a rainfall based crop insurance scheme, as a pilot project during kharif 2004. In June, 2005 the scheme was redesigned and fine-tuned covering almost all major crops for implementation in 10 States.
References
1. Bryla E., Dana J. and Varagis U.P. (2004), ‘The Use of the Price and Weather Risk Management Instruments’, World Bank.
2. World Bank (2003), Piloting Weather Insurance in India, August.
Cropping Pattern
I.2.10 Indian agriculture is becoming increasingly unsustainable in terms of maintaining productivity levels and environmental balance. The cropping pattern is distorted in favour of rice and wheat (area under foodgrains production was 66 per cent, with rice and wheat alone constituting 37 per cent) while key components of the average consumption basket such as other cereals and pulses are being disfavoured. This distorted cropping pattern has stemmed basically from a skewed incentive structure embedded in agricultural pricing policies, particularly, Minimum Support Prices (MSPs). Analysis of the cropping pattern in the major States reveals that the cultivation of rice and wheat (rotation-wise) is concentrated heavily (more than 30 per cent of gross cropped area) in States like Punjab, Haryana and Uttar Pradesh. Furthermore, while States like West Bengal, Andhra Pradesh and Bihar were found to be predominantly rice growing States, Rajasthan and Bihar had 10 to 30 per cent of gross cropped area under wheat.
I.2.11 There has been a decline in the net sown area (from 143 million hectares in 1990-91 to about 141 million hectares in 2000-01) accompanied by slow vertical expansion (gross sown area, which was 186 million hectares in 1990-91 reached 188 million hectares in 2000-01). As there is little scope for increasing the area under cultivation, increased productivity can be realised only by way of enhancing the efficiency of resource use - land, water and fertiliser - and with diversification and post-harvest value addition (Box I.3).
Food Management
I.2.12 The total stocks of foodgrains with the Food Corporation of India (FCI) and the State agencies
Box I.3
Agro-Diversification and Food Processing: Better Promise for the Future
In recent years, rising incomes, urbanisation and globalisation have opened new vistas for diversification of agriculture. Crop diversification is viewed as a risk management strategy to shield the farmers from generally volatile agricultural prices. India is the world’s second largest producer of food. The food processing industry ranks fifth in size in the country and contributes over six per cent to GDP. It accounts for 13 per cent of the country’s exports and six per cent of the total industrial investment. The growth in employment in food processing sector is likely to be 1.25 per cent per year during the Tenth Plan period.
India, however, fares poorly in terms of value addition to its raw produce in food processing, accounting for only seven per cent of raw produce compared to as much as 188 per cent in the UK, 45 per cent in the Philippines and 23 per cent in China. The industry is dominated by small scale and unorganised sectors (75 per cent) with inadequate access to modern technology and network.
A draft National Food Processing Policy was formulated on January 3, 2005 and an approach paper on the proposed Processed Food Development Act was circulated. Development and promotion of area specific Agro-Food Parks for processing the products grown in those localities, creation of units processing a cluster of trans-seasonal produce, harmonisation of laws and standards and administering them through a single authority, rationalisation of tax structures, fiscal incentives and promotion of both direct and foreign investments have been the recommended objectives for the food processing sector.
The value addition of food products is expected to increase from the current seven per cent of raw produce to 35 per cent by 2025. Fruits and vegetables processing is expected to increase from the current level of two per cent to 25 per cent over the same period.
References
1. Government of India (2005), ‘Approach Paper on Development Act’, Ministry of Food Processing Industries, New Delhi.
2. —— (2005) , Draft Paper on National Food Processing Policy, Ministry of Food Processing Industries, New Delhi.
3. Mohan, Rakesh (2004), ‘Agricultural Credit in India: Status, Issues and Future Agenda’, Reserve Bank of India Bulletin, November.
stood at around 25.1 million tonnes as on July 1, 2005, around 18.0 per cent lower than a year ago.
I.2.13 The procurement of foodgrains (rice and wheat) during 2005-06 (up to July) was about 11 per cent lower than in the corresponding period of the previous year. The total offtake of foodgrains during 2005-06 (up to June) was lower by around 1.5 per cent. Offtake under the Targeted Public Distribution System (TPDS) recorded a decline of around 9.0 per cent while it increased by 50.5 per cent under Other Welfare Schemes (OWS). Offtake under Open Market Sales (OMS) remained negligible, reflecting the comfortable supply position in the country (Table 1.4).
I.2.14 Decentralisation of procurement of foodgrains has received considerable attention recently. The recent proposal in the Union Budget, 2005-06 to make procurement of foodgrains more cost-effective through decentralised procurement, especially in the non-traditional States, without impairing the present MSP-based procurement is an important step in that direction.
Industrial Performance
I.2.15 Real GDP growth originating from industry rose to 8.3 per cent - the highest growth after 1995-
96 - as the industrial recovery spread out and strengthened during 2004-05. Industrial activity was powered by the manufacturing sector. A congenial domestic investment climate, improvement in world output, a liberalised foreign direct investment (FDI) regime and surging manufacturing exports supported the buoyant performance of the manufacturing sector. Lower debt servicing costs also facilitated the strong performance of the manufacturing sector. Intensified competition has encouraged a process of consolidation and restructuring of the Indian industry in tune with global supply and demand conditions as integration with the global production gathers pace.
I.2.16 Growth in the Index of Industrial Production (IIP) accelerated from 7.0 per cent during 2003-04 to 8.2 per cent during 2004-05, led by the manufacturing sector (Chart I.2). The output of the electricity sector registered a marginal improvement during the year -both thermal and hydro power plants recorded better
Table 1.4: Management of Food Stocks
| |
|
|
|
|
|
|
|
|
(Million tonnes) |
| |
|
|
|
|
|
|
|
|
|
|
Month |
|
Opening |
Foodgrains |
|
Foodgrains Offtake |
Closing |
Norms |
| |
|
Stock |
Procurement |
|
|
|
|
Stock |
|
| |
|
|
|
PDS |
OWS |
OMS - |
Exports |
|
|
| |
|
|
|
|
|
Domestic |
|
|
|
| |
|
|
|
|
|
|
|
|
|
|
1 |
|
2 |
3 |
4 |
5 |
6 |
7 |
8 |
9 |
| |
|
|
|
|
|
|
|
|
|
|
2004 |
|
|
|
|
|
|
|
|
|
|
January |
|
25.0 |
3.5 |
2.4 |
0.9 |
0.2 |
0.4 |
24.0 |
16.8 |
|
February |
24.0 |
2.2 |
1.9 |
1.1 |
0.1 |
0.5 |
22.8 |
|
|
March |
|
22.8 |
2.1 |
2.5 |
1.2 |
0.1 |
0.4 |
20.6 |
|
|
April |
|
20.6 |
15.7 |
2.0 |
0.5 |
0.0 |
0.3 |
32.4 |
15.8 |
|
May |
|
32.4 |
3.0 |
2.3 |
0.6 |
0.0 |
0.1 |
32.3 |
|
|
June |
|
32.3 |
1.4 |
2.3 |
1.0 |
0.0 |
0.1 |
30.6 |
|
|
July |
|
30.6 |
0.5 |
2.4 |
1.0 |
0.0 |
0.1 |
27.2 |
24.3 |
|
August |
|
27.2 |
0.2 |
2.4 |
1.0 |
0.0 |
0.1 |
23.0 |
|
|
September |
23.0 |
0.2 |
2.5 |
1.0 |
0.0 |
0.1 |
20.3 |
|
|
October |
|
20.3 |
6.5 |
2.4 |
0.8 |
0.0 |
0.0 |
23.7 |
18.1 |
|
November |
23.7 |
2.7 |
2.4 |
0.6 |
0.0 |
0.0 |
21.8 |
|
|
December |
21.8 |
2.6 |
2.6 |
0.7 |
0.0 |
0.0 |
21.7 |
|
| |
|
|
|
|
|
|
|
|
|
|
2005 |
|
|
|
|
|
|
|
|
|
|
January |
|
21.7 |
3.9 |
2.7 |
0.8 |
0.0 |
0.0 |
21.5 |
16.8 |
|
February |
21.5 |
2.3 |
2.7 |
0.9 |
0.0 |
0.0 |
20.0 |
|
|
March |
|
20.0 |
1.7 |
2.6 |
1.7 |
0.0 |
0.0 |
18.0 |
|
|
April |
|
18.0 |
14.0 |
2.0 |
0.8 |
0.0 |
0.0 |
28.5 |
16.2 * |
|
May |
|
28.5 |
3.1 |
2.1 |
0.8 |
0.0 |
0.0 |
27.9 |
|
|
June |
|
27.9 |
0.9 |
2.0 |
1.5 |
0.0 |
0.0 |
25.1 |
|
|
July |
|
25.1 |
0.4 |
n.a. |
n.a. |
n.a. |
n.a. |
n.a. |
26.9 * |
|
n.a. : Not available. PDS : Public Distribution System. OWS : Other Welfare Schemes. OMS : Open Market Sales.
* : Minimum buffer stocks to be maintained as on April 1 and July 1 under New Buffer Stocking Policy with effect from March 29, 2005.
Note:Closing stock figures may differ from those arrived at by adding the opening stocks and procurement and deducting, offtake, as stocks
include coarse grains also.
Source:Ministry of Food, Consumer Affairs and Public Distribution, Government of India. |
performance. The mining sector performed well in the first
half of the year, but subsequently lost momentum due to slowdown in production
in some of the subsidiary companies of Coal India Limited.
Manufacturing Sector
I.2.17 The manufacturing sector recorded a growth of 9.0 per
cent during 2004-05. Machinery and equipment and chemicals and chemical products
largely led this robust growth. In terms of the two-digit classification, 15
out of 17 industry groups logged positive growth during the year as compared
with 12 groups during the previous year. Cotton textiles, jute and other vegetable
fibre textiles (except cotton), textile products (including wearing apparels)
and leather and fur products made a turnaround during 2004-05. The improved
performance of textile industry was largely led by domestic demand while exports
displayed a mixed trend. The growth in various segments of textiles and
garments is significant as
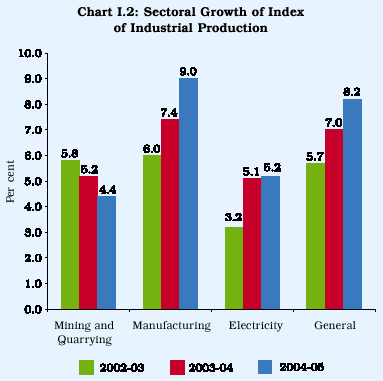
the sector needs to maintain its productive efficiency in order
to remain competitive in the post Multi-Fibre Arrangement (MFA) environment
(Box I.4).
I.2.18 Chemicals and chemical products benefited substantially
from double-digit growth in exports of dr ugs, phar maceuticals, fine chemicals
and organic/inorganic/agro chemicals as well as increased domestic demand. Rubber,
plastic and petroleum products, leather goods, footwear of leather and leather
garments received a stimulus from substantial expansion in export demand. Machinery
and equipment and metal products recorded a spurt in growth in an environment
of industrial resurgence, capacity addition and increase in global demand. High
growth of machinery and equipment was supported by rise
Box I.4
Textile Quota Phase-out Benefits
The Multi-Fibre Arrangement (MFA), which governed international
trade in textiles and clothing since 1974, came to an end in December 2004.
The MFA enabled developed nations, mainly the US, European Union and Canada
to restrict imports from developing countries through a system of quotas. Under
the MFA, there were about 1,300 bilateral quota restrictions inhibiting world
trade in the sector. The Word Trade Organisation’s Agreement on Textiles and
Clothing (ATC) in 1995 to abolish the MFA marked a significant turnaround in
global textile trade. The ATC mandated progressive phase-out of import quotas
and the integration of textiles and clothing into the multilateral trading system
before January 2005.
The share of textiles and garment exports in India’s total
exports works out to about 16 per cent. The US, the EU and Canada account for
nearly 70 per cent of India’s garments exports and 44 per cent of India’s textile
exports. Consequent upon the phasing out of the ATC, the textile sector is expected
to become another sunrise industry for India, given its high export potential.
India is expected to be the second largest beneficiary after China from world
trade in textiles and clothing. The Indian textiles and apparel industry can
achieve a potential size of US $ 85 billion by 2010 of which the domestic market
potential would be US $ 45 billion and export potential would be US $ 40 billion.
This optimistic scenario mainly emanates from India’s distinct advantages in
terms of competitive labour costs, availability of skilled manpower and strong
capabilities in certain areas of production involving expertise in styling and
designs.
Besides textile exports, India is expected to benefit from
increased outsourcing of textiles and apparel manufacturing. Having an integrated
textile industry - right from fibre to high-end fashion clothes - would also
work in India’s favour. The proactive measures announced in the Union Budget,
2005-06 and New Foreign Trade Policy 2004 paving the way for modernisation of
the Indian textile industry through a host of incentives, rationalisation of
tariff, allowing 100 per cent foreign direct investment (FDI) in textile sector,
dereservation of textile items from the SSI manufacturing, establishment of
Special Economic Zones (SEZs) and apparel parks would help the domestic industry
reap the benefits from the quota phase-out in the medium to long term. The removal
of quotas may not, however, directly provide easy and unrestricted access to
developed country markets. There would be non-tariff barriers arising from standards
related to health, safety, environment, quality and labour. Rapid proliferation
of regional trading arrangements (RTAs) also pose a threat to a country like
India, which is not a part of major RTAs. India’s textile and clothing sectors
would, therefore, have to show improvement in productivity, raw material base,
quality, cost of inputs, design skills and economies of scale in order to benefit
from a highly competitive environment in the post-MFA regime. Consolidation
of supply chains would play a key role in enhancing competitiveness of textiles.
For organised participants in this sector, technology, investment and export
infrastructure would play a lead role in driving improvements in quality and
productivity.
Although it is too early to make a realistic assessment with
regard to whether India has made durable gains after the phase-out of textile
quotas, data for the first half of 2005 since the textile quota phase-out suggest
substantial gains. According to the US Department of Commerce, India was the
second fastest growing textiles exporter to the US in January-June 2005, led
only by China. During January-June 2005, India’s textiles and apparel exports
to the USA increased by about 24.2 per cent (volume terms), which is higher
than other competitors such as Mexico, Indonesia, Thailand, Korea and the Philippines.
The surge in exports of Chinese textiles to the US and the EU has provoked
the US and the EU to impose safeguard measures, which would work to India’s
advantage as it closely competes with China.
References
1. Export-Import Bank of India (2005), ‘Textiles Export:
Post-MFA Scenario Opportunities and Challenges’, Research Brief, No.11, February.
2. International Monetary Fund (2005), World Economic Outlook, April.
3. Kathuria, Sanjay, Will Martin, and Anjali Bharadwaj (2001),
‘Implications for South Asian Countries of Abolishing the Multi-fibre Arrangement’,
World Bank, November.
4. Nordas, Hildegunn Kyvik (2004), ‘The Global Textile and
Clothing Industry Post the Agreement on Textiles and Clothing’, Discussion
Paper No. 5, WTO, Geneva.
in production of tractors, cooling towers, hydraulic machine/cylinders,
material handling equipments, control panels/boards/disks, switch boards/ protection
system, computer system and its peripherals, all of which recorded double-digit
growth during the year. The transport equipment sector was buoyed by increased
domestic sales and exports of passenger cars and commercial vehicles. On the
other hand, production of food products declined largely because of subdued
performance of sugar, milk products, wheat flour, malted food and tea. The performance
of wood and wood products, furniture and fixtures deteriorated into absolute
declines in production during the year (Chart I.3).
Use-Based Classification
I.2.19 In terms of the use-based classification, the consumer
goods sector recorded double-digit growth on the back of strong performance
of both durable and non-durable segments and contributed 42.9 per cent to the
overall IIP growth (Table 1.5). The growth of consumer durables emanated from
increased production of passenger cars, two-wheelers, wr ist watches and TV
receivers, facilitated by ease in the availability of finance. Intermediate
goods recorded a deceleration during the year, inter alia, due to decline
in production of petroleum refinery products.
I.2.20 One of the outstanding features of industrial activity during 2004-05
was the strong growth of
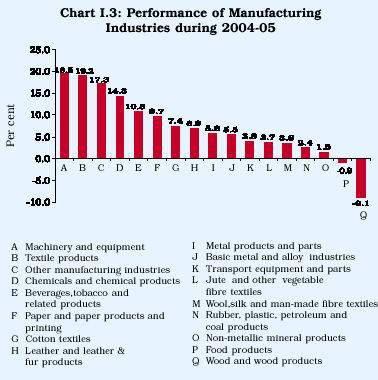
Table 1.5: IIP - Use-based Classification
| |
|
| |
|
|
|
(Per cent) |
| |
|
|
|
|
|
|
Sector |
Weight |
Growth Rate |
Weighted |
| |
|
|
|
Contribution |
| |
|
|
|
to IIP Growth |
| |
|
|
|
|
|
| |
|
2004- |
2003- |
2004- |
2003- |
| |
|
05 |
04 |
05 |
04 |
|
1 |
2 |
3 |
4 |
5 |
6 |
|
Basic Goods |
35.57 |
5.5 |
5.4 |
21.3 |
25.0 |
|
Capital Goods |
9.26 |
13.3 |
13.6 |
16.0 |
18.0 |
|
Intermediate Goods |
26.51 |
5.9 |
6.4 |
20.2 |
25.4 |
|
Consumer Goods |
28.66 |
11.5 |
7.1 |
42.9 |
31.0 |
|
Consumer Durables |
5.36 |
14.3 |
11.6 |
13.1 |
11.9 |
|
Consumer Non-durables |
23.30 |
10.6 |
5.8 |
29.6 |
19.2 |
|
Source: Central Statistical Organisation. |
the capital goods sector. Machinery and equipment led robust
growth of the capital goods sector. Expanding investment activity driven by
both domestic and external demand was reflected in higher capital expenditure
and capital goods imports, leading to increase in capacity creation across a
wide spectrum of industries. Non-electrical machinery contributed substantially
to the growth of capital goods imports. The imports of other capital goods such
as professional instruments, optical goods, electrical machinery, machine tools
and project goods also increased significantly. Current trends in corporate
finances suggest that Indian industry appears to be embarking on a new investment
cycle.
I.2.21 A comparative analysis of growth drivers during the
current growth phase (2002-05) and those in the high growth phase during 1993-96
captures the qualitative changes that have been taking place in the industrial
sector. The performance of basic, intermediate and consumer goods sector in
the current industrial rebound is not as strong as that of the earlier high
growth phase although growth in the consumer goods sector has picked up sharply
in the second half of 2004-05. Another significant feature of the recent industr
ial resurgence per tains to structural transformation of the industry. During
the current industrial rebound, the capital goods sector recorded double-digit
growth in 10 out of 12 quarters. In contrast, in the earlier high growth phase
(1993-96) the capital goods sector recorded not only single-digit growth in
most of the quarters but the growth was negative in some quarters. The strong
growth of the capital goods sector in the current phase suggests that Indian
industry is engaged in deepening capacities driven by sound economic fundamentals
and based on stringent assessment of market conditions. As opposed to this,
the earlier phase of industrial expansion was driven largely by capturing of
market share following the opening up of the economy.
I.2.22 Expenditure incurred by in-house Research and Development
(R&D) units in industry has steadily increased during the recent years.
A predominant part of R&D expenditure – about 80 per cent of the total during
2003-04 - is incurred by the private sector. The change in the patent regime
from process patenting to product patenting has significant implications for
industry (Box I.5).
Capacity Utilisation
I.2.23 Amidst favourable demand conditions, a positive investment
climate and industry-specific factors, capacity utilisation registered a modest
increase in seven out of the 17 industries comprising the manufacturing sector
at the two-digit level. Industries such as leather products (including fur),
rubber, plastic and coal products and jute and other fibre textile recorded
increases in capacity utilisation. Provisional estimates indicate that the overall
capacity utilisation of the industry increased from 82.7 per cent during 2003-04
to 83.1 per cent during 2004-05 (Table 1.6).
Competitiveness of Indian Industry
I.2.24 The diversification of the manufacturing sector along
with the vertical expansion of select industries suggests that Indian manufacturing
exports, in general, are increasingly becoming globally competitive (Box I.6).
However, India lags behind its major competitors in a number of industries mainly
because of higher input and material cost which erodes the advantage arising
Box I.5
Quality Consciousness : R&D Efforts in Indian Manufacturing Sector
In the increasingly knowledge-driven economy, quality consciousness
is an integral part of international competition, representing a new strategic
philosophy of enter prise towards the improvement of business performance and
competitiveness. New products, technologies and creative designs appear regularly
in the market as a result of continuous innovation and creativity, which needs
to be enhanced by increasing research and development (R&D). A few common
measures to enhance quality are Total Quality Management (TQM), Statistical
Process Control (SPC), Six Sigma or quality function deployment. There are three
main drivers that improve the quality of an organisation - quality planning
(business excellence), quality improvement (Six Sigma) and quality control (ISO
Standards). ISO standards assure a minimum standard of quality and do not provide
competitive advantage or assure the long-term strength of a business. Six Sigma
is a highly prescriptive approach for delivering quality in both the design
of products and ser vices and the work processes. TQM means consistently and
predictably producing what the customer wants - a never ending process of improving
the quality and not just an outcome. Six Sigma and SPC are part of TQM that
focuses on creating a process that delivers quality products.
In India, about 50 large companies have so far obtained ISO-9000 certification.
The Quality Council of India (QCI) was set up in 1997 as a joint initiative
of the Government of India and the Indian industry to promote, coordinate, guide
and implement a national quality initiative for building confidence in Indian
products and services and for improving the competitiveness of Indian industry.
During 1996-2002, India’s expenditure on R&D as a percentage
of GDP was 0.85 per cent as compared with 1.11 per cent for East Asia and Pacific,
and 2.36 per cent for the world. India’s R&D expenditure as a percentage
of GDP was, however, higher than other EMEs such as Malaysia, Mexico, Argentina
and Thailand.
India is identified as an emerging hub for outsourcing collaborative
R&D in drugs, biotechnology and chemicals. Investment in pharmaceutical
R&D has risen steadily from 2.0 per cent of the sector’s turnover in 1999-2000
to around 5.0 per cent in 2004-05. In anticipation of the new challenges, Indian
drugs and pharmaceutical companies have increased their R&D spending by
around 400 per cent during the last four years, shifting towards more in-house
innovative research rather than just copying drug molecules made by others.
India is trying to build a golden triangle between traditional medicine, modern
medicine and modern science, which holds great promise.
References
1. Government of India (2002), The Tenth Five Year Plan, Planning Commission,
New Delhi.
2. National Association of Software and Service Companies (2005), Indian
IT Industry - Fact Sheet, Mumbai.
3. World Bank (2005), World Development Indicators.
Table 1.6: Capacity Utilisation
| |
|
|
|
|
|
(Per cent) |
| |
|
|
|
|
|
|
|
Industry |
|
Weight |
Growth Rate of IIP |
Capacity Utilisation |
| |
|
|
|
|
|
|
| |
|
|
2004-05 |
2003-04 |
2004-05 |
2003-04 |
| |
|
|
|
|
|
|
|
1 |
|
2 |
3 |
4 |
5 |
6 |
| |
|
|
|
|
|
|
|
Manufacturing Industry |
|
793.58 |
9.0 |
7.4 |
81.4 |
81.0 |
|
Food products |
|
90.83 |
-0.9 |
-0.4 |
68.0 |
68.1 |
|
Beverages, tobacco and related |
products |
23.82 |
10.8 |
8.5 |
77.0 |
80.5 |
|
Cotton textiles |
|
55.18 |
7.4 |
-3.1 |
92.0 |
92.7 |
|
Wool, silk and man-made fibre textiles |
22.58 |
3.6 |
6.9 |
88.6 |
87.1 |
|
Jute and other vegetable fibre textiles |
5.90 |
3.7 |
-4.2 |
83.8 |
81.6 |
|
Textile products (including wearing apparel) |
25.37 |
19.2 |
-3.2 |
87.6 |
89.4 |
|
Wood and wood products, furniture & fixtures |
27.01 |
-9.1 |
6.8 |
81.7 |
86.2 |
|
Paper and products and printing, publishing |
26.52 |
9.7 |
15.6 |
85.5 |
89.9 |
|
Leather and leather and fur products |
11.39 |
6.9 |
-3.9 |
84.6 |
79.6 |
|
Basic chemicals and chemical products |
140.02 |
14.3 |
8.4 |
82.3 |
81.0 |
|
Rubber, plastic, petroleum and coal products |
57.28 |
2.4 |
4.5 |
86.6 |
84.0 |
|
Non-metallic mineral products |
|
43.97 |
1.5 |
3.7 |
86.9 |
87.9 |
|
Basic metal and alloy industries |
|
74.53 |
5.5 |
9.1 |
86.4 |
87.8 |
|
Metal products and parts |
|
28.10 |
5.8 |
3.4 |
71.1 |
72.3 |
|
Machinery and equipment |
|
95.65 |
19.5 |
15.8 |
76.0 |
74.6 |
|
Transport equipment and parts |
|
39.84 |
3.9 |
17.0 |
80.5 |
81.6 |
|
Other manufacturing industries |
|
25.59 |
17.3 |
7.7 |
82.9 |
69.0 |
|
Mining and Quarrying |
|
104.73 |
4.4 |
5.2 |
86.8 |
87.9 |
|
Electricity |
|
101.69 |
5.2 |
5.1 |
92.6 |
90.7 |
|
All Industries |
|
1000.00 |
8.2 |
7.0 |
83.1 |
82.7 |
| |
|
|
|
|
|
|
|
Note: 1. Capacity utilisation has been calculated from the production data for 299 industries supplied by the
Ministry of Statistics and Programme Implementation.
2. Capacity utilisation has been estimated using the peak output approach.
3. Data are provisional. |
from lower labour costs. India
accounts for a substantial part of global exports in respect of gems and jewellery
and textiles and garments. Refined petroleum products, pharmaceutical products,
iron and steel, leather products and chemical products have considerable export
potential.
Infrastructure Industries
I.2.25 The infrastructure sector
continued to remain subdued during 2004-05, mainly on account of deceleration
in output of finished steel, coal and petroleum refinery products. The growth
of the core infrastructure industries decelerated to 4.4 per cent from 6.2 per
cent in 2003-04 (Chart I.4).
I.2.26 Deceleration in production
of coal coupled with constraints in coal movement led to subdued electricity
generation and cement production during the last quarter of the year, dragging
down the overall infrastructure growth. Electricity generation, however, recorded
a marginal pick-up in growth on account of higher power generation in hydro
and thermal power plants during the first half of the year coupled with higher
plant load factor of 74.8 per cent in respect of thermal power plants. The production
of crude petroleum remained subdued on account of poor performance of private/joint
venture units. The shut-down of some refineries impacted the production of petroleum
refinery products. During the year, the finished steel sector recorded lacklustre
growth mainly due to supply constraints on inputs such as iron ore, scrapped
iron and coking coal (Chart I.5).
I.2.27 Besides finished steel,
some other infrastructure industries also fell short of the targets set for
2004-05. Passenger traffic of domestic as well as international civil aviation
sectors was below capacity notwithstanding significant growth. Fertiliser
Box I.6
Competitiveness of the Indian Manufacturing
Sector
Competitiveness is the degree to
which a nation can, under free trade and fair market conditions, produce goods
and services which meet the test of international mar kets while simultaneously
maintaining and expanding the real income of its people over the long term.
At the global level, there are two leading surveys which compare the competitiveness
of various countries on a regular basis, viz., Global Competitiveness
Report (World Economic Forum, Switzerland) and World Competitiveness Yearbook
(International Institute for Management Development, Lausanne, Switzerland).
In addition, the United Nations Industrial Development Organisation (UNIDO)
also ranks the competitiveness of the industrial sector of various economies.
The Global Competitiveness Report 2004 has ranked India 55th among
104 economies in ter ms of the Growth Competitiveness Index and 30th
in terms of Business Competitiveness Index.
According to recent inter national
repor ts on competitiveness , labour productivity growth in India has been better
than Australia, Germany, United Kingdom and United States. Wage rates in India
are much lower than Thailand, Singapore, the Philippines, Malaysia and Korea.
In terms of unit labour cost, India has a competitive edge over Singapore, Korea
and Malaysia. The unit labour cost in India is higher in food products, electrical
machinery and transport equipments as compared with some other emerging market
economies. India fares better than Hong Kong, Indonesia, and Malaysia, both
in terms of lower input costs and higher operating surplus, in the case of the
iron and steel industry. India leads in skill based manufacturing activity such
as ability to reengineer equipment at lower capital costs, innovative process
reengineering, availability of skilled technicians and quality mindset.
References
1. UNCTAD (2004), Handbook of Statistics
2004, The United Nations, New York and Geneva.
2. UNIDO Annual Report (2004), The United
Nations Industrial Development Organisation, Vienna, Austria.
3. World Bank (2004), India:
Investment Climate Assessment 2004 - Improving Manufacturing Competitiveness,
Finance and Private Sector Development Unit, South Asia Region.
4. World Economic Forum (2004), Global Competitiveness
Report, 2004-05, Switzerland.
production also remained below
target because of lacklustre performance by both public and private sector plants,
shortage of raw materials and natural gas in few plants and equipment related
problems.
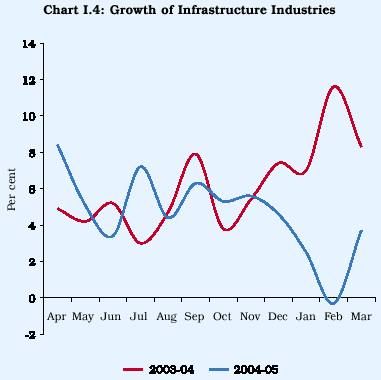
On the other hand, several infrastructure
industries, notably ports and petroleum refinery products (followed by coal,
crude petroleum, railways and power) exceeded the annual production targets
for
Table 1.7: Targets and Achievements of Infrastructure
Industries
|
Sector |
Unit |
|
2004-05 |
|
|
2003-04 |
|
| |
|
|
|
|
|
|
|
|
| |
|
|
Target |
Achievement |
Gap (%) |
Target |
Achievement |
Gap (%) |
| |
|
|
|
|
|
|
|
|
|
1 |
|
2 |
3 |
4 |
5 |
6 |
7 |
8 |
| |
|
|
|
|
|
|
|
|
|
1. |
Power |
Billion Units |
586 |
587 |
0.3 |
573 |
558 |
-2.5 |
|
2. |
Coal |
Million Tonnes |
365 |
377 |
3.3 |
345 |
356 |
3.1 |
|
3. |
Finished Steel |
Million Tonnes |
44 |
41 |
-7.6 |
37 |
39 |
5.2 |
|
4. |
Railways |
Million Tonnes |
600 |
602 |
0.3 |
550 |
557 |
1.3 |
|
5. |
Shipping (Major Ports) |
Million Tonnes |
362 |
384 |
6.1 |
334 |
345 |
3.3 |
|
6. |
Fertilisers |
Million Tonnes |
16 |
15 |
-6.0 |
16 |
14 |
-9.8 |
|
7. |
Cement |
Million Tonnes |
133 |
132 |
-1.1 |
126 |
124 |
-2.0 |
|
8. |
Crude Petroleum |
Million Tonnes |
33 |
34 |
2.5 |
33 |
33 |
-0.4 |
|
9. |
Petroleum Refinery Products |
Million Tonnes |
122 |
127 |
4.2 |
117 |
122 |
4.3 |
|
10. |
Civil Aviation (International)* |
Lakh No. |
17 |
15 |
-14.4 |
17 |
13 |
-24.9 |
|
11. |
Civil Aviation (Domestic)* |
Lakh No. |
25 |
24 |
-3.5 |
25 |
19 |
-21.9 |
| |
|
|
|
|
|
|
|
|
|
* : Refers to capacity in the column for 'Target'.
Source : Ministry of Statistics and Programme Implementation, Government of India. |
2004-05. The petroleum refinery sector could achieve its target on account of high capacity utilisation despite lower growth. Port traffic remained above the target, mainly due to higher exports of iron ore to China (Table 1.7).
Performance of Central Sector Projects
I.2.28 The Central Government started several new projects in steel, telecommunications, railways, power and petroleum sectors during 2004-05. The number of delayed projects rose during the year and cost overrun occurred, especially in railways and surface transport sectors (Table 1.8). Delays in the sanctioning of funds owing to under-estimation of original cost, announcement of the projects without proper fund allocation, increase in the prices of equipment, problems relating to environmental safeguards, rehabilitation measures and land acquisition are some of the factors that have contributed to time over-run of the projects.
Mergers and Acquisitions
I.2.29 During 2004-05, there was a substantial growth of 75.5 per cent in the value of acquisitions in the industrial sector (Table 1.9). Mergers and acquisitions (M&As) were concentrated mainly in sectors like chemicals, non-metallic mineral products, computer software and mining. The telecommunications sector entered a consolidation phase with smaller players selling out to the larger ones. The high growth and steady revenue streams in the Information
Table 1.8: Performance of Central Sector Projects
| |
|
|
|
(No. of |
Projects) |
| |
|
|
|
|
|
| |
|
|
|
March |
|
| |
|
|
|
|
|
| |
|
|
2005 |
2004 |
2003 |
| |
|
|
|
|
|
|
1 |
|
|
2 |
3 |
4 |
| |
|
|
|
|
|
|
1. |
Ahead |
|
16 |
28 |
32 |
|
2. |
On Schedule |
65 |
73 |
77 |
|
3. |
Delayed |
125 |
112 |
95 |
|
4. |
Without O.D.C and D.O.C |
121 |
73 |
60 |
|
5. |
Total |
|
327 |
286 |
264 |
|
6. |
Cost Overrun of Delayed |
|
|
|
| |
Projects (Rs crore) |
25,388 |
26,689 |
27,674 |
|
7. |
Cost Overrun of Delayed |
|
|
|
| |
Projects (% of original cost) |
45.2 |
51.8 |
53.6 |
| |
|
|
|
|
|
|
O.D.C. :Original Date of Commissioning.
D.O.C. :Date of Commissioning.
Source :Ministry of Statistics and Programme Implementation,
Government of India. |
Technology Enabled Services (ITES) have also led to an increase in M&As. Against the backdrop of growing competitiveness of Indian firms, significant activity is expected to continue in the overseas acquisitions by Indian corporates.
Investment Climate
I.2.30 The overall investment climate during 2004-05 was buoyant as reflected in the investment intentions registered in Industrial Entrepreneurs Memoranda (IEMs) and Letters of Intent (LOI), and in the
Table 1.9: Mergers and Acquisitions Announced
| |
| |
|
|
|
|
|
|
|
| |
|
|
Total Acquisitions |
Mergers |
|
Period |
|
|
2004-05 |
2003-04 |
2004-05 |
2003-04 |
| |
|
No. |
Amount |
No. |
Amount |
No. |
No. |
| |
|
|
(Rupees |
|
(Rupees |
|
|
| |
|
|
crore) |
|
crore) |
|
|
| |
|
|
|
|
|
|
|
|
1 |
|
2 |
3 |
4 |
5 |
6 |
7 |
|
Q1 |
|
187 |
12,048 |
220 |
3,802 |
38 |
48 |
|
Q2 |
|
177 |
4,071 |
194 |
4,427 |
51 |
132 |
|
Q3 |
|
225 |
19,971 |
218 |
7,146 |
77 |
54 |
|
Q4 |
|
196 |
25,015 |
196 |
19,444 |
76 |
55 |
|
Total |
|
785 |
61,105 |
828 |
34,819 |
242 |
289 |
| |
|
|
|
|
|
|
|
|
Note:Deals include preferential allotments, buy-back of shares
and disinvestment proposals, amongst others.
Source:Centre for Monitoring Indian Economy. |
implementation of IEMs (Table 1.10). A significant investment revival is suggested by the ver y substantial increase in investment intentions registered in 2003-04 which further nearly doubled in 2004-05. The industries that performed well during the year such as metallurgical industries, chemicals, fuels, textiles, mechanical industries, electrical equipments and telecommunications attracted investment interest.
Small Scale Industries
I.2.31 Small scale industries (SSIs) continue to play a significant role in industrial activity (Table 1.11). The share of SSIs in the gross industrial value added in the economy is around 40 per cent. About 44 per cent of total manufactured exports are directly accounted for by the SSI sector.
Table 1.10: Industrial Investment Proposals
| |
|
|
IEMs |
LOI/DILs |
| |
|
|
|
|
|
|
Year |
|
No. of |
Proposed |
No. of |
Proposed |
| |
|
Proposals |
Investment |
Proposals |
Investment |
| |
|
|
(Rupees |
|
(Rupees |
| |
|
|
crore) |
|
crore) |
|
1 |
|
2 |
3 |
4 |
5 |
| |
|
|
|
|
|
|
2001-02 |
3,094 |
70,994 |
102 |
1,361 |
|
2002-03 |
3,178 |
80,824 |
60 |
332 |
|
2003-04 |
4,130 |
1,54,954 |
145 |
3,454 |
| |
|
|
|
|
|
|
2004-05 |
5,548 |
2,89,782 |
101 |
4,309 |
|
Cumulative |
57,866 |
14,94,514 |
4,019 |
1,15,445 |
|
(up to |
March |
|
|
|
|
|
2005) |
|
|
|
|
|
|
IEMs:Industrial Entrepreneurs Memoranda.
LOI:Letter of Intent.
Source:Department of Industrial Policy and Promotion , Ministry
of Commerce and Industry, Government of India.
DILs : Direct Industrial Licences. |
Table 1.11: Performance of Small Scale Industries
| |
| |
|
|
|
|
|
|
Item |
2004-05 |
2003-04 |
2002-03 |
2001-02 |
2000-01 |
| |
|
|
|
|
|
|
1 |
2 |
3 |
4 |
5 |
6 |
| |
|
|
|
|
|
|
No. of Units |
|
|
|
|
|
|
(million) |
11.86 |
11.40 |
10.95 |
10.52 |
10.11 |
|
Value of Output |
|
|
|
|
|
|
(Rs. crore) |
4,12,450 |
3,57,733 |
3,11,993 |
2,82,270 |
2,61,297 |
|
Employment |
|
|
|
|
|
|
(million) |
28.29 |
27.14 |
26.01 |
24.91 |
23.91 |
|
Exports from SSI |
|
|
|
|
|
(Rs. crore) |
n.a. |
n.a. |
86,013 |
71,244 |
69,797 |
|
n.a. : Not available.
Source : Ministry of Small Scale Industries, Government of India. |
I.2.32 During the first quarter of 2005-06, industrial production accelerated to 10.3 per cent on the back of a marked pick-up in growth in manufacturing and electricity sectors to 11.2 per cent and 7.6 per cent, respectively. An encouraging development in the manufacturing sector was the turnaround in food products, after a deceleration in growth in the past two years. The growth in the mining sector, however, decelerated to 4.5 per cent. According to the use-based classification, the capital goods sector maintained high growth suppor ted by strong perfor mance of machiner y and equipment, transport equipments and commercial vehicles. The consumer goods recorded a double-digit growth on the back of strong performance of both durable and non-durable segments. Basic goods also recorded higher growth during the first quarter. Intermediate goods sector, however, slowed down significantly, inter alia, due to a decline in production of petroleum products. The overall growth of core infrastructure industries during the first quarter of 2005-06 was lower at 5.5 per cent than 8.1 per cent during the corresponding period of 2004-05 although there are signs of a pick up. The slowdown was mainly a reflection of decline in crude petroleum and petroleum refinery production and deceleration in finished steel during April and May 2005.
I.2.33 The policy framework provides a conducive environment for an even stronger industrial sector performance. The New Foreign Trade Policy and the Union Budget 2005-06 have provided a host of incentives for the growth of industry as a whole. The CII-ASCON survey indicates that out of 134 sectors reporting production in 2004-05, 34 sectors recorded excellent growth of over 20 per cent, 43 sectors recorded a high growth of 10-20 per cent, 49 sectors registered a moderate growth of 0-10 per cent and eight sectors reported decline in production. The
Table 1.12: Sub-sectoral Performance of the Services Sector
| |
|
|
|
| |
|
|
|
|
|
|
(per cent) |
| |
|
|
|
|
|
|
|
|
Sub-sector |
|
Share in Services |
Growth Rate |
Relative Contribution to |
| |
|
Sector GDP |
|
|
Growth in Services |
| |
|
|
|
|
|
|
|
| |
|
2004-05 # |
2003-04* |
2004-05 # |
2003-04* |
2004-05 |
2003-04 |
|
1 |
|
2 |
3 |
4 |
5 |
6 |
7 |
|
Trade, Hotels, Transport and Communication |
46.3 |
45.1 |
11.4 |
11.8 |
59.7 |
58.4 |
|
Financing, Insurance, Real Estate and Business Services |
22.4 |
22.7 |
7.1 |
7.1 |
18.8 |
18.6 |
|
Community, Social and Personal Services |
22.4 |
23.0 |
5.9 |
5.8 |
15.9 |
15.6 |
|
Construction |
|
8.9 |
9.2 |
5.2 |
7.0 |
5.6 |
7.4 |
|
Services |
|
100.0 |
100.0 |
8.6 |
8.9 |
100.0 |
100.0 |
| |
|
|
|
|
|
|
|
|
# : Revised Estimates. * : Quick Estimates.
Source : Central Statistical Organisation. |
NCAER Business Confidence Index (BCI) stood at 144.1 for July
2005 which is the highest level attained since December 1995. According to the
Reserve Bank’s Industrial Outlook Survey, the Business Expectations Index for
July-September 2005 stood at 119.6 points, registering a decline of 1.1 per
cent over the previous quarter. The Dun & Bradstreet’s Composite Business
Optimism Index for the second quarter of 2005-06 recorded an increase of 5.6
per cent over the previous quarter.
Services Sector
I.2.34 The services sector remained the key driving force of
the economy in 2004-05 (Table 1.12). The growth of the services sector at 8.6
per cent was higher than the average growth of 7.5 per cent during the last
five years. The services sector’s contribution to GDP growth has been more than
50 per cent since 1997-98. The share of the services sector in the GDP at 57.6
per cent in 2004-05 was higher than in other developing countries as a group.
I.2.35 The robust performance of the services sector during
2004-05 was led mainly by ‘trade, hotels, transport and communication’, which
contributed around 60 per cent of the sector’s growth (Chart I.6). The strong
growth in the trade sector was on account of surge in exports and imports during
the year. Activity in the hotel industry improved significantly, aided by a
recovery in tourism, particularly in business and leisure travel. The transport
sector recorded a healthy growth during 2004-05 as reflected in the revenue
earning freight traffic by the railways (8.0 per cent), cargo handled at major
ports (11.3 per cent) and cargo handled (16.9 per cent) and passengers handled
(19.7 per cent) at five major airports. Growth in the production of commercial
vehicles (27.3 per cent) and in the number of cell phone connections (10.4
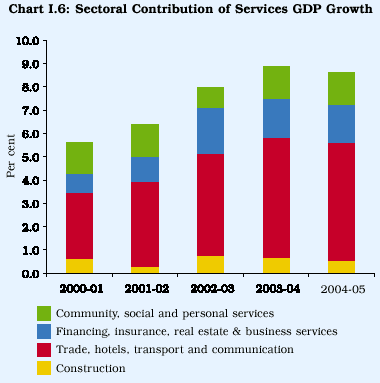
per cent) during 2004-05 also strengthened the services sector.
Growth in the finance and insurance sector was facilitated by strong expansion
in non-food credit coupled with increase in bank deposits, increase in Government’s
revenue expenditure and also surge in insurance business by public and private
insurance companies. However, the construction sector witnessed a deceleration
during the year mainly due to higher steel and cement prices. The recent policy
initiatives towards liberalisation of FDI in the construction sector would have
a positive impact on this sector.
I.2.36 The most visible dimension of the sustained growth in
the services sector has been the contribution of the software sector, including
ITES and BPO segments. According to the National Association of Software and
Services Companies (NASSCOM), the total revenues (exports as well as domestic)
of the Indian IT-ITES industry grew by 32 per cent to US $ 22 billion during
2004-05, constituting 3.0 per cent of GDP. This was on account of rapid growth
in demand from overseas and domestic consumers, backed by technological advancement
and proactive policy reforms such as deregulation, privatisation, opening up
to FDI and generous tax incentives for the sector. In addition to revenue earnings,
employment in the IT-ITES sector increased exponentially from 280,000 people
in 1999-2000 to 1.05 million people in 2004-05 - a compound annual growth rate
of 29.8 per cent.
AGGREGATE DEMAND
I.2.37 Information on the constituents of aggregate demand
is available only up to 2003-04 from the Central Statistical Organisation (CSO).
A strong pick-up in real private consumption demand in 2003-04 was accompanied
by a rise in Government demand - consumption as well as investment. In particular,
public investment registered a sharp acceleration, whereas private investment
experienced deceleration from exceptionally high growth in 2002-03 (Table 1.13).
Saving and Capital Formation
I.2.38 The rate of Gross Domestic Saving (GDS), as a proportion
to GDP at current market prices, increased substantially from 26.1 per cent
in 2002-03 to 28.1 per cent in 2003-04, reflecting improvement across all the
sectors. The household sector continued to be the major contributor to GDS with
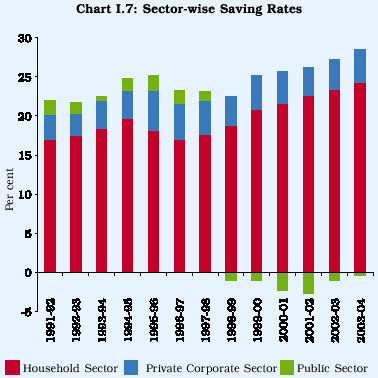
its saving rate placed at 24.3 per cent in 2003-04 as compared
with 23.3 per cent in 2002-03 (Chart I.7). Since 2000-01, the household sector
has shown a preference for saving in the form of physical assets relative to
financial assets. This could be attributed partly to the soft interest rate
regime in recent years. Private corporate saving, which has been increasing
steadily since 2001-02 reflecting strong growth in profits, stood at 4.1 per
cent in 2003-04. The rate of dis-saving of the public sector continued to decline
and contracted to 0.3 per cent in 2003-04 from 1.1 per cent in 2002-03 on account
of significant improvement in the performance of public authorities.
Table 1.13: Growth in Select Sources of Real Effective Demand #
| |
|
|
|
|
| |
|
|
|
|
|
|
|
|
|
|
(Per cent) |
| |
|
|
|
|
|
|
|
|
|
|
|
|
Item |
|
|
|
2003-04* |
2002-03@ |
2001-02 |
2000-01 |
1999-00 |
1997-98 to 1999-00 |
| |
|
|
|
|
|
|
|
|
|
|
|
|
1 |
|
|
|
|
2 |
|
3 |
4 |
5 |
6 |
7 |
| |
|
|
|
|
|
|
|
|
|
|
|
|
1. |
Total Final Consumption Expenditure |
|
|
7.4 |
|
2.0 |
5.6 |
2.1 |
7.2 |
6.3 |
| |
Of which : |
|
|
|
|
|
|
|
|
|
| |
|
Private Final Consumption |
|
|
8.1 |
|
2.9 |
6.1 |
2.5 |
6.1 |
5.2 |
| |
|
Government Final Consumption |
|
|
3.7 |
|
-2.4 |
3.1 |
0.5 |
13.2 |
12.4 |
|
2. |
Total Investment + |
|
|
13.8 |
|
17.4 |
-2.9 |
-1.4 |
20.8 |
9.7 |
| |
|
Private Investment ++ |
|
|
8.7 |
|
15.5 |
0.0 |
3.0 |
21.5 |
13.5 |
| |
|
Public Investment ++ |
|
|
10.0 |
|
-8.9 |
1.4 |
-7.2 |
13.3 |
6.6 |
|
3. |
Total Fixed Investment |
|
|
9.7 |
|
7.7 |
4.3 |
4.1 |
9.3 |
6.7 |
| |
Of which : |
|
|
|
|
|
|
|
|
|
| |
|
Private Fixed |
|
|
8.7 |
|
10.0 |
5.6 |
5.4 |
11.8 |
8.1 |
| |
|
Public Fixed |
|
|
13.1 |
|
0.4 |
0.3 |
0.4 |
2.7 |
3.1 |
| |
|
|
|
|
|
|
|
|
|
|
|
|
#:Based on select disposition of real GDP at market prices.
* : Quick Estimates.
@:Provisional Estimates.
+:Adjusted for errors and omissions.
++ : Unadjusted for errors and omissions.
Source : Central Statistical Organisation. |
Table 1.14: Gross Capital Formation(As percentage of GDP at current market prices)
|
Item |
2003-04* |
2002-03@ |
2001-02 |
| |
|
|
|
|
|
1 |
|
2 |
3 |
4 |
|
1. |
Household Sector |
13.0 |
13.0 |
11.4 |
|
2. |
Public Sector |
5.6 |
5.4 |
6.2 |
|
3. |
Private Corporate Sector |
4.5 |
4.3 |
4.6 |
|
4. |
Gross Domestic Capital |
|
|
|
| |
Formation (GDCF)# |
26.3 |
24.8 |
22.6 |
|
@: Provisional. * : Quick Estimates.
#: As GDCF is adjusted for errors and omissions, the sector-wise
capital formation figures may not add up to the GDCF.
Source : Central Statistical Organisation. |
I.2.39 The rate of Gross Domestic Capital Formation (GDCF) increased from 24.8 per cent in 2002-03 to 26.3 per cent in 2003-04 due to increases in both public and private corporate investments (Table 1.14).
Table 1.15: Household Saving In Financial Assets
| |
|
|
|
(Amount in Rupees crore)
|
| |
|
|
|
|
|
|
|
|
Item
|
|
|
|
2004-05#
|
2003-04P
|
2002-03P
|
| |
|
|
|
|
|
|
|
|
1
|
|
|
|
|
2
|
3
|
4
|
| |
|
|
|
|
|
|
|
|
A.
|
Financial assets (gross)
|
4,26,744
|
3,86,509
|
3,22,583
|
| |
|
|
|
|
(13.7)
|
(14.0)
|
(13.1)
|
| |
1.
|
Currency
|
|
39,075
|
40,759
|
28,632
|
| |
|
|
|
|
(1.3)
|
(1.5)
|
(1.2)
|
| |
|
|
|
|
[9.2]
|
[10.5]
|
[8.9]
|
| |
2.
|
Deposits@
|
|
1,68,225
|
1,60,621
|
1,31,910
|
| |
|
|
|
|
(5.4)
|
(5.8)
|
(5.4)
|
| |
|
|
|
|
[39.4]
|
[41.6]
|
[40.9]
|
| |
3.
|
Claims on Government
|
1,02,514
|
78,083
|
56,087
|
| |
|
|
|
|
(3.3)
|
(2.8)
|
(2.3)
|
| |
|
|
|
|
[24.0]
|
[20.2]
|
[17.4]
|
| |
4.
|
Investment in shares and
|
4,672
|
488
|
5,504
|
| |
|
debentures+
|
|
(0.2)
|
(0.0)
|
(0.2)
|
| |
|
|
|
|
[1.1]
|
[0.1]
|
[1.7]
|
| |
5.
|
Contractual saving**
|
1,12,258
|
1,06,557
|
1,00,450
|
| |
|
|
|
|
(3.6)
|
(3.9)
|
(4.1)
|
| |
|
|
|
|
[26.3]
|
[27.6]
|
[31.1]
|
| |
|
|
|
|
|
|
|
|
B.
|
Financial liabilities
|
1,18,639
|
71,547
|
60,305
|
| |
|
|
|
|
(3.8)
|
(2.6)
|
(2.4)
|
| |
|
|
|
|
|
|
|
|
C.
|
Saving in financial assets
|
3,08,105
|
3,14,961
|
2,62,278
|
| |
(Net)
|
(A-B)
|
|
(9.9)
|
(11.4)
|
(10.6)
|
| |
|
|
|
|
|
|
|
|
#: Preliminary; P : Provisional
@: Comprise bank deposits, non-bank deposits and trade debt
(net).
+: Including units of Unit Trust of India and other Mutual Funds.
**: Comprise Life Insurance, Provident and Pension Funds.
Note :1.Componentsrounding
2.Figures in ( ) indicate per cent of GDP at current market
prices and [ ] indicate per cent of financial assets (gross).
may not add up to the totals due to off.
|
I.2.40 Preliminary estimates, based on the latest available information, place the rate of financial saving (net) of the household sector in 2004-05 at 9.9 per cent of GDP at current market prices as compared with the revised estimates of 11.4 per cent in 2003-04 (Table 1.15 and Appendix Table I.14). Increases in the rate of saving in the form of claims on Government (particularly, small savings) and investment in shares and debentures were more than offset by decline in saving in the form of currency, deposits and contractual saving. Financial liabilities of the household sector registered a sharp increase due to higher loans and advances principally driven by personal loans to finance consumer durables and increased demand for housing loans.
III. MONEY, CREDIT AND PRICES
I.3.1 The evolution of monetary conditions during 2004-05 reflected the impact of a number of developments. First, capital flows continued to be strong, despite a lull during May-October, 2004 and liquidity conditions, given the overhang of over Rs.81,000 crore at the beginning of the year, remained easy. With the persistence of capital flows, the Reserve Bank continued with sterilisation operations through the Liquidity Adjustment Facility (LAF) and the newly-introduced Market Stabilisation Scheme (MSS), which contained money supply within the indicative projection set in May, 2004. Second, there was a robust expansion in credit demand which firmed up since July 2004. Third, the surge in banks’ non-food credit operations was accommodated by a reduction in the Government’s borrowing programme. Four th, movements in inflation driven by international commodity prices engaged policy attention as an overriding priority. In order to rein in inflation, fiscal measures were initiated to contain the pass-through of the increases in international oil and non-oil commodity prices to domestic inflation, in conjunction with monetary policy actions to modulate monetary and liquidity conditions and prudent supply management. These calibrated policy responses were able to return inflation from a spike in end-August 2004 to 5.1 per cent by the year end, consistent with the projection made in the May 2004 Annual Policy Statement.
RESERVE MONEY
I.3.2 Reserve money growth decelerated to 12.1 per cent during 2004-05 from 18.3 per cent during 2003-04 (Appendix Tables I.15 and I.16). Even as capital flows remained sizeable, base money expansion could be
|