|
Table 1.14: Gross Capital Formation(As percentage of GDP at current market prices)
|
Item |
2003-04* |
2002-03@ |
2001-02 |
| |
|
|
|
|
|
1 |
|
2 |
3 |
4 |
|
1. |
Household Sector |
13.0 |
13.0 |
11.4 |
|
2. |
Public Sector |
5.6 |
5.4 |
6.2 |
|
3. |
Private Corporate Sector |
4.5 |
4.3 |
4.6 |
|
4. |
Gross Domestic Capital |
|
|
|
| |
Formation (GDCF)# |
26.3 |
24.8 |
22.6 |
| |
|
|
|
|
|
@: Provisional. * : Quick Estimates.
#: As GDCF is adjusted for errors and omissions, the
sector-wise capital formation figures may not add up to the
GDCF.
Source : Central Statistical Organisation. |
I.2.39 The rate of Gross Domestic Capital Formation (GDCF) increased from 24.8 per cent in 2002-03 to 26.3 per cent in 2003-04 due to increases in both public and private corporate investments (Table 1.14).
Table 1.15: Household Saving In Financial Assets
| |
| |
|
|
|
|
(Amount in Rupees crore) |
| |
|
|
|
|
|
|
|
|
Item |
|
|
|
2004-05# |
2003-04P |
2002-03P |
| |
|
|
|
|
|
|
|
|
1 |
|
|
|
|
2 |
3 |
4 |
| |
|
|
|
|
|
|
|
|
A. |
Financial assets (gross) |
4,26,744 |
3,86,509 |
3,22,583 |
| |
|
|
|
|
(13.7) |
(14.0) |
(13.1) |
| |
1. |
Currency |
|
39,075 |
40,759 |
28,632 |
| |
|
|
|
|
(1.3) |
(1.5) |
(1.2) |
| |
|
|
|
|
[9.2] |
[10.5] |
[8.9] |
| |
2. |
Deposits@ |
1,68,225 |
1,60,621 |
1,31,910 |
| |
|
|
|
|
(5.4) |
(5.8) |
(5.4) |
| |
|
|
|
|
[39.4] |
[41.6] |
[40.9] |
| |
3. |
Claims on Government |
1,02,514 |
78,083 |
56,087 |
| |
|
|
|
|
(3.3) |
(2.8) |
(2.3) |
| |
|
|
|
|
[24.0] |
[20.2] |
[17.4] |
| |
4. |
Investment in shares and |
4,672 |
488 |
5,504 |
| |
|
debentures+ |
(0.2) |
(0.0) |
(0.2) |
| |
|
|
|
|
[1.1] |
[0.1] |
[1.7] |
| |
5. |
Contractual saving** |
1,12,258 |
1,06,557 |
1,00,450 |
| |
|
|
|
|
(3.6) |
(3.9) |
(4.1) |
| |
|
|
|
|
[26.3] |
[27.6] |
[31.1] |
| |
|
|
|
|
|
|
|
|
B. |
Financial liabilities |
1,18,639 |
71,547 |
60,305 |
| |
|
|
|
|
(3.8) |
(2.6) |
(2.4) |
| |
|
|
|
|
|
|
|
|
C. |
Saving in financial assets |
3,08,105 |
3,14,961 |
2,62,278 |
| |
(Net) |
(A-B) |
|
(9.9) |
(11.4) |
(10.6) |
| |
|
|
|
|
|
|
|
|
#: Preliminary; P : Provisional
@: Comprise bank deposits, non-bank deposits and trade debt (net).
+: Including units of Unit Trust of India and other Mutual Funds.
**: Comprise Life Insurance, Provident and Pension Funds.
Note :1. Components may not add up to the totals due to rounding off.
2.Figures in ( ) indicate per cent of GDP at current market prices and [ ] indicate
per cent of financial assets (gross). |
I.2.40 Preliminary estimates, based on the latest available information, place the rate of financial saving (net) of the household sector in 2004-05 at 9.9 per cent of GDP at current market prices as compared with the revised estimates of 11.4 per cent in 2003-04 (Table 1.15 and Appendix Table I.14). Increases in the rate of saving in the form of claims on Government (particularly, small savings) and investment in shares and debentures were more than offset by decline in saving in the form of currency, deposits and contractual saving. Financial liabilities of the household sector registered a sharp increase due to higher loans and advances principally driven by personal loans to finance consumer durables and increased demand for housing loans.
III. MONEY, CREDIT AND PRICES
I.3.1 The evolution of monetary conditions during 2004-05 reflected the impact of a number of developments. First, capital flows continued to be strong, despite a lull during May-October, 2004 and liquidity conditions, given the overhang of over Rs.81,000 crore at the beginning of the year, remained easy. With the persistence of capital flows, the Reserve Bank continued with sterilisation operations through the Liquidity Adjustment Facility (LAF) and the newly-introduced Market Stabilisation Scheme (MSS), which contained money supply within the indicative projection set in May, 2004. Second, there was a robust expansion in credit demand which firmed up since July 2004. Third, the surge in banks’ non-food credit operations was accommodated by a reduction in the Government’s borrowing programme. Four th, movements in inflation driven by international commodity prices engaged policy attention as an overriding priority. In order to rein in inflation, fiscal measures were initiated to contain the pass-through of the increases in international oil and non-oil commodity prices to domestic inflation, in conjunction with monetary policy actions to modulate monetary and liquidity conditions and prudent supply management. These calibrated policy responses were able to return inflation from a spike in end-August 2004 to 5.1 per cent by the year end, consistent with the projection made in the May 2004 Annual Policy Statement.
RESERVE MONEY
I.3.2 Reserve money growth decelerated to 12.1 per cent during 2004-05 from 18.3 per cent during 2003-04 (Appendix Tables I.15 and I.16). Even as capital flows remained sizeable, base money expansion could be
contained due to greater manoeuvrability provided by the operationalisation of the MSS. The slower growth of reserve money in 2004-05 also reflected the base effect of the excess reserves built up on March 31, 2004 partly counterbalanced by the 50 basis points increase in the cash reserve ratio (CRR) in two stages during September-October 2004, which impounded around Rs.9,000 crore in the first round (Chart I.8). In addition, the remuneration on the banks’ eligible CRR balances was lowered from the Bank Rate (6.0 per cent) to 3.5 per cent.
I.3.3 Reserve money declined in the first quarter of the year mainly on account of MSS/LAF operations. Seasonal cash demand was largely funded by the draw down of the excess reserves built towards the end of 2003-04 (Rs.19,662 crore during March 26-31, 2004).
I.3.4 The monetary base continued to contract during the second quarter of 2004-05 as a result of capital outflows, along with an increase in the Government’s surplus cash balances with the Reserve Bank. A brief period of tight liquidity arising out of pressures from State Development Loans auctions, redemptions from mutual funds and the need to meet reserve requirements prompted the Reserve Bank to inject liquidity (Rs.5,000 crore) through the LAF on August 12, 2004. During the third quarter, the robust expansion in non-food credit off-take and a spurt in festival season currency demand exerted pressure on liquidity. Reserve money expanded sharply as the Reserve Bank injected daily net liquidity
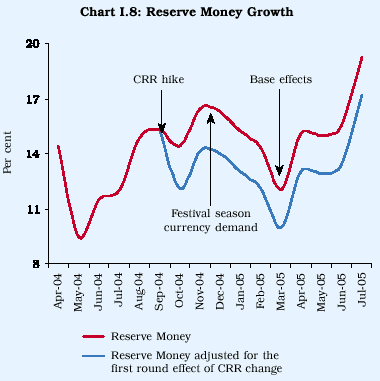
of over Rs.10,000 crore, on an average, during November 5-22, 2004 through the LAF and again (around Rs.3,500 crore daily, on an average) during December 20-24, 2004. During the fourth quarter, liquidity conditions turned comfortable, facilitated by large capital inflows and a decline in the Centre’s cash balances with the Reserve Bank. Reserve money increased by over Rs.34,000 crore (Table 1.16).
Table 1.16: Variation in Major Components and Sources of Reserve Money
| |
|
|
|
|
| |
|
|
|
|
|
|
|
|
|
(Rupees crore) |
| |
|
|
|
|
|
|
|
|
|
|
|
|
Item |
2004-05 |
2003-04 |
|
2004-05 |
|
|
2003-04 |
|
| |
|
|
|
Q4 |
Q3 |
Q2 |
Q1 |
Q4 |
Q3 |
Q2 |
Q1 |
|
1 |
|
2 |
3 |
4 |
5 |
6 |
7 |
8 |
9 |
10 |
11 |
|
Reserve Money |
52,623 |
67,451 |
34,173 |
31,547 |
-6,285 |
-6,812 |
45,363 |
23,980 |
-18,235 |
16,342 |
|
Components |
|
|
|
|
|
|
|
|
|
|
|
1. |
Currency in circulation |
41,633 |
44,555 |
15,015 |
16,467 |
-4,166 |
14,317 |
14,641 |
17,986 |
-5,955 |
17,882 |
|
2. |
Bankers’ Deposits with the RBI |
9,631 |
21,019 |
17,401 |
14,769 |
-2,874 |
-19,665 |
29,297 |
5,961 |
-12,633 |
-1,606 |
|
3. |
Other Deposits with the RBI |
1,359 |
1,877 |
1,756 |
311 |
755 |
-1,463 |
1,426 |
33 |
352 |
65 |
|
Sources |
|
|
|
|
|
|
|
|
|
|
|
1. |
RBI’s net credit to Government |
-62,882 |
-75,772 |
-22,744 |
184 |
-6,179 |
-34,143 |
-5,669 |
-12,506 |
-53,146 |
-4,451 |
| |
of which: to Central Government |
-60,177 |
-76,065 |
-25,852 |
203 |
-4,499 |
-30,029 |
-6,911 |
-15,844 |
-53,744 |
434 |
|
2. |
RBI’s credit to banks and commercial sector |
-833 |
-2,728 |
-835 |
3,726 |
-740 |
-2,985 |
2,156 |
-796 |
-2,525 |
-1,564 |
|
3. |
NFEA of the RBI |
1,28,377 |
1,26,169 |
44,651 |
31,462 |
-5,260 |
57,525 |
25,808 |
51,931 |
25,720 |
22,710 |
|
4. |
Government’s Currency Liabilities to the Public |
152 |
225 |
17 |
89 |
9 |
37 |
24 |
43 |
74 |
84 |
|
5. |
Net Non-Monetary Liabilities of the RBI |
12,191 |
-19,557 |
-13,084 |
3,915 |
-5,885 |
27,245 |
-23,044 |
14,692 |
-11,642 |
437 |
|
Memo: |
|
|
|
|
|
|
|
|
|
|
|
1. |
Net Domestic Assets |
-75,754 |
-58,719 |
-10,478 |
85 |
-1,025 |
-64,336 |
19,555 |
-27,951 |
-43,955 |
-6,368 |
|
2. |
FCA, adjusted for revaluation |
1,15,044 |
1,41,428 |
55,440 |
29,858 |
-3,413 |
33,160 |
48,093 |
37,560 |
31,832 |
23,943 |
|
3. |
Net Purchases from Authorised Dealers |
91,105 |
1,40,650 |
48,091 |
22,771 |
-9,789 |
30,032 |
47,845 |
40,669 |
29,899 |
22,237 |
|
4. |
NFEA/Reserve Money (per cent) (end-period) |
125.3 |
111.0 |
125.3 |
124.9 |
126.7 |
126.1 |
111.0 |
117.2 |
110.8 |
98.8 |
|
5. |
NFEA/Currency (per cent) |
166.2 |
148.1 |
166.2 |
160.7 |
159.2 |
158.8 |
148.1 |
146.8 |
138.1 |
126.8 |
|
6. |
Release (+)/ impounding (-) of lendable |
|
|
|
|
|
|
|
|
|
|
| |
resources due to change in CRR |
-9,000 |
3,500 |
0 |
-9,000 |
0 |
0 |
0 |
0 |
0 |
3,500 |
|
NFEA: Net Foreign Exchange Assets. FCA: Foreign Currency Assets.
Note: Data are based on March 31 for Q4 and last reporting Friday for all other quarters. |
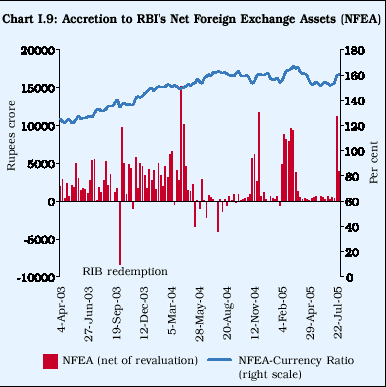
I.3.5 Foreign currency assets (adjusted for revaluation) of
the Reserve Bank increased by Rs.1,15,044 crore in 2004-05 on top of an accretion
of Rs.1,41,428 crore in 2003-04, albeit with higher intra-year variability
in 2004-05 (Chart I.9). As a result, the ratio of net foreign exchange assets
(NFEA) to currency as well as to reserve money increased further during the
year.
I.3.6 Consequent upon the operationalisation of the MSS in
April 2004, the Reserve Bank’s net credit to the Government declined by Rs.62,882
crore during 2004-05 on top of a decline of Rs.75,772 crore in the previous
year. This decline also reflected the improvement in the fiscal position of
the Government. The Centre, which had resorted to ways and means advances (WMA)
on several occasions till early September 2004, did not avail of WMA in the
subsequent period. States’ recourse to WMA/overdrafts was also lower in 2004-05
than in the previous year. The Reserve Bank’s support to the Government in the
primary market through private placement/devolvement was markedly lower (Table
1.17).
I.3.7 The substantial accretion to the Reserve Bank’s foreign
currency assets was reflected in rising MSS balances with the Reser ve Bank.
Table 1.17: Net Reserve Bank Credit to the Centre - Variations
| |
|
|
|
|
| |
|
|
|
|
|
|
|
|
(Rupees crore) |
| |
|
|
|
|
|
|
|
|
|
|
|
|
Item |
2004-05 |
2003-04 |
|
2004-05 |
|
|
2003-04 |
|
| |
|
|
|
|
|
|
|
|
|
|
|
| |
|
|
|
Q4 |
Q3 |
Q2 |
Q1 |
Q4 |
Q3 |
Q2 |
Q1 |
|
1 |
|
2 |
3 |
4 |
5 |
6 |
7 |
8 |
9 |
10 |
11 |
| |
|
|
|
|
|
|
|
|
|
|
|
|
Net Reserve Bank Credit to the |
|
|
|
|
|
|
|
|
|
|
|
Centre (1+2+3-4) |
-60,177 |
-76,065 |
-25,852 |
203 |
-4,499 |
-30,029 |
-6,911 |
-15,844 |
-53,744 |
434 |
|
1. |
Loans and Advances |
0 |
0 |
0 |
0 |
-3,222 |
3,222 |
0 |
0 |
-8,145 |
8,145 |
|
2. |
Reserve Bank's holdings of |
|
|
|
|
|
|
|
|
|
|
| |
Government Securities |
12,323 |
-72,230 |
-21,048 |
14,095 |
22,176 |
-2,900 |
398 |
-15,795 |
-45,530 |
-11,303 |
|
3. |
Reserve Bank's holdings of Rupee Coins |
58 |
20 |
-15 |
-93 |
-11 |
175 |
-24 |
-51 |
-68 |
163 |
|
4. |
Central Government Deposits |
72,558 |
3,856 |
4,791 |
13,799 |
23,443 |
30,525 |
7,287 |
-1 |
0 |
-3,430 |
| |
|
|
|
|
|
|
|
|
|
|
|
|
Memo* |
|
|
|
|
|
|
|
|
|
|
| |
|
|
|
|
|
|
|
|
|
|
|
|
1. |
Market Borrowings of Dated |
|
|
|
|
|
|
|
|
|
|
| |
Securities by the Centre # |
80,350 |
1,21,500 |
12,350 |
14,000 |
26,000 |
28,000 |
26,500 |
15,000 |
36,000 |
44,000 |
|
2. |
Reserve Bank's Primary |
|
|
|
|
|
|
|
|
|
|
| |
Subscription to Dated Securities |
1,197 |
21,500 |
350 |
0 |
847 |
0 |
16,500 |
0 |
0 |
5,000 |
|
3. |
Repos (+) / Reverse Repos (-) |
|
|
|
|
|
|
|
|
|
|
| |
(LAF), net position £ |
15,315 |
-32,230 |
-19,770 |
27,600 |
34,205 |
-26,720 |
-5,155 |
-3,580 |
-4,455 |
-19,040 |
|
4. |
Net Open Market Sales # |
2,899 |
41,850 |
1,172 |
871 |
427 |
429 |
5,332 |
14,225 |
16,671 |
5,620 |
|
5. |
Mobilisation under MSS |
64,211 |
0 |
11,602 |
353 |
14,444 |
37,812 |
0 |
0 |
0 |
0 |
|
6. |
Primary Operation |
-6,625 |
-100 |
23,490 |
-36,984 |
-30,484 |
37,353 |
4,560 |
2,305 |
-32,608 |
25,643 |
| |
|
|
|
|
|
|
|
|
|
|
|
|
* : At face value # : Excluding Treasury Bills £ : Including fortnightly repos
Note : 1. Quarterly variations are based on March 31 for Q4 and last reporting Fridays for other quarters.
2. Primary operation is defined as sum of loans and advances, RBI’s holding of rupee coins and primary subscription to
dated securities adjusted for Centre’s deposits with the RBI net of MSS balances and Centre’s surplus investment. |
Box I.7
Surplus Cash Balances of the Centre
In the context of the Reserve Bank’s function as banker to
the Central Government, the Government parks its funds with the Reserve Bank,
free of interest, under Sections 17(1) and 19(6) of the Reserve Bank of India
Act, 1934. The Central Government and the Reserve Bank reached an agreement
in 1997 under which the surplus funds of the Centre are invested in its own
paper. This arrangement of buy-back of its own securities effectively enables
the Central Government to obtain a notional return on such balances.
Surplus balances of the Government with the central bank have
been effectively used as an instrument of sterilisation in many countries. The
Government of Singapore, for example, issues Government securities in excess
of the fiscal requirements and parks the surplus funds with the Monetary Authority
of Singapore (MAS) as deposits, thus supplementing its draining operations.
Countries such as, Malaysia, Thailand and Indonesia have regulated excess
liquidity in the financial system by diver ting the Government/public sector
deposits from the commercial banking system to the central bank.
In the Indian context, the Reserve Bank’s Working Group on
Instruments on Sterilisation (Chairperson: Smt. Usha Thorat) observed that the
cost of sterilisation is ultimately borne by the fisc. In the light of reduction
in stock of the Government securities with the Reserve Bank, the Group was in
favour of revisiting the 1997 agreement so that the Government’s surpluses with
the Reserve Bank are not automatically invested and can remain as interest-free
balances with the Reserve Bank, thereby, releasing Government securities for
further sterilisation operations.
The Central Government has maintained sizeable sur plus balances
in its current account with the Reserve Bank almost continuously since August
2003, enabled, inter alia, by substantial inflows under the debt swap
scheme and increased issuance of Treasury Bills. In order to ensure a sizeable
stock of Government paper with the Reserve Bank for its monetary policy operations,
investment of the Central Government’s surplus cash balances in dated securities
was discontinued temporarily from April 8, 2004. Subsequently, with the introduction
of the MSS to absorb liquidity, investment of the Centre’s surplus balances
in its own paper held by the Reserve Bank was partially restored with a ceiling
of Rs.10,000 crore in June 2004 (enhanced to Rs.20,000 crore in October 2004).
Reference
1. Reserve Bank of India (2003), Report of the Working Group
on the Instruments of Sterilisation (Chairperson : Smt. Usha Thorat).
A build-up of the gilt portfolio with the Reserve Bank as a
result of the unwinding of LAF reverse repo balances was counterbalanced by
accretions to the Centre’s cash balances, which, in turn, were invested in the
Centre’s own paper held by the Reserve Bank (Box I.7).
Developments during 2005-06
I.3.8 The year-on-year reserve money expansion stood at 15.2
per cent as on August 12, 2005 –higher than that of 13.8 per cent recorded a
year ago. Despite a somewhat lower order of accretion to the Reserve Bank’s
NFA, the higher reserve money expansion largely reflected the effect of the
50 basis points increase in the CRR during September-October, 2004.
MONETARY SURVEY
I.3.9 Broad money (M3) growth at 12.2 per cent during 2004-05
was lower than that of 16.7 per cent in the previous year and well within the
projected trajectory of 14.0 per cent (Appendix Table I.17). The deceleration
in M3 reflected, in part, the base effect of higher deposit mobilisation by
commercial banks during the last quarter of the previous year (Chart I.10).
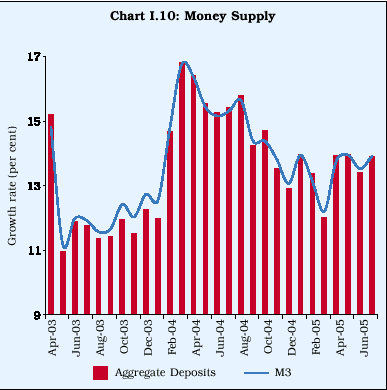
Table 1.18: Monetary Indicators
| |
|
|
|
|
|
|
|
| |
|
|
|
|
|
|
(Amount in Rupees crore) |
| |
|
|
|
|
|
|
|
|
|
|
Item |
|
|
|
Outstanding |
|
Variation |
|
|
| |
|
|
|
|
as on March |
|
|
|
|
| |
|
|
|
|
|
2004-05 |
2003-04 |
| |
|
|
|
|
31, 2005 |
|
|
|
|
| |
|
|
|
|
|
Amount |
Per cent |
Amount |
Per cent |
| |
|
|
|
|
|
|
|
|
|
|
1 |
|
|
|
|
2 |
3 |
4 |
5 |
6 |
| |
|
|
|
|
|
|
|
|
|
|
I. |
Reserve Money |
|
|
4,89,135 |
52,623 |
12.1 |
67,451 |
18.3 |
| |
|
|
|
|
|
|
|
|
|
|
II. |
|
|
) |
|
22,50,369 |
2,44,693 |
12.2 |
2,87,716 |
16.7 |
| |
Broad Money (M3 |
|
|
|
|
|
| |
a) |
Currency with the Public |
3,55,768 |
40,797 |
13.0 |
43,390 |
16.0 |
| |
b) |
Aggregate Deposits |
18,88,123 |
2,02,538 |
12.0 |
2,42,450 |
16.8 |
| |
|
i) |
Demand Deposits |
2,84,017 |
25,391 |
9.8 |
59,869 |
30.1 |
| |
|
ii) |
Time Deposits |
16,04,106 |
1,77,147 |
12.4 |
1,82,581 |
14.7 |
| |
|
|
of which: Non-Resident Foreign Currency Deposits |
76,405 |
802 |
1.1 |
-16,902 |
-18.3 |
|
III. |
|
|
|
|
22,06,919 |
2,46,733 |
12.6 |
3,18,644 |
19.4 |
| |
NM |
3 |
|
|
|
|
|
|
|
| |
|
of which: Call/Term Funding from Financial Institutions |
34,348 |
9,678 |
39.2 |
12,032 |
95.2 |
|
IV. |
a) |
|
|
|
22,95,566 |
2,63,992 |
13.0 |
3,34,757 |
19.7 |
| |
|
L1 |
|
|
|
|
|
|
|
| |
|
of which: Postal Deposits |
88,647 |
17,259 |
24.2 |
16,113 |
29.2 |
| |
b) |
|
|
|
22,97,217 |
2,59,398 |
12.7 |
3,34,705 |
19.7 |
| |
|
L2 |
|
|
|
|
|
|
|
| |
|
of which: FI Deposits |
1,651 |
-4,594 |
-73.6 |
-51 |
-0.8 |
| |
c) |
|
|
|
23,17,057 |
2,59,517 |
12.6 |
3,34,522 |
19.4 |
| |
|
L3 |
|
|
|
|
|
|
|
| |
|
of which: NBFC Deposits |
19,840 |
118 |
0.6 |
-184 |
-0.9 |
|
V. |
Major Sources of Broad Money |
|
|
|
|
|
| |
a) |
Net Bank Credit to the Government (i+ii) |
7,45,713 |
2,809 |
0.4 |
66,381 |
9.8 |
| |
|
i) |
Net Reserve Bank Credit to Government |
-17,975 |
-62,882 |
|
-75,772 |
|
| |
|
|
of which: to the Centre |
-23,258 |
-60,177 |
|
-76,065 |
|
| |
|
ii) |
Other Banks' Credit to Government |
7,63,687 |
65,691 |
9.4 |
1,42,153 |
25.6 |
| |
b) |
Bank Credit to Commercial Sector |
12,47,858 |
2,31,707 |
22.8 |
1,17,170 |
13.0 |
| |
|
of which: Scheduled Commercial Banks' Non-food Credit |
10,26,626 |
2,21,802 |
27.6 |
1,25,088 |
18.4 |
| |
c) |
Net Foreign Exchange Assets of the Banking Sector |
6,49,255 |
1,22,669 |
23.3 |
1,32,872 |
33.7 |
| |
|
|
|
|
|
|
|
|
|
|
FIs: Financial Institutions. NBFCs: Non-banking Financial Companies.
L1, L2, L3: Liquidity aggregates.
Note : 1.Data are provisional.
2.Select aggregates are adjusted for the effect of conversion of a non-banking entity into a
banking entity on October 11, 2004. |
I.3.10 The moderation in monetary expansion visà-vis the preceding year was also reflected in the residency-based new monetary aggregate (NM3), (which excludes the impact of foreign currency non-resident deposits) as well as in the liquidity aggregates (Appendix Tables I.18 and I.19). Banks’ non-resident foreign currency deposits registered a modest increase during 2004-05 after the decline due to redemption of Resurgent India Bonds (RIBs) in 2003-04. Postal deposits maintained high growth. Deposit mobilisation by financial institutions (FIs), on the other hand, continued to dwindle, par tially reflecting conversion of a financial institution into a bank. Public deposits with NBFCs stagnated, due to a reduction in the number of deposit taking NBFCs coupled with a shift towards relatively cheaper non-deposit sources of funds like secured debentures and other corporate borrowings (Table 1.18).
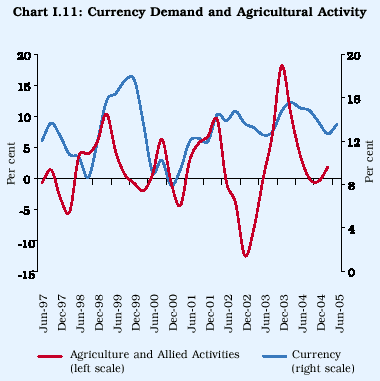
I.3.11 Currency demand moderated during the second half of 2004-05 reflecting a slowdown in agricultural activity and base effects of high currency growth during the second half of the previous year (Chart I.11).
I.3.12 Banks’ deposit growth decelerated, partly reflecting substitution in favour of postal deposits to take advantage of the dual benefit of tax incentives and the relatively attractive rate of return in comparison with banks’ fixed deposits (Chart I.12).
I.3.13 The abundance of liquidity in the system and easier access to relatively low-cost international markets during the year provided commercial banks with the incentive to mobilise funds through the non-deposit route, both at home and abroad. Reflecting these alternative avenues, banks’ term money borrowings from non-bank entities increased from Rs.24,670 crore at end-March 2004 to Rs.34,348 crore at end-March 2005. Similarly, borrowings from international markets by commercial banks rose from Rs.17,137 crore at end-March 2004 to Rs.25,666 crore at end-March 2005.
Sources of Money Supply
I.3.14 Domestic bank credit growth (including banks’ non-SLR investments) accelerated to 12.9 per cent during 2004-05 from 10.8 per cent during the previous year. The share of the Government in total domestic credit fell sharply to 35.7 per cent by end-March 2005 from 40.2 per cent at end-March 2004.
I.3.15 Net bank credit to the Government increased by only 0.4 per cent during 2004-05 mainly due to a lower than budgeted borrowing programme of the Centre. The sustained decline in the Reserve Bank’s net credit to the Government pushed the share of the banks in net bank credit to the Government to 102.4 per cent at end-March 2005 from 94.0 per cent at end-March 2004 and 37.1 per cent at end-March 1990. Commercial banks’ appetite for Government paper was moderated by the upturn in the interest rate cycle. Growth in investments of scheduled commercial banks in Government paper, at 7.9 per cent during 2004-05, was the lowest since 1985-86. Notwithstanding this deceleration, commercial banks’ holdings of Government securities, at 38.5 per cent of their net demand and time liabilities (NDTL) at end-March 2005, remained far in excess of the prescribed statutory minimum ratio of 25 per cent. Since the proceeds of the paper issued under the MSS to the banking system are parked with the Reserve Bank, the resultant increase in commercial banks’ investments in Government paper is counterbalanced by a reduction in the Reserve Bank’s net credit to the Government. Thus, the MSS is neutral to the size of the net bank credit to the Government, although there is a corresponding rebalancing of the shares of the Reserve Bank and commercial banks.
I.3.16 A notewor thy feature of monetar y developments during the year was the acceleration in bank credit to the commercial sector. In contrast to the decline of the previous two years, food credit registered a turnaround due to higher procurement operations. The pick-up in commercial banks’ non-food credit, which took root in July 2004, was sustained by the continued buoyancy in the industrial sector. Credit off-take from commercial banks, in fact, outpaced growth in deposits with the incremental credit-deposit ratio jumping up to 118.1 per cent during 2004-05 from 49.9 per cent during 2003-04 (Appendix Table I.20). Commercial banks’ non-SLR investments also recorded an increase. Reflecting the improvement in equity prices, there were switches in the banks’ non-SLR portfolio in favour of equities from PSU bonds (Table 1.19).
I.3.17 In addition to the surge in bank credit, industry also increased its recourse to non-bank sources of funds. Resources raised by way of external commercial borrowings (ECBs) increased, reflecting higher demand as well as attractive cost of external financing. The robust performance of the capital market encouraged corporates to mobilise funds through primary issues. Financial assistance extended by financial institutions, however, continued to dwindle. Improved cor porate profitability led to higher retained earnings which emerged as another important source of funds for corporates during 2004-05 (Table 1.20).
Table 1.19: Commercial Banks' Non-SLR Investments
| |
|
|
(Rupees crore) |
| |
|
|
|
|
|
Instrument |
Outstanding as at |
| |
|
|
end-March |
| |
|
|
|
|
| |
|
|
2005 |
2004 |
| |
|
|
|
|
|
1 |
|
|
2 |
3 |
|
1. |
Commercial Paper |
3,891 |
3,770 |
|
2. |
Units of UTI and other Mutual Funds |
12,623 |
11,808 |
|
3. |
Shares issued by |
13,426 |
9,696 |
| |
3.1 |
Public Sector Undertakings |
1,613 |
1,272 |
| |
3.2 |
Private Corporate Sector |
10,288 |
7,395 |
| |
3.3 |
Public Financial Institutions |
1,525 |
1,029 |
|
4. |
Bonds/debentures issued by |
1,13,695 |
1,12,370 |
| |
4.1 |
Public Sector Undertakings |
45,937 |
48,646 |
| |
4.2 |
Private Corporate Sector |
31,934 |
27,903 |
| |
4.3 |
Public Financial Institutions |
29,190 |
30,704 |
| |
4.4 |
Others |
6,633 |
5,118 |
|
Total (1+2+3+4) |
1,43,635 |
1,37,644 |
| |
|
|
|
|
|
Memo: |
|
|
|
|
Conventional Bank Credit |
10,68,771 |
8,15,728 |
| |
|
|
|
|
|
Note :Excluding Regional Rural Banks. Data include the
impact of conversion of a non-banking entity into a banking
entity since October 11, 2004. |
I.3.18 Sectoral deployment of bank credit indicates that the priority sector continued to be the largest recipient of gross bank credit (Table 1.21). This was essentially on account of a substantially higher offtake by the ‘other priority’ segment, representing primarily small housing loans (loans up to Rs.15 lakh; Rs.10 lakh prior to September 2004). Large housing loans (above Rs.15 lakh) also maintained strong growth. Low interest rates and fiscal incentives have boosted the demand for housing loans (Appendix Table I.22).
I.3.19 Credit to medium and large industries registered a sharp expansion, led by an increase in credit to power, telecommunications, roads and ports, petroleum, gems and jewellery, drugs and pharmaceuticals, textiles, iron and steel and other metal and metal products. Infrastructure, as a sector, continued to lead the credit demand, accounting for 37 per cent of the industrial credit during the year. Credit to roads and ports and the telecommunication sector, in particular, recorded a sharp increase. Petroleum credit increased in contrast to the decline in 2003-04, reflecting the incomplete pass-through of the increase in international crude oil prices to prices of domestic finished petroleum products. The higher credit to the gems and jewellery sector was driven by strong export demand (Appendix Table I.23).
Table 1.20: Key Sources of Funds to Industry
| |
|
| |
|
|
(Rupees crore) |
| |
|
|
|
|
|
Item |
|
2004-05 |
2003-04 |
| |
|
|
|
|
|
1 |
|
|
2 |
3 |
|
A. |
Bank Credit to Industry |
|
53,235 |
17,503 |
|
B. |
Flow from Non-banks to Corporates (1 to 5) 63,951 |
28,669 |
| |
1. Capital Issues * (i+ii) |
|
13,264 |
2,423 |
| |
i) Non-Government Public Ltd. |
|
|
| |
Companies (a+b) |
|
10,580 |
2,323 |
| |
a) Bonds/Debentures |
|
0 |
0 |
| |
b) Shares |
|
10,580 |
2,323 |
| |
ii) PSUs and Government Companies |
2,684 |
100 |
| |
2. ADR/GDR Issues + |
|
2,960 |
3,098 |
| |
3. External Commercial Borrowings |
|
|
| |
(ECBs) $ |
|
38,887 |
18,113 |
| |
4. Issue of CPs # |
|
4,108 |
2,312 |
| |
5. Financial assistance extended |
|
|
| |
by FIs (net) |
|
4,732 |
2,723 |
|
C. |
Retained Earnings@ |
|
28,589 |
15,870 |
|
D. |
Depreciation Provision@ |
|
21,094 |
19,327 |
|
Total Flow of Resources to Industry |
1,66,869 |
81,369 |
|
(A+B+C+D) |
|
|
|
|
*: Gross issuances excluding issues by banks and financial institutions. Figures are not
adjusted for banks' investments in capital issues, which are not expected to be significant.
+: Including Global Depository Receipts (GDRs)/American Depository Receipts (ADRs) and
Foreign Currency Convertible Bonds (FCCBs) excluding issuances by banks and financial
institutions.
$: Including short-term credit and adjusted for redemption of RIBs in October 2003.
#: Excluding issuances by financial institutions and banks' investments in CPs.
@: Data on retained earnings and depreciation for the year 2004-05 are based on abridged
results of 1273 non-financial non-Government companies. Retained earnings for 2004-05
have been taken as 60.4 per cent of net profit, the same ratio as during 2003-04.
Note : Data are provisional. |
I.3.20 In brief, monetary and liquidity conditions remained easy even though there was a sharp pick-up in demand for bank credit during 2004-05. In order to finance this step-up in credit demand, banks significantly scaled down their incremental investments in Government securities during the year. Reserve money growth during 2004-05 was lower than 2003-04 and money supply growth remained within the indicative trajectory set out in the Annual Policy Statement in May 2004.
Developments during 2005-06
I.3.21 On a year-on-year basis, growth in broad money (M3) decelerated to 14.5
per cent on August 5,
Table 1.21: Sectoral Deployment of Non-food Gross Bank Credit
| |
|
|
|
|
| |
|
|
|
(Amount in Rupees crore) |
| |
|
|
|
|
|
|
| |
|
Outstanding |
|
Variation |
|
|
| |
|
as at end- |
|
|
|
|
|
Sector |
|
2004-05 |
|
2003-04 |
|
| |
|
March 2005 |
|
|
|
|
| |
|
|
Amount |
Per cent |
Amount |
Per cent |
|
1 |
|
2 |
3 |
4 |
5 |
6 |
|
Non-food Gross Bank Credit |
9,31,466 |
2,03,044 |
27.9 |
1,08,367 |
17.5 |
|
of which: |
|
|
|
|
|
|
1. |
Priority sector |
3,45,627 |
81,793 |
31.0 |
52,225 |
24.7 |
|
2. |
Industry (Medium and Large) |
2,90,186 |
42,976 |
17.4 |
12,042 |
5.1 |
|
3. |
Housing |
75,173 |
23,192 |
44.6 |
15,394 |
42.1 |
|
4. |
Non-banking financial companies |
18,610 |
1,808 |
10.8 |
2,675 |
18.9 |
|
5. |
Wholesale trade |
33,814 |
8,947 |
36.0 |
2,289 |
10.1 |
|
6. |
Export Credit |
65,914 |
8,227 |
14.3 |
8,485 |
17.2 |
| |
|
|
|
|
|
|
|
Memo: |
|
|
|
|
|
|
Industry (Small, Medium and Large) |
3,66,300 |
53,235 |
17.0 |
17,503 |
5.9 |
|
of which: |
|
|
|
|
|
|
1. |
Infrastructure |
56,709 |
19,485 |
52.3 |
10,927 |
41.6 |
| |
i) Power |
26,973 |
7,318 |
37.2 |
4,613 |
30.7 |
| |
ii) Roads and Ports |
16,780 |
7,619 |
83.2 |
3,685 |
67.3 |
| |
iii) Telecommunication |
12,956 |
4,548 |
54.1 |
2,629 |
45.5 |
|
2. |
Iron and Steel |
29,025 |
2,730 |
10.4 |
-1,770 |
-6.3 |
|
3. |
Other Metal Products |
9,596 |
1,428 |
17.5 |
-388 |
-4.5 |
|
4. |
Cotton Textiles |
20,011 |
2,845 |
16.6 |
1,404 |
8.9 |
|
5. |
Petroleum |
14,618 |
2,352 |
19.2 |
-2,477 |
-16.8 |
|
6. |
Drugs and Pharmaceuticals |
10,674 |
2,007 |
23.2 |
775 |
9.8 |
|
Note : Data are provisional and relate to select scheduled commercial banks (SCBs)
which account for about 90 per cent of credit by all SCBs. |
2005 from 15.5 per cent a year earlier. The lower order of growth reflected mainly slower growth in time
M3 deposits. Demand deposits, however, recorded strong growth, mirroring a sustained pick-up in banks’ non-food credit. The slowdown in net bank credit to the Government helped in accommodating the surge in commercial credit.
SURVEY OF COMMERCIAL BANKING
I.3.22 Liquidity in the banking system remained comfortable throughout 2004-05 (Appendix Table I.21). The first quarter began with a large liquidity overhang in the system. This was augmented by strong time deposit mobilisation by commercial banks, even adjusted for the year-end bulge of March 2004. Banks’ mobilisation of non-deposit funds in the form of call-term funding from FIs and overseas borrowings was also significant. The commencement of the Government’s market borrowing programme and the introduction of the MSS got reflected in a beginning-of-the-year surge in commercial banks’ investment in Government securities. Commercial credit growth was high in contrast to the seasonal slack at the beginning of the year. Food credit picked up, reflecting high rabi procurement (Table 1.22).
I.3.23 During the second quarter, time deposits went through a seasonal downturn. Bank credit started picking up despite repayments of food credit, reflecting the strong growth in commercial credit. This was funded in part by a reduction in banks’ gilt portfolio.
I.3.24 Deposits continued to grow in the third quarter, although much lower than in the comparable quarter of the previous year. Credit to the commercial sector remained robust. The increase in food credit reflected higher procurement during the kharif season. Banks’ investments in non-SLR securities expanded, reflecting a surge in their equity investments following the rally in the stock market. Commercial banks’ net foreign currency assets recorded a decline due to higher overseas foreign currency borrowings. Banks’ investments in Government securities declined in an environment of continued growth in non-food credit, occasional tightness in market liquidity owing to a hike in the CRR, a temporary slack in capital inflows, advance tax payments and festival season currency demand.
I.3.25 Both demand and time deposits recorded a seasonal spurt during the fourth quarter. Strong FII inflows added liquidity to the banking system. The spur t in conventional non-food credit was supplemented by large investments in non-SLR securities. The Reserve Bank’s sterilisation operations were reflected in an increase in commercial banks’ holding of Government securities.
Table 1.22: Operations of Scheduled Commercial Banks
| |
|
|
|
|
|
|
|
| |
|
|
|
|
|
|
|
|
|
|
(Rupees crore) |
| |
|
|
|
|
|
|
|
Variation |
|
|
| |
|
|
|
Outstanding |
|
|
|
|
|
|
|
|
|
Item |
|
|
as on March |
|
2004-05 |
|
|
2003-04 |
|
| |
|
|
|
18, 2005 |
|
|
|
|
|
|
|
|
| |
|
|
|
|
Q4 |
Q3 |
Q2 |
Q1 |
Q4 |
Q3 |
Q2 |
Q1 |
|
1 |
|
|
|
2 |
3 |
4 |
5 |
6 |
7 |
8 |
9 |
10 |
|
Components |
|
|
|
|
|
|
|
|
|
|
|
1. |
Aggregate Deposits of Residents (a+b) |
16,23,793 |
78,251 |
38,447 |
21,232 |
57,050 |
82,201 |
60,326 |
32,455 |
65,483 |
| |
a. |
Demand Deposits |
|
2,48,028 |
17,604 |
15,280 |
2,277 |
-12,155 |
30,822 |
18,496 |
-5,950 |
11,366 |
| |
b. |
Time Deposits of Residents |
13,75,766 |
60,647 |
23,167 |
18,955 |
69,206 |
51,380 |
41,830 |
38,405 |
54,117 |
|
2. |
Call/Term Funding from Financial Institutions |
69,523 |
3,451 |
35,464 |
530 |
5,409 |
2,431 |
4,822 |
2,253 |
2,526 |
| |
|
|
|
|
|
|
|
|
|
|
|
|
|
Sources |
|
|
|
|
|
|
|
|
|
|
|
1. |
Credit to the Government |
7,18,982 |
39,632 |
-5,918 |
-9,546 |
40,056 |
32,133 |
18,342 |
45,333 |
35,534 |
|
2. |
Credit to the Commercial Sector (a to e) |
12,68,425 |
79,929 |
1,08,835 |
40,538 |
32,884 |
58,139 |
42,823 |
5,083 |
9,610 |
| |
a. |
Food Credit |
|
41,120 |
-2,659 |
5,590 |
-4,872 |
7,100 |
-391 |
-1,112 |
-12,601 |
587 |
| |
b. |
Non-food Credit |
|
10,59,308 |
75,210 |
1,01,812 |
46,477 |
30,985 |
57,819 |
48,992 |
15,186 |
3,091 |
| |
c. |
Net Credit to Primary Dealers |
1,447 |
125 |
-923 |
977 |
-678 |
-2,276 |
-4,649 |
-779 |
4,485 |
| |
d. |
Investments in Other Approved Securities |
20,172 |
-680 |
-1,232 |
-561 |
-184 |
-928 |
50 |
-407 |
-13 |
| |
e. |
Other Investments (in non-SLR Securities) |
1,46,377 |
7,933 |
3,587 |
-1,482 |
-4,339 |
3,915 |
-458 |
3,685 |
1,460 |
|
3. |
Net Foreign Currency |
Assets of |
|
|
|
|
|
|
|
|
|
| |
Commercial Banks (a-b-c) |
-75,980 |
-8,652 |
-3,172 |
904 |
-6,706 |
541 |
5,515 |
2,745 |
1,564 |
| |
a. |
Foreign Currency Assets |
26,091 |
-8,051 |
2,441 |
56 |
-2,741 |
4,250 |
-5,311 |
4,108 |
199 |
| |
b. |
Non-resident Foreign Currency Repatriable |
|
|
|
|
|
|
|
|
|
| |
|
Fixed Deposits |
|
76,405 |
692 |
-654 |
-189 |
953 |
319 |
-14,087 |
-1,273 |
-1,861 |
| |
c. |
Overseas Foreign Currency Borrowings |
25,666 |
-90 |
6,267 |
-658 |
3,012 |
3,391 |
3,261 |
2,636 |
496 |
|
4. |
Net Bank Reserves |
|
96,527 |
-1,267 |
14,151 |
-3,644 |
10,392 |
-1,199 |
6,394 |
-14,272 |
20,149 |
|
5. |
Capital Account |
|
1,33,688 |
3,423 |
9,435 |
1,393 |
14,884 |
7,280 |
-4,023 |
-2,088 |
15,555 |
|
6. |
Other items (net) |
|
1,80,949 |
24,517 |
30,550 |
5,098 |
-717 |
-2,299 |
11,951 |
6,269 |
-16,708 |
| |
|
|
|
|
|
|
|
|
|
|
|
|
|
Memo: |
|
|
|
|
|
|
|
|
|
|
|
1. |
Foreign Currency Loans to Residents |
46,543 |
-486 |
3,028 |
-1,796 |
2,089 |
2,812 |
6,255 |
-2,168 |
807 |
|
2. |
Release of Resources through Change in CRR |
– |
0 |
-9,000 |
0 |
0 |
0 |
0 |
0 |
3,500 |
|
3. |
Net Open Market Sales to Commercial Banks |
– |
0 |
0 |
0 |
0 |
445 |
9,334 |
8,250 |
4,266* |
| |
|
|
|
|
|
|
|
|
|
|
|
|
|
* : |
Variation over March 31. |
|
|
|
|
|
|
|
|
|
|
Note :1. Data relate to last reporting Friday of each quarter.
2. Data include the impact of mergers since May 3, 2002 in the banking system and conversion of a non-banking
entity into a banking entity since October 11, 2004. |
PRICE SITUATION
I.3.26 Inflation firmed up worldwide during 2004 as higher input demand emanating from global growth and the sustained expansion of the Chinese economy pushed up oil and non-oil commodity prices. Hardening international commodity prices as well as domestic food prices responding to a deficient monsoon fuelled a spurt in inflation in India during the second quarter of 2004-05. Inflation began to ease from September 2004 under the impact of a mix of fiscal measures to moderate the pass-through of imported inflation, monetary policy measures to stabilise inflation expectations, the waning of the impact of the SouthWest monsoon on agricultural commodity prices and the base effect of the sharp increase in prices in the last quarter of the preceding year.
Global Inflation Environment
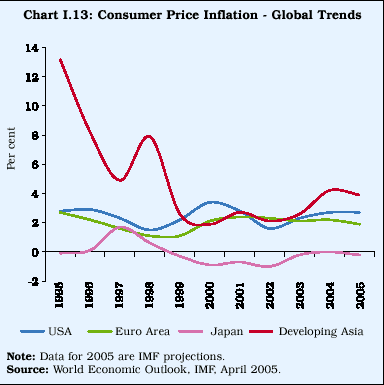
I.3.27 According to the International Monetary Fund’s World Economic Outlook, consumer price inflation in 2004 firmed up to 2.0 per cent in advanced economies after remaining below 2.0 per cent for two years in succession. Although inflation softened marginally in emerging market and developing countries to 5.7 per cent in 2004 from 6.0 per cent in the previous two years, developing Asia saw higher inflation at 4.2 per cent in 2004 (2.6 per cent in 2003), driven up by stronger economic activity and higher oil prices (Chart I.13).
I.3.28 Producer prices led consumer prices throughout the year. The increase in commodity prices was initially absorbed by firms in their profit margins, creating a wedge between producer and consumer prices in most economies. The persistence of increases in commodity prices and improvement in consumer demand generated some upward pressure on consumer prices. The possibility of easy monetary conditions fuelling asset prices and accommodating inflationary expectations led a number of central banks, including the US Federal Reserve,
to reverse their accommodative monetary policy stance through measured increases in policy rates (Table 1.23).
I.3.29 In the US, headline consumer price inflation accelerated during 2004, driven up by higher oil prices, a weakening of the US dollar and higher producer prices. In the Euro area, inflation, measured by the Harmonised Index of Consumer Prices (HICP), remained above the European Central Bank’s (ECB) target of about 2.0 per cent in the latter half of 2004, due to higher oil prices. In the UK, CPI inflation decreased marginally from 1.4 per cent in 2003 to 1.3 per cent in 2004 but picked up in the first half of 2005. Producer price inflation hardened in Japan fuelled by higher growth in the first half of the year and higher oil prices, pushing consumer price inflation into neutral and even positive territory in the last quarter of 2004. The continued expansion of the Chinese economy and the surge in oil costs drove producer prices in China to 5.2 per cent in June 2005. Consumer price inflation, however, decelerated to 1.6 per cent in June 2005 from 5.0 per cent a year ago due to a decline in foodgrains prices, limited pass-through of high oil prices as well as a moderation in monetary and credit expansion.
Global Commodity Prices
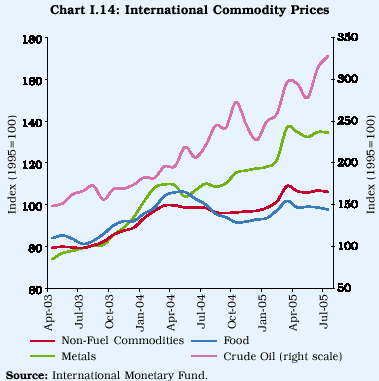
I.3.30 The international inflation scenario in 2004-05 was essentially dominated by the developments in the commodity markets, especially metals and crude oil (Chart I.14). Although the upsurge in the last quarter of 2003 continued up to the first half of 2004, non-oil commodity prices stabilised over the rest of 2004 at elevated levels. Due to the depreciation of the US dollar against major currencies, the increase in commodity prices in the international markets in US dollar terms was higher than in terms of the Euro or the Japanese Yen.
Table 1.23: Global Inflation Indicators
| |
|
|
|
|
|
|
|
| |
|
|
|
|
|
|
|
|
(Per cent) |
| |
|
|
|
|
|
|
|
|
|
|
Country/ |
Key Policy Rate/ |
|
Policy Rates |
2005 |
|
|
|
2004 |
|
Region |
Bank Reserves Target |
|
Latest@ |
Change |
Inflation |
GDP |
|
Inflation |
GDP |
| |
|
|
|
since |
(July) |
Growth |
|
|
Growth |
| |
|
|
|
January 2004 |
|
(Y-o-Y) |
|
|
(Y-o-Y) |
| |
|
|
|
(basis points) |
|
|
|
|
|
| |
|
|
|
|
|
(Q2) |
|
|
|
| |
|
|
|
|
|
|
|
|
|
|
1 |
2 |
|
3 |
4 |
5 |
6 |
|
7 |
8 |
| |
|
|
|
|
|
|
|
|
|
|
US |
Federal Funds Rate |
3.50 |
250 |
3.2 |
3.6 |
|
2.7 |
4.4 |
|
UK |
Repo Rate |
4.50 $ |
75 |
2.3 |
1.7 |
|
1.3 |
3.1 |
|
Euro Area |
Interest Rate on Main Refinancing Operations |
2.00 |
Unchanged |
2.2 |
1.2 |
|
2.2 |
2.0 |
|
Japan |
Target Balance of Current |
30-35 |
Raised by 3 |
|
|
|
|
|
| |
Accounts of banks with the Bank of Japan |
trillion yen |
trillion yen |
- 0.5 # |
1.4 |
|
0.0 |
2.6 |
|
Australia |
Cash Rate |
5.50 |
25 |
2.5 |
1.9 |
* |
2.3 |
3.2 |
| |
|
|
|
|
(Q2) |
|
|
|
|
|
New Zealand |
Official Cash Rate |
6.75 |
175 |
2.8 |
1.9 |
* |
2.3 |
5.0 |
| |
|
|
|
|
(Q2) |
|
|
|
|
|
Korea |
Overnight Call Rate |
|
3.25 |
(-) 50 |
2.5 |
3.3 |
|
3.6 |
4.6 |
|
Thailand |
14-day Repurchase Rate |
2.75 |
150 |
5.3 |
3.3 |
* |
2.7 |
6.1 |
| |
|
|
|
|
|
|
|
|
|
|
@ : As on August 19, 2005. # : June 2005. * : Q1.
$ : Repo rate was cut by 25 basis points to 4.50 per cent on August 4, 2005.
Source : IMF and websites of respective Central Banks. |
I.3.31 Prices of agricultural commodities, as a group, hardened in the first half of 2004, as bad weather damaged crop prospects in a number of countries. Rice prices remained firm amidst supply concerns, especially as the crop in the major South Asian producers was reported to be affected by bad weather. During the course of the year, prices of key commodities such as wheat and oilseeds began to soften because of a bumper crop in the 2004-05 season. Despite strong demand, prices of oilseeds and oilseed-based products declined substantially in the latter half of 2004-05, as oilseeds production increased by 12 per cent during the year on the back of a bumper soya crop in Argentina, Brazil, China and the US. In sharp contrast to the previous year, global cotton prices softened through 2004 with production catching up with rising demand. World sugar prices, however, rose by about 28 per cent, on an average, during 2004-05 due to higher demand from developing countries, exacerbated by a decline in Chinese production for the second consecutive year.
I.3.32 Fuel prices rose sharply in 2004-05 amidst nervous sentiments in world markets about strong demand associated with a pick-up in economic activity, oil supply bottlenecks, low inventories and tight spare capacity (Chart I.15). Average international crude oil prices increased by 41.8 per cent from US $ 29.1 a barrel in 2003-04 to US $ 41.3 a barrel in 2004-05. In spite of periodic increases in supply by the Organisation of the Petroleum Exporting Countries (OPEC), a combination of adverse events such as
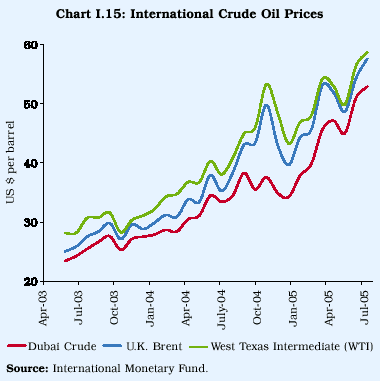
the effects of Hurricane Ivan on production sites along the Gulf of Mexico, financial difficulties of the major Russian producer, Yukos and a drop in US oil inventories on the eve of the winter season drove US crude oil prices to a high of US $ 55 per barrel in late October 2004. After a brief respite in November, crude prices resumed hardening and climbed above US $ 57 a barrel in early April, 2005 as the market discounted a further 0.5 million barrels a day increase in the OPEC output ceiling in March 2005 on the perception that most members were already producing at close to full capacity. Crude oil prices rose further to cross US $ 62 per barrel in early July 2005 notwithstanding the OPEC’s decision to further increase its production quota by 0.5 million barrels a day in its June 15, 2005 meeting as fears about hurricane-related supply disruptions in the Gulf of Mexico heightened. Notwithstanding forecasts of some deceleration in global oil demand in the rest of 2005, international oil prices continued to remain high and volatile, crossing US $ 67 a barrel on August 12, 2005 on concerns over stability of supplies from the Middle East and reports of slowdown in non-OPEC output.
I.3.33 Coal prices hardened in the first half of 2004-05 driven up by strong Chinese demand. Prices of metals, such as aluminium, copper, nickel, tin, steel and zinc hit multi-year peaks on the back of strong Chinese demand. The IMF’s metal price index rose by 30 per cent, on an average, in 2004-05. The World Bank’s composite index of steel products recorded an increase of 52 per cent during 2004-05.
I.3.34 In brief, the sharp rise in commodity prices in 2004-05 led to an increase in producers’ prices in most countries. However, there was not a commensurate increase in consumer price inflation as, due to competitive pressures, firms partly absorbed higher commodity costs into their profit margins. The resolve of monetary authorities to rein in inflationary expectations through measured policy responses also helped moderate the increase in consumer price inflation.
INFLATION CONDITIONS IN INDIA
Wholesale Price Inflation
I.3.35 Headline inflation, measured by year-on-year (y-o-y) changes in the wholesale price index (WPI), moved in two distinct phases during 2004-05 (Table 1.24). The first phase covering April-August, 2004 witnessed a hardening of domestic prices of coal, petroleum products, iron ore and metals, reflecting essentially lagged adjustments to international prices. Petroleum product prices were revised upward twice in the first phase, effective June 16 and August 1, 2004. Besides, coal prices were also raised by 16.3 per cent in June 2004. The situation was exacerbated by the inadequate and uneven South-West monsoon which began to push up prices of food and non-food agricultural commodities by July 2004. Although rice prices hardened marginally, jowar price rise accelerated to double digits by August on expectations of a sharp decline in output of coarse cereals. Potato prices also rose sharply in the first half of the year as the unseasonal rainfall affected the crop on top of a lean season in 2003-04. As a result, headline inflation climbed to a peak of 8.7 per cent by end-August 2004, more than half of which was due to iron ore, metals, mineral oil and coal. It is against this backdrop that the Mid-term Review of the Annual Policy Statement placed the inflation rate for 2004-05, on a point-to-point basis, at around 6.5 per cent as against 5.0 per cent projected at the beginning of the year.
I.3.36 Inflation receded in the second phase beginning September 2004 as the adverse impact of the South-West monsoon turned out to be far more limited than perceived initially. This was led by a sharp decline in the prices of vegetables following the revival of the monsoon in August 2004. With the receding of drought fears, prices of oilseeds, edible oils, raw cotton and cotton textiles began declining in line with international trends.
Table 1.24: Variation in Wholesale Price Index during 2004-05
| |
|
|
|
| |
|
|
|
| |
|
|
|
|
(Per cent) |
| |
|
|
|
|
|
|
Item |
|
Phase I |
Phase II |
Financial Year |
| |
|
(end-August |
(end-March |
(end-March |
| |
|
2004 over |
2005 over |
2005 over |
| |
|
end-March |
end-August |
end-March |
| |
|
|
2004) |
2004) |
2004) |
| |
|
|
|
|
|
|
1 |
|
|
2 |
3 |
4 |
|
All Commodities |
4.9 |
0.2 |
5.1 |
|
A. |
Primary Articles |
6.8 |
-5.2 |
1.3 |
| |
1. |
Vegetables |
77.1 |
-36.8 |
11.9 |
| |
2. |
Eggs, Fish and Meat |
10.1 |
-2.5 |
7.3 |
| |
3. |
Raw Cotton |
0.8 |
-24.4 |
-23.8 |
| |
4. |
Oilseeds |
7.7 |
-13.2 |
-6.5 |
| |
5. |
Iron Ore |
190.0 |
-24.4 |
119.1 |
|
B. |
Fuel Group |
7.0 |
3.2 |
10.5 |
| |
1. |
Coal Mining |
17.1 |
0.0 |
17.1 |
| |
2. |
Mineral Oil |
10.3 |
5.2 |
16.0 |
|
C. |
Manufactured Products |
3.5 |
1.1 |
4.6 |
| |
1. |
Sugar |
10.3 |
8.5 |
19.7 |
| |
2. |
Edible Oils |
0.1 |
-8.5 |
-8.4 |
| |
3. |
Oil Cakes |
-8.5 |
-9.7 |
-17.4 |
| |
4. |
Tea and Coffee Processing 9.1 |
-5.7 |
2.9 |
| |
5. |
Cotton Textiles |
-3.0 |
-10.0 |
-12.7 |
| |
6. |
Man-made Textiles |
2.4 |
-1.5 |
0.8 |
| |
7. |
Iron and Steel |
17.4 |
3.3 |
21.3 |
| |
8. |
Electrical Machinery |
4.8 |
-0.7 |
4.1 |
| |
|
|
|
|
|
|
Memo Items: |
|
|
|
|
i. |
Total Food Items |
4.4 |
-2.4 |
1.9 |
|
ii. |
Total Non-food Items |
5.1 |
1.1 |
6.3 |
Petrol prices, raised earlier on November 5, 2004, were moderated somewhat effective November 15, 2004. Sugar prices hardened during the year, reflecting reduced domestic supply which also affected international prices.
I.3.37 The impact of fiscal measures in the form of cuts in excise and customs duties in June and August 2004 cushioned the pass-through of the increase in international commodity prices to domestic inflation. The appreciation of the rupee against the US dollar during August-December 2004 (6.6 per cent) also offset some of the pressures of high international commodity prices on domestic inflation. Moreover, the administered nature of domestic urea prices limited the pass-through from high international prices. Administered prices of urea in India were not changed at all during 2004-05, despite an increase of 35 per cent in world urea prices. Finally, monetary policy measures by the Reserve Bank including an increase of 50 basis points in the CRR in September-October 2004, a 25 basis point increase in the reverse repo rate in October 2004 and re-introduction of overnight reverse repo in November 2004, along with the raising of ceiling of the MSS by Rs.20,000 crore signalled the resolve of the monetary authority to rein in inflationary expectations.
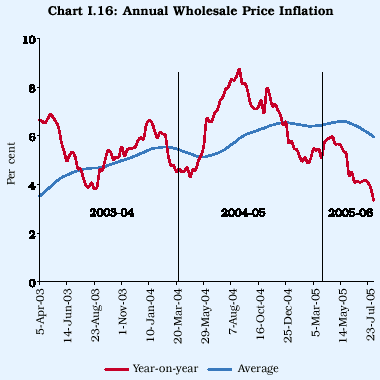
I.3.38 Headline inflation, year-on-year, eased to 5.1 per cent by the end of 2004-05 remaining close to the projection in the Annual Policy Statement for 2004-05. Annual average inflation, measured by annual changes in the average WPI, accelerated to 6.4 per cent in 2004-05 from 5.4 per cent a year ago (Chart I.16). Reflecting the supply side nature of inflation, year-on-year WPI inflation, excluding the fuel group worked out to 3.7 per cent in 2004-05 (5.2 per cent last year), well below the headline rate of 5.1 per cent.
Components of Inflation
I.3.39 Supply-side pressures dominated the inflation outcome in 2004-05. Mineral oil, coal, iron ore, iron and steel, sugar, and fr uits and vegetables - the key movers of headline inflation in 2004-05 with a combined weight of less than 20 per cent in the overall WPI index - accounted for more than three-fourth of the headline inflation in 2004-05. The contribution of various commodity groups to overall inflation underwent significant changes during 2004-05. The contribution of primary articles prices moderated to 5.5 per cent in 2004-05 from 8.5 per cent a year ago. The fuel group
accounted for as much as 42.7 per cent of the overall inflation during the year, up from 11.6 per cent in the previous year. The share of the manufactured products group declined to 52.0 per cent from 80.5 per cent in 2003-04 as the increase in sugar prices was more than offset by the decline in the prices of cotton, edible oils and oil cakes (Table 1.25 and Appendix Tables I.25 and I.26).
I.3.40 Raw cotton prices began to harden in July 2004, reflecting worries about the South-West monsoon. With the receding of supply concerns, cotton prices began to decline from September 2004 in line with international price movements. Domestic oilseeds prices hardened in the first half of 2004-05 on concerns about a crop failure resulting from the inadequate rainfall and uncer tainties over the possibilities of El Nino damaging Malaysian palm oil production. In order to contain rising prices, the Government reduced tariffs on vegetable oils in September 2004. Oilseeds and edible oils prices began to soften from end-September 2004 in line with international prices.
I.3.41 Sugar prices in India hardened in the latter half of 2004-05, reflecting the shortfall in output due to the deficient monsoon and higher international prices. International sugar prices were affected by the domestic situation as India is the world’s largest consumer as well as producer of sugar. Although the Government released higher free sale quota of sugar during the latter half of the year, prices of sugar continued to increase.
I.3.42 Fuel prices in India hardened during 2004-05, reflecting imported price pressures. The pass-through of the increase in international prices in 2004-05 to domestic prices was cushioned by the absorption of a part of the burden of the oil price increase by the Government and oil companies. On June 15, 2004 excise duties on petrol, high-speed diesel and liquefied petroleum gas (LPG) were reduced by 4 percentage points, 3 percentage points and 8 percentage points, respectively. On August 18, 2004, excise duties were further cut for petrol and diesel (3 percentage points each) and kerosene (4 percentage points). This was buttressed by a reduction of customs duties on petrol, diesel, LPG and kerosene by 5 percentage points each. Domestic mineral oils prices rose by only 16.0 per cent during 2004-05 as compared with an increase of 41.8 per cent in international crude oil prices (Chart I.17 and Box I.8).
Table 1.25: Annual WPI Inflation by Component
| |
|
|
|
|
|
|
| |
|
|
(Base: 1993-94=100) |
|
|
|
|
| |
|
|
|
|
|
|
|
|
(Per cent) |
| |
|
|
|
|
|
|
|
|
|
| |
Major group / Item |
Weight |
|
Annual Inflation Rate |
Weighted Contribution to |
| |
|
|
|
|
(Year-on-year) |
Annual Inflation |
|
| |
|
|
|
|
|
|
|
|
|
| |
|
|
|
2004-05 |
2003-04 |
2002-03 |
2004-05 |
2003-04 |
2002-03 |
| |
|
|
|
|
|
|
|
|
|
| |
1 |
|
2 |
3 |
4 |
5 |
6 |
7 |
8 |
| |
|
|
|
|
|
|
|
|
|
| |
All Commodities |
100.0 |
5.1 |
4.6 |
6.5 |
100.0 |
100.0 |
100.0 |
| |
|
|
|
|
|
|
|
|
|
|
1. |
Primary Articles |
22.0 |
1.3 |
1.6 |
6.1 |
5.5 |
8.0 |
21.6 |
| |
Food Articles |
15.4 |
3.0 |
0.2 |
0.8 |
8.9 |
0.6 |
2.2 |
| |
i. |
Cereals |
4.4 |
2.9 |
-0.3 |
4.0 |
2.4 |
-0.3 |
2.9 |
| |
ii. |
Pulses |
0.6 |
-2.6 |
-2.6 |
0.3 |
-0.3 |
-0.3 |
0.0 |
| |
iii. |
Vegetables |
1.5 |
11.9 |
2.8 |
-15.7 |
2.3 |
0.6 |
-3.0 |
| |
iv. |
Fruits |
1.5 |
11.5 |
-8.6 |
7.6 |
4.1 |
-3.9 |
2.4 |
| |
v. |
Milk |
4.4 |
-1.7 |
8.4 |
0.6 |
-1.5 |
7.9 |
0.5 |
| |
vi. |
Eggs, Fish and Meat |
2.2 |
7.3 |
-6.5 |
-4.0 |
3.1 |
-3.4 |
-1.7 |
| |
Non-Food Articles |
6.1 |
-6.9 |
4.1 |
22.1 |
-8.8 |
5.8 |
19.3 |
| |
i. |
Raw Cotton |
1.4 |
-23.8 |
12.3 |
34.3 |
-6.5 |
3.4 |
5.4 |
| |
ii. |
Oilseeds |
2.7 |
-6.5 |
-1.2 |
30.0 |
-3.4 |
-0.7 |
10.6 |
| |
iii. |
Sugarcane |
1.3 |
-0.7 |
6.5 |
11.5 |
-0.2 |
2.3 |
2.8 |
| |
|
|
|
|
|
|
|
|
|
|
2. |
Fuel, Power, Light and Lubricants |
14.2 |
10.5 |
2.5 |
10.8 |
42.7 |
11.6 |
33.9 |
| |
i. |
Mineral Oil |
7.0 |
16.0 |
0.0 |
18.4 |
34.9 |
-0.1 |
29.7 |
| |
ii. |
Electricity |
5.5 |
0.8 |
4.9 |
3.4 |
1.2 |
8.1 |
4.2 |
| |
iii. |
Coal Mining |
1.8 |
17.1 |
9.2 |
0.0 |
6.4 |
3.7 |
0.0 |
| |
|
|
|
|
|
|
|
|
|
|
3. |
Manufactured Products |
63.8 |
4.6 |
6.7 |
5.1 |
52.0 |
80.5 |
44.3 |
| |
i. |
Food Products |
11.5 |
0.4 |
9.7 |
8.7 |
0.9 |
22.2 |
14.0 |
| |
|
of which: Sugar |
3.6 |
19.7 |
16.9 |
-15.0 |
10.3 |
8.7 |
-7.0 |
| |
|
Edible Oils |
2.8 |
-8.4 |
6.6 |
27.4 |
-4.0 |
3.4 |
8.5 |
| |
|
Oil Cakes |
1.4 |
-17.4 |
5.0 |
40.3 |
-6.4 |
2.0 |
8.8 |
| |
ii. |
Cotton Textiles |
4.2 |
-12.7 |
15.6 |
8.3 |
-10.4 |
12.8 |
4.8 |
| |
iii. |
Man-made Fibre |
4.4 |
0.6 |
-0.4 |
17.4 |
0.3 |
-0.2 |
5.8 |
| |
iv. |
Chemicals and Chemical Products |
11.9 |
3.9 |
0.1 |
4.2 |
9.1 |
0.3 |
8.2 |
| |
|
of which: Fertilisers |
3.7 |
3.3 |
-0.1 |
2.1 |
2.2 |
-0.1 |
1.2 |
| |
v. |
Basic Metals, Alloys and Metal Products |
8.3 |
17.1 |
22.1 |
6.6 |
28.4 |
34.4 |
7.3 |
| |
|
of which: Iron and Steel |
3.6 |
21.3 |
34.6 |
9.2 |
17.0 |
23.6 |
4.4 |
| |
vi. |
Non-Metallic Mineral Products |
2.5 |
11.4 |
3.0 |
3.3 |
4.7 |
1.4 |
1.1 |
| |
|
of which: Cement |
1.7 |
10.2 |
1.3 |
1.1 |
2.9 |
0.4 |
0.3 |
| |
vii. |
Machinery and Machine Tools |
8.4 |
7.1 |
3.1 |
0.5 |
8.6 |
4.3 |
0.5 |
| |
viii. |
Transport Equipment and Parts |
4.3 |
6.2 |
1.4 |
-0.9 |
4.3 |
1.1 |
-0.6 |
| |
|
|
|
|
|
|
|
|
|
| |
Food Items (Composite) |
26.9 |
1.9 |
4.0 |
3.9 |
9.8 |
22.8 |
16.2 |
| |
WPI excluding Food |
73.1 |
6.3 |
4.9 |
7.5 |
90.2 |
77.2 |
83.8 |
| |
WPI excluding Fuel |
85.8 |
3.7 |
5.2 |
5.4 |
57.3 |
88.4 |
66.1 |
| |
|
|
|
|
|
|
|
|
|
|
Memo Items: |
|
|
|
|
|
|
|
| |
GDP Deflator |
|
5.1 |
3.0 |
4.2 |
|
|
|
| |
Average WPI Inflation |
|
6.4 |
5.4 |
3.4 |
|
|
|
| |
Average CPI Inflation: |
|
|
|
|
|
|
|
| |
|
Industrial Workers |
|
3.8 |
3.9 |
4.0 |
|
|
|
| |
|
Urban Non-Manual Employees |
|
3.6 |
3.7 |
3.8 |
|
|
|
| |
|
Agricultural Labourers |
|
2.6 |
3.9 |
3.2 |
|
|
|
| |
|
Rural Labourers |
|
2.6 |
3.8 |
3.1 |
|
|
|
I.3.43 Iron ore prices increased sharply by 119.1 per cent on a year-on-year basis in 2004-05 on top of an increase of 53.0 per cent last year. Domestic iron and steel prices also increased by 21.3 per cent on top of an increase of 34.6 per cent in 2003-04, contributing 17.0 per cent of the overall inflation. This was due to
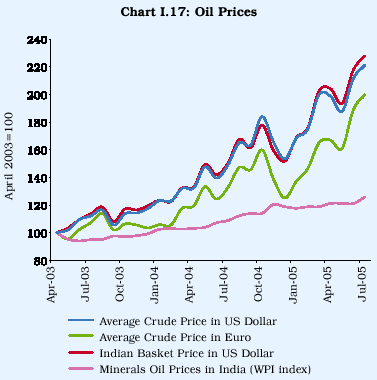
the steep increase in international steel prices together with higher domestic demand and rising input costs, especially on account of scrap and coal. The impact of the increase in international steel prices on domestic prices was partly contained by cuts in customs and excise duties on inputs as well as on finished products.
I.3.44 To summarise, the increase in headline WPI inflation in India during the first half of the year reflected largely supply side shocks emanating from high international commodity prices, especially of crude oil and metals. Although demand-side pressures were relatively subdued, the liquidity overhang fuelled concerns about emergence of inflationary expectations. Monetary and fiscal measures were, therefore, initiated to check the cascading effect of these supply shocks and especially, to stabilise inflation expectations. These measures were successful and, consequently, headline inflation moderated to 5.1 per cent by end-March 2005, consistent with the projection given in the Annual Policy Statement in May 2004.
Consumer Price Inflation
I.3.45 Consumer price inflation, as measured by variation in the consumer price index for industrial workers (CPI-IW), increased from 3.5 per cent in March 2004 to 4.2 per cent in March 2005. The inflation rate had, however, accelerated to 4.8 per cent in September 2004 reflecting the increase in food prices (which have a weight of 57 per cent) emanating from the deficient and uneven progress of the South-West monsoon during July-August 2004 (Chart I.18). Food prices contributed as much
Box I.8
Impact of Oil Prices on Inflation
Rising oil prices fuelled inflationary expectations in 2004 across countries with implications for global growth and inflation. The impact of a hike in world oil prices, however, varies from country to country depending on the energy intensity of production, import intensity of consumption and impact on terms of trade. A change in the prices of petroleum products impacts inflation directly to the extent of its weighted contribution in the overall price index. As petroleum products are used as inputs in the production of several other commodities, prices of all those commodities also change which, in turn, impacts inflation indirectly. According to the IMF (2004), a permanent increase of US $ 5 per barrel in crude oil prices is estimated to increase inflation by 60-70 basis points in major developing regions - more than three times the increase in industrial economies.
India is the sixth largest consumer of petroleum products in the world, up from 14th position in 1993. India’s share in global oil consumption has risen to 3.2 per cent in 2004 from 2.2 per cent in 1993 and 1.2 per cent in 1981. Indian oil demand grew by 4.7 per cent in 2004 (1.3 per cent in 2003), higher than the growth of 3.4 per cent in world oil demand. India’s import basket of crude oil comprises 43 per cent of ‘sweet’ crude and 57 per cent of the ‘sour’ variety and is weighted in favour of the Dubai crude relative to the UK Brent or the US West Texas Intermediate (WTI). Average crude oil prices facing India escalated by 40.0 per cent from US $ 27.8 per barrel in 2003-04 to US $ 38.9 per barrel in 2004-05. The Indian basket price increased further during April-July 2005 and stood at US $ 50.8 a barrel or about 47 per cent higher over the corresponding period of the previous year. In the absence of any countervailing policy intervention, every US dollar increase in crude oil prices could potentially add 15 basis points to WPI inflation as a direct effect and another 15 basis points as an indirect effect.
References
1. Bhattacharya, Kaushik and Indranil Bhattacharyya (2001), ‘Impact of Increase in Oil Prices on Inflation and Output in India’, Economic and Political Weekly, December.
2. B P (2005), Statistical Review of World Energy, June.
3. International Monetary Fund (2004), World Economic Outlook, September.
4. Reserve Bank of India (2005), Annual Policy Statement, April.
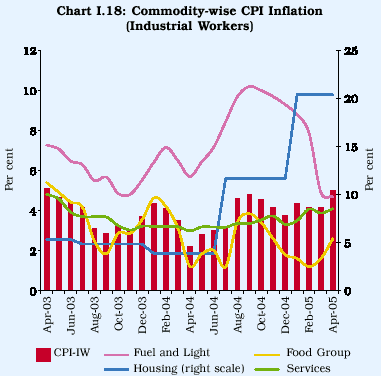
as 45 per cent of the overall inflation (y-o-y) in September 2004. After easing somewhat, CPI-IW inflation firmed up again to 4.4 per cent in January 2005 mainly due to an increase in the prices of housing. Food price inflation moderated to 1.6 per cent in March 2005 from 4.2 per cent a year ago. While domestic housing prices in the CPI-IW increased sharply by 20.4 per cent in 2004-05 as compared with 3.9 per cent a year ago, services prices (proxied by the broad miscellaneous group) increased moderately by 4.1 per cent (3.2 per cent in the previous year). On an average basis, CPI inflation at 3.8 per cent in 2004-05 was marginally lower than that of 3.9 per cent a year ago.
I.3.46 A distinctive feature of the recent inflation experience is that consumer price inflation has been lower than wholesale price inflation (Chart I.19). This essentially reflected the lower weightage of key drivers of wholesale price inflation such as fuels and metals in the CPI basket.
I.3.47 The year-on-year CPI inflation for Urban Non-Manual Employees (UNME) increased to 4.0 per cent in 2004-05 from 3.4 per cent a year ago. CPI inflation for Agricultural Labourers (AL) increased from 1.5 per cent in the beginning of the financial year to 3.6 per cent by October 2004, but gradually declined thereafter to 2.4 per cent by March 2005, comparable to the previous year’s level of 2.5 per cent. CPI inflation for Rural Labourers (RL) also increased from 1.8 per cent in the beginning of the year to 3.6 per cent by October 2004 and declined thereafter to 2.4 per cent
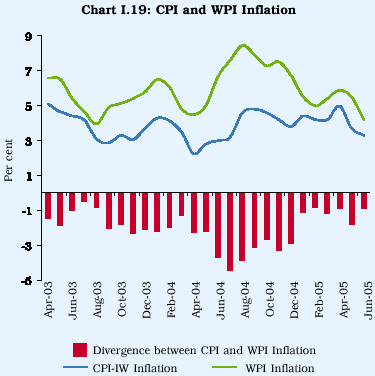
in March 2005. Consumer price inflation, measured by CPI-IW and CPI-UNME, was thus higher than that measured by CPI-AL and CPI-RL. This essentially reflected the fact that housing prices, which recorded a steep increase in 2004-05, have a significant weightage in the CPI-IW and CPI-UNME but are excluded in CPI-AL and CPI-RL. It is in this context that there is a need for constructing an economy-wide harmonised index of consumer prices (Box I.9).
I.3.48 To conclude, consumer price inflation remained moderate vis-à-vis WPI inflation during 2004-05. This essentially reflected the supply side character of WPI inflation as well as absence of demand side pressures in the economy.
Asset Prices and Inflation
I.3.49 Asset prices in India generally hardened during 2004-05, reflecting the overall improvement in macroeconomic conditions. Equity markets, in particular, remained bullish. Gold prices also remained at elevated levels, indicative of higher demand. Gilt yields showed signs of firming up during the first half of 2004-05 in the wake of hardening of domestic inflation in an environment of a sustained pick-up in credit demand, hardening of international interest rates and the persistence of pressures in international crude oil markets. The yields stabilised by December 2004 with the easing of domestic inflation. The exchange rate, on an average, appreciated against the US dollar, reflecting continued strength of capital inflows (Chart I.20).
Box I.9
Harmonised Index of Consumer Prices (HICP)
Various price indices are currently available to measure prices paid by a consumer or a producer. Most countries, therefore, compute indices of consumer prices to capture the cost of living and producer prices to capture the cost of production. In India, there are two sets of indices, viz., wholesale price index (WPI) and consumer price indices (CPIs), the latter based on occupational classification and category of residence (rural or urban). The four broad measures of CPIs available at the national level to capture prices of a defined basket of goods and services consumed by a particular segment of the population are: CPI for Agricultural Labourers (CPI-AL) (defined as households which derive half their income through agricultural labour); CPI for Rural Labourers (CPI-RL) (households which derive half their income through rural labour); CPI for Industrial Workers (CPI-IW) (working class families, essentially in urban areas) and CPI for Urban Non-Manual Employees (CPI-UNME) (urban middle class families).
There are two key sources of difference in the four CPIs. The weight of cereals is about 10 per cent in the CPI basket for urban non-manual employees and about 20 per cent for industrial workers, while it is around 40 per cent for the agricultural/rural labourers. Housing is not considered in the CPI for agricultural/rural labourers, while it has a weight of as high as 16.4 per cent in the CPI for urban non-manual employees and 8.7 per cent in the CPI for industrial workers.
Although various measures of CPI do move together in the long run, significant variations have been observed in the short-run (Chart). This renders the interpretation of inflationary pressures difficult which, in turn, complicates the process of monetary policy formulation. The analytical value of information provided by different CPIs, however, can be enhanced by combining them into a Har monised Index of Consumer Prices (HICP) which assesses consumer price inflation on an economy-wide scale.
In this context, the HICP in the Euro area provides an interesting experience. The HICP was developed as a statistical indicator for common measurement and inter national compar ison of inflation within the European Union (EU) as part of the convergence criteria for the European Monetary Union (EMU). Because of significant differences in coverage and methodology used to constr uct national CPIs, measured inflation rates were not comparable across EU member-countries. The basic objective behind the
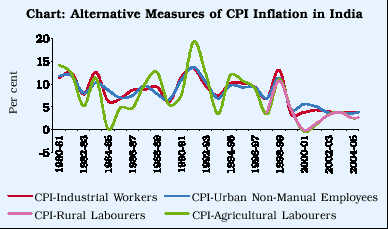
construction of HICP was to get comparable inflation for member countries through harmonisation of the methodology used in the construction of national HICPs, homogenisation of the treatment and coverage of goods and services based on a common expenditure classification and prescription of certain minimum standards on incorporation of newly significant goods and services, quality adjustment, representativeness of the sample and use of comparable formulae for aggregating prices at the most basic level. The European Community’s Statistical Office began publishing monthly HICPs in March 1997 which were used initially in the assessment of a country’s eligibility to join the Monetary Union in 1998. Since January 1999, this has been used by the European Central Bank to measure inflation in the Euro area for monetary policy purposes. A similar HICP for India for all consumers taken together would perhaps provide a better indicator of underlying inflationary pressures in the economy from the perspective of monetary policy formulation.
References
1. Donoghue, Jim O’ (2000), ‘Harmonised Index of Consumer Prices: Update on Methodological Developments’, Economic Trends, No.556, March, Office for National Statistics, UK.
2. European Central Bank (2003), ‘Euro Area Statistics Methodological Notes’, Monthly Bulletin, May.
3. Government of India (1999), An Overview of Price Indices Compilation in India, Contributed paper presented at the Joint ECE/ILO Meeting on Consumer Price Indices, Geneva, November.
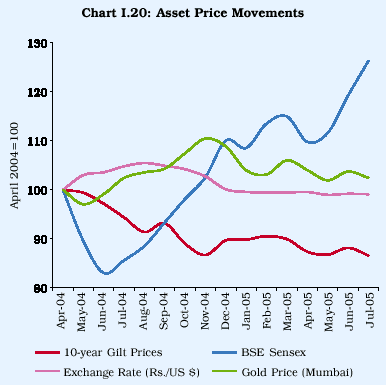
Developments during 2005-06
I.3.50 Year-on-year WPI inflation accelerated to 6.0 per cent by April 23, 2005 due to hardening of prices of fruits and vegetables under seasonal pressures and some upward adjustment in the prices of aviation turbine fuel, naphtha, furnace oil and iron and steel. In view of the persistently rising international crude oil prices, domestic prices of petrol and diesel were increased by about 7-8 per cent on June 20, 2005 after a gap of almost seven months. Electricity prices were also raised by 5.1 per cent in early June 2005. Despite these increases, inflation eased to 3.4 per cent by August 6, 2005 reflecting the base effect of higher prices last year and monetary policy measures. Consumer price inflation (Industrial Workers) also eased from 4.2 per cent in March 2005 to 3.3 per cent by June 2005.
IV. GOVERNMENT FINANCES
I.4.1 Key fiscal indicators for 2004-05 show consolidation and improvement in both Central and State Government finances. The notification of the Fiscal Responsibility and Budget Management (FRBM) Act, 2003 set the stage for a front-loaded fiscal correction path for the Central Government in 2004-05. However, the unanticipated fiscal stress encountered during the course of the year on account of post-budget duty concessions undertaken to ease emerging inflationary pressures, increased fertiliser subsidy and the delay in the passage of the Finance Act resulted in slippages from the budgetary projections (in respect of both revenue and fiscal deficits in terms of revised estimates but only revenue deficit in terms of provisional accounts). However, the FRBM targets for fiscal and revenue deficits were achieved. State finances indicated some improvement in the revenue deficit mainly on account of increase in States’ own tax collections and higher grants from the Centre. With capital expenditure overshooting the budgeted level, there was a slippage in the fiscal deficit vis-à-vis the budget estimates.
I.4.2 An overview of the combined finances of the Centre and State Governments for 2004-05 reveals a considerable improvement in the revenue deficit over the preceding year mainly on account of improved tax and non-tax collections and a decline in interest payments as a proportion to GDP (Table 1.26).
Table 1.26: Indicators of Fiscal Policy
| |
|
|
(Per cent of GDP) |
| |
|
|
|
|
|
Item |
2004- |
2003- |
1995- |
1990- |
| |
05 RE |
04 |
96 |
91 |
| |
|
|
|
|
|
1 |
2 |
3 |
4 |
5 |
| |
|
|
|
|
|
Gross Fiscal Deficit (GFD) |
8.3 |
8.4 |
6.5 |
9.4 |
|
Revenue Deficit |
4.1 |
5.8 |
3.2 |
4.2 |
|
Primary Deficit |
2.2 |
2.0 |
1.6 |
5.0 |
|
Revenue Receipts |
19.9 |
18.5 |
18.3 |
18.6 |
|
Tax Revenue |
15.7 |
14.8 |
14.7 |
15.4 |
|
Direct Taxes |
5.0 |
4.5 |
3.5 |
2.5 |
|
Indirect Taxes |
10.7 |
10.3 |
11.2 |
12.9 |
|
Non-tax Revenue |
4.1 |
3.7 |
3.6 |
3.2 |
|
Total Expenditure* |
28.7 |
28.5 |
25.4 |
28.7 |
|
Developmental |
|
|
|
|
|
Expenditure |
14.9 |
14.9 |
13.9 |
17.1 |
|
Non-developmental |
|
|
|
|
|
Expenditure* |
13.8 |
13.6 |
11.5 |
11.6 |
|
Interest Payments |
6.1 |
6.4 |
5.0 |
4.4 |
|
Debt@ |
82.0 |
81.1 |
61.3 |
64.8 |
| |
|
|
|
|
| |
|
Per cent |
|
| |
|
|
|
|
|
Capital Outlay/ Total Expenditure |
13.6 |
10.8 |
10.8 |
13.1 |
|
Interest Payments/ |
|
|
|
|
|
Revenue Receipts |
30.6 |
34.5 |
27.2 |
23.6 |
|
Revenue Deficit/GFD |
49.7 |
69.5 |
48.8 |
44.6 |
| |
|
|
|
|
|
RE : Revised Estimates.
* : Net of repayments.
@ : Includes 'reserve funds' and 'deposits and advances'.
Note : 1. All indicators are based on combined data of the Centre
and States with inter-Governmental transactions netted out.
2. Data in respect of the State Governments are provisional for the years
2003-04 and 2004-05 and relate to budgets of 28 State Governments.
|
CENTRAL GOVERNMENT FINANCES, 2004-05
Revised Estimates
I.4.3 The Central Government finances in 2004-05 were guided by the FRBM Act, 2003 and FRBM Rules, 2004. The FRBM Rules, inter alia, stipulate minimum annual reductions of 0.5 percentage points in the revenue deficit (RD) to GDP ratio and of 0.3 percentage points in the gross fiscal deficit (GFD) to GDP ratio. The revised estimates for 2004-05 indicate that the FRBM targets were achieved (Table 1.27). The Union Budget for 2004-05 had, however, aimed at achieving larger reductions in the GFD and RD than the FRBM thresholds. The budget projections could not be met due to the post-budget duty concessions and increase in fertiliser subsidy to contain inflationary pressures. The time taken for the passage of the Finance Act also implied that several tax measures proposed in the Budget could become effective only towards the latter part of the year.
I.4.4 Consequent upon shortfall in tax collections, reductions in capital expenditure (capital outlay and net lending) restricted the slippage in the fiscal deficit (Table 1.28).
I.4.5 The financing pattern of the Centre’s GFD underwent a change vis-à-vis the budgeted pattern during 2004-05 as the National Small Savings Fund (NSSF) reinvested redemption proceeds from the Debt Swap Scheme (DSS) in the special securities of the Centre, thereby financing 24.4 per cent of the GFD. Accordingly, the Centre’s market borrowings in the revised estimates were lower by 49 per cent than the budget estimates, thereby financing 33 per cent of the GFD.
Provisional Accounts
I.4.6 Provisional accounts of the Central Government for 2004-05, which have become available subsequently, show that all the key deficit indicators were placed lower than the revised
Table 1.27: Deficit Indicators of the Centre
| |
|
|
(Per cent of GDP) |
| |
|
|
|
|
|
|
Deficit Indicators |
|
2004-05 |
|
2003-04 |
|
| |
RE |
BE |
FRBM |
Actuals |
RE |
| |
|
target@ |
|
|
| |
|
|
|
|
|
|
1 |
2 |
3 |
4 |
5 |
6 |
| |
|
|
|
|
|
|
Fiscal Deficit |
4.5 |
4.4 |
4.5 |
4.5 |
4.8 |
|
Revenue Deficit |
2.7 |
2.5 |
3.1 |
3.6 |
3.6 |
| |
|
|
|
|
|
|
RE : Revised Estimates. : Budget Estimates.
@ : Derived over 2003-04 (RE).
|
Table 1.28: Gross Fiscal Deficit of the Centre – Budget vis-à-vis Revised Estimates
| |
| |
|
|
| |
|
(Rupees crore) |
| |
|
|
|
|
Items |
2004-05 |
2004-05 |
Variation |
| |
(RE) |
(BE) |
(RE over |
| |
|
|
BE) |
|
1 |
2 |
3 |
4 |
| |
|
|
|
|
Gross Fiscal Deficit |
|
|
|
|
(3+4+5+6-1-2) |
1,39,231 |
1,37,407 |
1,824 |
|
1. Revenue Receipts |
3,00,904 |
3,09,322 |
-8,418 |
|
2. Disinvestment Receipts |
4,091 |
4,000 |
91 |
|
3. Revenue Expenditure |
3,86,069 |
3,85,493 |
576 |
|
4. Capital Outlay |
56,616 |
60,718 |
-4,102 |
|
Of which: |
|
|
|
|
Defence |
33,483 |
33,483 |
0 |
|
5. Public Debt Repayments |
|
|
|
|
to NSSF |
32,665 |
0 |
32,665 |
|
6. Net Lending |
-31,124 @ |
4,518 |
-35,642 |
|
RE: Revised Estimates. BE: Budget Estimates.
@: Net lending is negative on account of increase in
recovery of loans from the State Governments under the
Debt Swap Scheme. |
estimates, reflecting higher non-tax revenues and lower capital expenditure, especially during the last quarter of the year. In particular, the gross fiscal deficit and the primary deficit were lower by 0.4 percentage points of GDP each on account of a sharp cut back in capital outlays. The fiscal outcome in 2004-05, thus, showed a mar ked improvement over the performance in 2003-04. Notably, the revenue deficit in 2004-05 declined by one percentage point of GDP over 2003-04, achieving twice the minimum annual reduction stipulated under the FRBM Act/Rules.
Debt Position of the Central Government
I.4.7 The outstanding domestic liabilities of the Central Government increased to 62.1 per cent of GDP at end-March 2005 from 61.3 per cent at end-March 2004 (Appendix Table I.34). This was mainly on account of an increase of 38 per cent in the liabilities of the NSSF over the level in the preceding year. According to the accounting arrangements, the net small savings collections by the NSSF are passed on to the States; however, the NSSF continues to be a part of ‘other liabilities’ of the Central Government. Inter nal debt, in relation to GDP, on the other hand, declined from 41.4 per cent at end-March 2004 to 40.9 per cent at end-March 2005 despite the inclusion of amounts raised by the Central Government under
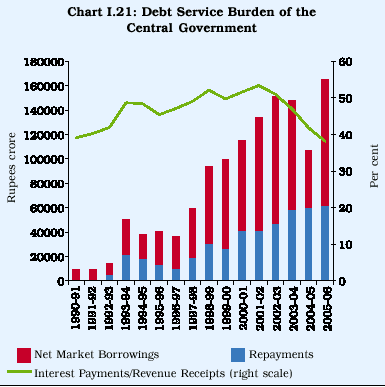
the Market Stabilisation Scheme (MSS). This decline is attributable to the truncation of the net market borrowings during 2004-05 to around half of the budgeted amount.
I.4.8 An encouraging feature in recent years has been the decline of interest payments from 53.4 per cent of revenue receipts in 2001-02 to 47.0 per cent in 2003-04 and further to 41.8 per cent in 2004-05 (Chart 1.21). This reflected mainly a steady reduction in the interest cost of the Central Government’s market borrowings and improved revenue buoyancy.
I.4.9 The average interest rate on outstanding market loans continued to decline despite the firming up of the weighted average interest rate during 2004-05. The average interest cost of borrowings from the NSSF also declined significantly in 2003-04 and 2004-05, reflecting the impact of State debt swap transactions, whereby the Centre redeemed its high cost securities issued to the NSSF with the proceeds from the DSS and replaced them with securities carrying lower interest rates (Table 1.29).
STATE GOVERNMENT FINANCES - 2004-053
I.4.10 Some moderation in fiscal imbalances of State Governments has been visible in recent years after a period of deterioration since the early 1990s. There has been a growing urgency surrounding
Table 1.29: Average Interest Rates on Outstanding Domestic Liabilities of the Centre
| |
| |
|
|
|
|
| |
|
|
|
|
|
|
(Per cent) |
| |
|
|
|
|
|
|
|
|
Year |
|
|
Market |
Small |
State |
Special |
| |
|
|
|
Loans |
Savings/ |
Provident |
Deposits |
| |
|
|
|
|
NSSF* |
Funds |
|
| |
|
|
|
|
|
|
|
|
1 |
|
|
|
2 |
3 |
4 |
5 |
| |
|
|
|
|
|
|
|
|
1990-91 to |
|
|
|
|
|
1994-95 |
(Average) |
10.86 |
10.85 |
11.63 |
11.53 |
|
1995-96 to |
|
|
|
|
|
1999-2000 (Average) |
11.62 |
11.62 |
11.62 |
10.93 |
|
2000-01 |
12.99 |
11.60 |
10.54 |
9.87 |
|
2001-02 |
12.83 |
11.61 |
9.09 |
10.50 |
|
2002-03 |
12.11 |
11.56 |
8.53 |
8.82 |
|
2003-04 |
9.86 |
10.88 |
7.66 |
7.94 |
|
2004-05 RE |
9.07 |
9.36 |
7.58 |
7.76 |
| |
|
|
|
|
|
|
|
|
RE: Revised Estimates.
*:Since 1999-2000, interest on small savings represents
interest on Central Government Special Securities issued to
the NSSF.
Note :1.Market loans represent dated securities.
2.Small savings represent small saving deposits, certificates
and public provident fund.
3.The Government notified the freezing of the corpus of the
Special Deposit Scheme as on June 30, 2003.
4.The interest rate for each component is computed by
dividing the interest payments in a year by the outstanding
liabilities at the end of the preceding year. |
fiscal consolidation in the States with the speeding up of various fiscal and institutional reforms. The revised estimates for 2004-05 showed slippages in the gross fiscal deficit (GFD) and the primary deficit of States from their budgeted levels. Notably, however, the revenue deficit recorded a decline from the budget estimates with its ratio to GDP declining to 1.4 per cent from 1.5 per cent. The reduction in the revenue deficit was brought about mainly by an increase in States’ own tax collections and higher grants from the Centre. Enhanced provisions for capital outlay, mainly in respect of the irrigation sector, resulted in a higher GFD than budgeted. Both the revenue deficit and the primary deficit turned out to be lower than their average levels during the triennium 2000-03 as well as the second half of the 1990s (Chart 1.22). All the three major deficit indicators, as ratios to GDP, were placed much lower in the revised estimates for 2004-05 than their respective levels reassessed by the Twelfth Finance Commission (TFC).
3 The analysis of State Finances for 2004-05 (Revised Estimates) is based on the Budget documents of 28 State Governments, of which 2 are Vote-on-Accounts. All data are provisional.
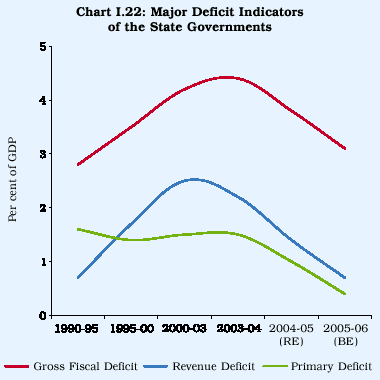
I.4.11 The financing pattern of GFD shows that small savings continued to remain the predominant source, accounting for more than two-third of the GFD in 2004-05 (Chart 1.23). Net loans from the Centre remained negative for the third year in succession on account of large repayments by the States under the DSS. On the other hand, the share of market borrowings has been increasing over the recent years, reflecting additional allocations under the DSS.
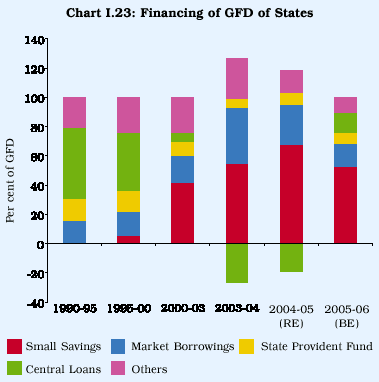
Contingent Liabilities
I.4.12 While contingent liabilities do not directly form part of the debt burden of the State Governments, the associated debt servicing remains their obligation in the event of a default. Recognizing the debilitating implication of such liabilities, the TFC has recommended that States should set up Guarantee Redemption Funds through earmarked guarantee fees. So far, five States, viz., Andhra Pradesh, Haryana, Goa, Orissa and Gujarat have set up such Guarantee Redemption Funds.
I.4.13 The Reserve Bank has been sensitising the State Governments on the possible adverse implications of guarantees provided by the State Governments. As part of its initiative, a Standing Committee has been constituted within the Reserve Bank to collect and monitor information on State Government guaranteed advances and bonds from the investors’ side on a periodic basis.
COMBINED BUDGETARY POSITION OF
THE CENTRE AND STATES
I.4.14 An analysis of the combined fiscal position of the Centre and States reveals slippages in the key deficit indicators in the revised estimates for 2004-05 from their budget estimates, primarily reflecting higher expenditures. Tax collections, both direct and indirect, also turned out to be lower than the budget estimates during 2004-05. Non-tax revenues, however, exceeded the budgeted level significantly. The aggregate disbursements were higher than the budgeted level, mainly on account of higher developmental expenditure (Table 1.30).
Social Sector Expenditure
I.4.15 The State Governments have traditionally played a dominant role in undertaking social expenditures. Accordingly, the steady decline in the allocation for social expenditures by the State Governments since 1998-99 is worrisome. On the other hand, the Centre has allocated increasing amounts under all categories of social services and also emphasised outcomes, rather than mere outlays, so as to improve the delivery mechanism of public expenditure programmes.
Combined Debt
I.4.16 The persistence of fiscal deficits of the Centre as well as the States over the years led to a further
Table 1.30: Indicators of Combined Finances of the Centre and States
| |
|
|
|
|
| |
|
|
|
|
|
|
|
|
(Rupees crore) |
| |
|
|
|
|
|
|
|
|
|
|
|
Items |
|
|
2004-05 |
2004-05 |
2003-04 |
1995-96 |
1990-91 |
Variation (RE over BE) |
| |
|
|
|
RE |
BE |
|
|
|
|
|
| |
|
|
|
|
|
|
|
|
Amount |
Per cent |
| |
|
|
|
|
|
|
|
|
|
|
|
1 |
|
|
|
2 |
3 |
4 |
5 |
6 |
7 |
8 |
| |
|
|
|
|
|
|
|
|
|
|
|
Gross Fiscal Deficit |
|
2,58,082 |
2,45,954 |
2,32,852 |
77,671 |
53,580 |
12,128 |
4.9 |
| |
|
|
|
(8.3) |
(7.9) |
(8.4) |
(6.5) |
(9.4) |
|
|
|
Revenue Deficit |
|
1,28,355 |
1,21,261 |
1,59,500 |
37,932 |
23,871 |
7,094 |
5.9 |
| |
|
|
|
(4.1) |
(3.9) |
(5.8) |
(3.2) |
(4.2) |
|
|
|
Primary Deficit |
|
69,543 |
55,508 |
56,282 |
18,598 |
28,585 |
14,035 |
25.3 |
| |
|
|
|
(2.2) |
(1.8) |
(2.0) |
(1.6) |
(5.0) |
|
|
|
Total Receipts(A+B) |
|
9,40,127 |
8,97,445 |
8,46,551 |
2,96,629 |
1,52,398 |
42,682 |
4.8 |
|
A. |
Revenue Receipts (1+2) |
|
6,16,747 |
6,05,343 |
5,11,079 |
2,17,526 |
1,05,757 |
11,404 |
1.9 |
| |
1. |
Tax Receipts (a+b) |
4,89,098 |
4,92,761 |
4,09,588 |
1,74,851 |
87,564 |
-3,663 |
-0.7 |
| |
|
a) Direct Taxes |
|
1,56,036 |
1,57,197 |
1,24,271 |
41,603 |
14,267 |
-1,161 |
-0.7 |
| |
|
b) Indirect Taxes |
3,33,062 |
3,35,564 |
2,85,317 |
1,33,248 |
73,297 |
-2,502 |
-0.7 |
| |
2. |
Non Tax Receipts |
1,27,649 |
1,12,582 |
1,01,491 |
42,675 |
18,193 |
15,067 |
13.4 |
|
B. |
Capital Receipts (a+b) |
3,23,380 |
2,92,102 |
3,35,472 |
79,102 |
46,641 |
31,278 |
10.7 |
| |
a) |
Non Debt Capital Receipts |
17,973 |
14,473 |
43,259 |
6,968 |
3,233 |
3,500 |
24.2 |
| |
b) |
Debt Capital Receipts |
3,05,407 |
2,77,629 |
2,92,213 |
72,134 |
43,408 |
27,778 |
10.0 |
|
Aggregate Expenditure(1+2+3 = 4+5) |
8,92,803 |
8,65,770 |
7,87,189 |
3,02,166 |
1,62,886 |
27,033 |
3.1 |
|
1. |
Revenue Expenditure |
7,45,102 |
7,26,603 |
6,70,579 |
2,55,457 |
1,29,628 |
18,499 |
2.5 |
|
2. |
Capital Outlay |
|
1,21,439 |
1,19,530 |
85,204 |
32,594 |
21,371 |
1,909 |
1.6 |
|
3. |
Loans and Advances |
26,262 |
19,636 |
31,407 |
14,115 |
11,887 |
6,626 |
33.7 |
|
4. |
Development Expenditure |
4,63,722 |
4,29,054 |
4,11,815 |
1,65,361 |
97,167 |
34,668 |
8.1 |
|
5. |
Non-Development Expenditure@ |
4,29,081 |
4,36,716 |
3,75,374 |
1,36,805 |
65,719 |
-7,635 |
-1.7 |
| |
|
|
|
|
|
|
|
|
|
|
|
RE : Revised Estimates. BE : Budget Estimates
@ : Excludes repayments.
Notes:1. Inter-Governmental transactions have been netted out.
2. Figures in parentheses are percentages to GDP.
3. Data in respect of States are provisional from 2003-04 onwards and relate to 28 States. |
rise in the ratio of combined outstanding liabilities to GDP reaching a significantly high level of 82.0 per cent during 2004-05 (Table 1.31).
Contingent Liabilities/ Guarantees of the Government
I.4.17 The outstanding amount of guarantees by the Central Government decreased for the second successive year even as those of State Gover nments continued to increase. As a proportion to GDP, the guarantees by the Centre and States together continued their falling trend (Table 1.32).
Table 1.31: Combined Liabilities of the Centre and States
| |
|
|
|
| |
|
|
|
|
|
(Rupees crore) |
| |
|
|
|
|
|
|
|
Year |
|
Outstanding Liabilities |
|
|
Debt-GDP Ratio (per cent) |
|
(end-March) |
|
|
|
|
|
|
| |
Centre |
States |
Combined |
Centre |
States |
Combined |
|
1 |
2 |
3 |
4 |
5 |
6 |
7 |
|
1990-91 |
3,14,558 |
1,25,662 |
3,66,331 |
55.3 |
22.1 |
64.4 |
|
1995-96 |
6,06,232 |
2,49,922 |
7,27,241 |
51.0 |
21.0 |
61.2 |
|
2000-01 |
11,68,541 |
5,81,710 |
14,71,669 |
55.9 |
27.8 |
70.4 |
|
2001-02 |
13,66,408 |
6,79,823 |
17,22,109 |
60.1 |
29.9 |
75.8 |
|
2002-03 |
15,59,201 |
7,85,301 |
19,69,678 |
63.3 |
31.9 |
80.0 |
|
2003-04 |
17,36,678 |
9,09,833 |
22,38,407 |
62.9 |
33.0 |
81.1 |
|
2004-05 RE |
19,81,514 |
10,24,538 |
25,46,526 |
63.8 |
33.0 |
82.0 |
|
2005-06 BE |
22,31,886 |
11,34,249 |
28,29,306 |
64.1 |
32.6 |
81.3 |
| |
|
|
|
|
|
|
|
RE: Revised Estimates. BE: Budget Estimates.
Note: 1.Data in respect of the States are provisional from 2003-04 onwards and relate to 28 States.
2.Under ‘combined liabilities’, inter-Governmental transactions are netted out.
3.Data include ‘reserve funds’ and ‘deposits and advances’. |
Table 1.32: Outstanding Government Guarantees
| |
| |
|
|
|
|
|
(Rupees crore) |
| |
|
|
|
|
|
|
|
|
Year |
Centre |
States |
|
Total |
|
(End- |
|
|
|
|
|
|
|
| |
Amount |
Per cent |
Amount |
Per cent |
Amount |
Per cent |
|
March) |
|
|
|
|
|
|
|
| |
|
of GDP |
|
of GDP |
|
of GDP |
|
1 |
2 |
3 |
4 |
|
5 |
6 |
7 |
|
1993 |
58,088 |
7.8 |
42,515 |
|
5.7 |
1,00,603 |
13.4 |
|
1994 |
62,834 |
7.3 |
48,865 |
|
5.7 |
1,11,700 |
13.0 |
|
1995 |
62,468 |
6.2 |
48,479 |
|
4.8 |
1,10,947 |
11.0 |
|
1996 |
65,573 |
5.5 |
52,631 |
|
4.4 |
1,18,204 |
9.9 |
|
1997 |
69,748 |
5.1 |
63,409 |
|
4.6 |
1,33,157 |
9.7 |
|
1998 |
73,877 |
4.9 |
73,751 |
|
4.8 |
1,47,628 |
9.7 |
|
1999 |
74,606 |
4.3 |
97,454 |
|
5.6 |
1,72,060 |
9.9 |
|
2000 |
83,954 |
4.3 |
1,32,029 |
|
6.8 |
2,15,983 |
11.2 |
|
2001 |
86,862 |
4.2 |
1,68,719 |
|
8.1 |
2,55,581 |
12.2 |
|
2002 |
95,859 |
4.2 |
1,65,386 |
|
7.3 |
2,61,245 |
11.5 |
|
2003 |
90,617 |
3.7 |
1,84,294 |
(P) |
7.5 |
2,74,911 |
11.2 |
|
2004 |
87,780 |
3.2 |
2,03,963 |
(P) |
7.4 |
2,91,743 |
10.6 |
| |
|
|
|
|
|
|
|
|
P : Provisional.
Note: Ratios to GDP may not add up to the total due to rounding off.
Source: 1. Data on Centre's guarantees are from budget documents of the Central Government.
2. Data on States' guarantees are based on the information received from State Governments
and pertain to 17 major States. Data for 2004 pertain to 15 major states. |
FISCAL OUTLOOK FOR 2005-06
Central Government
I.4.18 The Union Budget, 2005-06 was presented against the backdrop of sustained growth momentum with intermittent inflationary pressures, upbeat business confidence and strong industrial recovery supported by a pick-up in non-food bank credit off-take during 2004-05. Operationalising the recommendations of the Twelfth Finance Commission (TFC) and implementation of the State-level Value Added Tax (VAT) necessitated a ‘pause’ in the path set out under the FRBM Rules, 2004. Against this backdrop, the revenue deficit to GDP is pegged at 2.7 per cent in 2005-06 (Table 1.33). The fiscal deficit to GDP ratio is budgeted to be lower by 0.2 percentage point in 2005-06 than in 2004-05 RE (FRBM stipulates annual reduction of 0.3 percentage point). Disinvestment proceeds would no longer finance budgetary expenditure and would be credited to an ‘Investment Fund’ to finance social infrastructure expenditure and to provide capital to viable public sector undertakings.
I.4.19 A decomposition of the gross fiscal deficit budgeted for 2005-06 brings to the fore the following special features: First, the proportion of revenue deficit to GFD during 2005-06 vis-à-vis 2004-05 is budgeted to increase reflecting the increase in grants to the States. Second, the share of net lending of the Central Government in GFD is budgeted to turn negative in
Table 1.33: Major Fiscal Indicators of the Centre
| |
| |
|
|
(Rupees crore) |
| |
|
|
|
|
|
Item |
2005-06 |
2004-05 |
Variation |
| |
(BE) |
(RE) |
(BE over RE) |
| |
|
|
Amount |
Per cent |
|
1 |
2 |
3 |
4 |
5 |
|
Total Receipts (1+2) |
5,14,344 |
5,05,791 |
8,553 |
1.7 |
| |
(14.8) |
(16.3) |
|
|
|
1.Revenue Receipts |
3,51,200 |
3,00,904 |
50,296 |
16.7 |
| |
(10.1) |
(9.7) |
|
|
|
2.Capital Receipts |
1,63,144 |
2,04,887 |
-41,743 |
-20.4 |
| |
(4.7) |
(6.6) |
|
|
|
Total Expenditure (3+4) |
5,14,344 |
5,05,791 |
8,553 |
1.7 |
| |
(14.8) |
(16.3) |
|
|
|
3.Revenue Expenditure |
4,46,512 |
3,86,069 |
60,443 |
15.7 |
| |
(12.8) |
(12.4) |
|
|
|
4.Capital Expenditure |
67,832 |
1,19,722 |
-51,890 |
-43.3 |
| |
(1.9) |
(3.9) |
|
|
| |
|
|
|
|
|
Expenditure Excluding Repayments to NSSF |
|
|
|
Total Expenditure |
5,14,344 |
4,73,126 |
41,218 |
8.7 |
| |
(14.8) |
(15.2) |
|
|
|
Capital Expenditure |
67,832 |
87,057 |
-19,225 |
-22.1 |
| |
(1.9) |
(2.8) |
|
|
|
Gross Fiscal Deficit |
1,51,144 |
1,39,231 |
11,913 |
8.6 |
| |
(4.3) |
(4.5) |
|
|
|
Revenue Deficit |
95,312 |
85,165 |
10,147 |
11.9 |
| |
(2.7) |
(2.7) |
|
|
|
Primary Deficit |
17,199 |
13,326 |
3,873 |
29.1 |
| |
(0.5) |
(0.4) |
|
|
| |
|
|
|
|
|
BE : Budget Estimates. RE : Revised Estimates.
Note: Figures in parentheses are percentages to GDP. |
2005-06 on account of elimination of Plan loans to States as recommended by the TFC. Third, the proportion of capital outlay to GFD, which rose sharply in 2004-05 due to defence outlays, is budgeted to increase further in 2005-06 due to higher capital outlays on ‘special area programmes’, ‘science’, ‘technology and environment’, ‘communications’ and ‘general economic services’ (Table 1.34).
Table 1.34: Decomposition of the GFD of the Centre
| |
|
|
|
(Per cent) |
| |
|
|
|
|
|
Year |
Revenue |
Capital |
Net |
Other |
| |
Deficit |
Outlay |
Lending |
Non-debt |
| |
|
|
|
Receipts @ |
| |
|
|
|
|
|
1 |
2 |
3 |
4 |
|
| |
|
|
|
|
|
1990-91 |
41.6 |
27.2 |
31.2 |
0.0 |
|
1995-96 |
49.4 |
23.4 |
29.6 |
-2.3 |
|
2000-01 |
71.7 |
20.8 |
9.2 |
-1.8 |
|
2001-02 |
71.1 |
18.8 |
12.7 |
-2.6 |
|
2002-03 |
74.4 |
20.1 |
7.7 * |
-2.2 |
|
2003-04 |
79.7 |
27.8 |
6.3 * |
-13.8 |
|
2004-05 (RE) |
61.2 |
40.7 |
1.1 * |
-2.9 |
|
2005-06 (BE) |
63.1 |
41.1 |
-4.2 |
0.0 |
| |
|
|
|
|
|
@: Include disinvestment proceeds and value of bonus
shares.
* : Adjusted for debt swap transactions. |
Pattern of Receipts
I.4.20 The revenue receipts in 2005-06 are budgeted to increase by 16.7 per cent. Accordingly, the tax/GDP ratio is budgeted to improve to 10.6 per cent from 9.9 per cent in 2004-05. All the major tax collections, except under customs duty, are budgeted to improve as ratios to GDP (Table 1.35). The ratio of revenues from service tax to GDP is budgeted to increase from 0.46 per cent to 0.50 per cent. Overall, the measures taken in respect of direct taxes are expected to yield a gain of Rs.6,000 crore. Among the indirect taxes, the customs duty collections are budgeted to decline with the peak duty for non-agricultural products being reduced to 15 per cent from 20 per cent. Excise duty collections are, however, budgeted to accelerate. The overall impact of measures in respect of indirect taxes would be broadly revenue neutral.
I.4.21 Non-tax revenues are budgeted to register a moderate growth reflecting mainly enhanced collections under dividends and profits and higher returns from economic services. Interest receipts are budgeted to decline, mainly on account of a decline in interest receipts from States reflecting the impact of DSS.
Table 1.35: Revenue Position of the Centre
| |
|
|
(Rupees crore) |
| |
|
|
|
|
|
Item |
2005-06 |
2004-05 |
Variation |
| |
(BE) |
(RE) |
(BE over RE) |
| |
|
|
Absolute |
Per cent |
|
1 |
2 |
3 |
4 |
5 |
| |
|
|
|
|
|
Total Receipts (1+2) |
5,14,344 |
5,05,791 |
8,553 |
1.7 |
| |
(14.8) |
(16.3) |
|
|
|
1.Revenue Receipts |
3,51,200 |
3,00,904 |
50,296 |
16.7 |
| |
(10.1) |
(9.7) |
|
|
|
Tax Revenue (Net) |
2,73,466 |
2,25,804 |
47,662 |
21.1 |
| |
(7.9) |
(7.3) |
|
|
|
Non-Tax Revenue |
77,734 |
75,100 |
2,634 |
3.5 |
| |
(2.2) |
(2.4) |
|
|
|
2.Capital Receipts |
1,63,144 |
2,04,887 |
-41,743 |
-20.4 |
| |
(4.7) |
(6.6) |
|
|
| |
|
|
|
|
|
Memo Items |
|
|
|
|
| |
|
|
|
|
|
Gross Tax Revenue |
3,70,025 |
3,06,021 |
64,004 |
20.9 |
| |
(10.6) |
(9.9) |
|
|
|
Corporation Tax |
1,10,573 |
83,000 |
27,573 |
33.2 |
| |
(3.2) |
(2.7) |
|
|
|
Income Tax |
66,239 |
50,929 |
15,310 |
30.1 |
| |
(1.9) |
(1.6) |
|
|
|
Customs Duty |
53,182 |
56,250 |
-3,068 |
-5.5 |
| |
(1.5) |
(1.8) |
|
|
|
Union Excise Duty |
1,21,533 |
1,00,720 |
20,813 |
20.7 |
| |
(3.5) |
(3.2) |
|
|
|
Service Tax |
17,500 |
14,150 |
3,350 |
23.7 |
| |
(0.5) |
(0.5) |
|
|
| |
|
|
|
|
|
BE : Budget Estimates.
RE :Revised Estimates.
Note: Figures in parentheses are percentages to GDP. |
Table 1.36: Capital Receipts of the Centre
| |
|
| |
|
|
|
(Rupees crore) |
| |
|
|
|
|
|
|
Item |
|
2005-06 |
2004-05 |
Variation |
| |
|
(BE) |
(RE) |
(BE over RE) |
| |
|
|
|
Amount |
Per cent |
| |
|
|
|
|
|
|
1 |
|
2 |
3 |
4 |
5 |
| |
|
|
|
|
|
|
Capital Receipts* (1+2) |
1,63,144 |
2,04,887 |
-41,743 |
-20.4 |
| |
|
|
|
|
|
|
1. Non-Debt Capital Receipts |
12,000 |
65,656 |
-53,656 |
-81.7 |
| |
|
|
|
|
|
|
2. Debt Capital Receipts* |
1,51,144 |
1,39,231 |
11,913 |
8.6 |
| |
|
|
|
|
|
|
BE : Budget Estimates. RE : Revised Estimates.
* : Net of issuances under the Market Stabilisation Scheme.
|
I.4.22 Capital receipts are budgeted to decline in 2005-06 from the revised estimates for 2004-05 (Table 1.36). Under non-debt capital receipts, recovery of loans is projected to be lower in 2005-06, mainly reflecting the discontinuance of the DSS.
Pattern of Expenditure
I.4.23 The total expenditure as a proportion to GDP is budgeted to be lower during 2005-06 (Table 1.37).
Table 1.37: Expenditure Pattern of the Centre
| |
|
|
|
|
(Rupees crore) |
| |
|
|
|
|
|
|
|
Item |
|
2005-06 |
2004-05 |
Variation |
| |
|
|
(BE) |
(RE) |
(BE over RE) |
| |
|
|
|
|
Absolute |
Per cent |
| |
|
|
|
|
|
|
|
1 |
|
|
2 |
3 |
4 |
5 |
| |
|
|
|
|
|
|
|
Total Expenditure (1 + 2) |
5,14,344 |
4,73,126 * |
41,218 |
8.7 |
| |
|
|
(14.8) |
(15.2) |
|
|
| |
|
|
|
|
|
|
|
1. |
Non-Plan Expenditure |
3,70,847 |
3,35,739 * |
35,108 |
10.5 |
| |
|
|
(10.7) |
(10.8) |
|
|
| |
i) |
Interest Payments |
1,33,945 |
1,25,905 |
8,040 |
6.4 |
| |
|
|
(3.8) |
(4.1) |
|
|
| |
ii) |
Defence |
83,000 |
77,000 |
6,000 |
7.8 |
| |
|
|
(2.4) |
(2.5) |
|
|
| |
iii) |
Subsidies |
47,432 |
46,514 |
918 |
2.0 |
| |
|
|
(1.4) |
(1.5) |
|
|
| |
iv) |
Grants/loans to States |
34,053 |
15,543 |
18,510 |
119.1 |
| |
|
|
(1.0) |
(0.5) |
|
|
| |
v) |
Other non-Plan |
72,417 |
70,777 |
1,640 |
2.3 |
| |
|
Expenditure |
(2.1) |
(2.3) |
|
|
| |
|
|
|
|
|
|
|
2. |
Plan Expenditure |
1,43,497 |
1,37,387 |
6,110 |
4.4 |
| |
|
|
(4.1) |
(4.4) |
|
|
| |
i) |
Budgetary Support |
1,10,385 |
82,529 |
27,856 |
33.8 |
| |
|
to Central Plan |
(3.2) |
(2.7) |
|
|
| |
ii) |
Central Assistance for |
33,112 |
54,858 |
-21,746 |
-39.6 |
| |
|
State & UT Plans |
(1.0) |
(1.8) |
|
|
| |
|
Grants |
32,612 |
29,856 |
2,756 |
9.2 |
| |
|
Loans |
500 |
25,002 |
-24,502 |
-98.0 |
| |
|
|
|
|
|
|
|
BE: Budget Estimates RE: Revised Estimates.
* : Net of repayments to the NSSF.
Note:Figures in parentheses are percentages to GDP. |
Revenue expenditure is budgeted to record a substantial increase primarily on account of higher devolution of resources to the States in the form of grants rather than loans. On the other hand, the substantial reduction in capital expenditure in 2005-06 would be on account of discontinuance of the DSS and the elimination of the Centre’s loan support for the State Plans as recommended by the TFC.
I.4.24 Subsidies are expected to decline to 1.4 per cent of GDP from 1.5 per cent in 2004-05. Deceleration in food subsidy expenditure is envisaged on account of the proposed policy to undertake procurement of foodgrains on a decentralised basis, especially in the non-traditional States. Fertiliser subsidy would also decelerate and the Union Budget is committed towards further rationalisation after the Working Group’s examination of issues involved in implementing the New Pricing Scheme for fertilisers (Box 1.10).
I.4.25 An analysis of the revenue expenditure indicates that the share of the Plan component would improve to 26.0 per cent from 23.2 per cent in 2004-05 on account of higher allocation for the Central Plan. In the non-Plan revenue expenditure, the combined share of interest payments, defence and subsidies would form 69.6 per cent of the total as compared with 72.9 per cent in 2004-05.
I.4.26 Capital expenditure is budgeted to decrease by 22.1 per cent in 2005-06 as against an increase of 38.1 per cent (excluding repayments to NSSF) in 2004-05. A major policy change affecting the capital expenditure pattern emanates from implementing the recommendations of the TFC whereby the Central Government’s loan support to States’ Plans would be eliminated. Adjusting for the loans to States, capital expenditure is estimated to increase by 9.2 per cent. The growth of capital outlay is budgeted to moderate in 2005-06 from the
Box I.10
Central Government Subsidies
The ';Central Government Subsidies in India: A Report'; brings to the fore policy issues inherent in containing and targeting subsidies to the poor and needy. Key recommendations of the Report and proposals for specific subsidies are:
• A three-tier hierarchy of Government’s social and economic services with the merit category of goods and services to be bifurcated into Merit I and Merit II categories while rest of the goods and services to be residually grouped into non-merit category.
• Subsidising non-merit category requires detailed analysis of user charges and recovery rates.
• Targeting of subsidies directly at the intended beneficiaries by eliminating input subsidies and focusing more on transfers than subsidies.
• Improving transparency and explicitly reporting subsidies in the Budget.
• Avoiding multiple subsidies to serve same policy objective.
Food Subsidies
• Realistic Minimum Support Price (MSP) for foodgrains, especially wheat.
• Specific procurement targets before every sowing season supported by self-financing price insurance system.
• Reimbursement of costs of Food Corporation of India (FCI) on the basis of normative costs and actual quantity.
• Postponement of actual delivery to the actual time of purchase.
• Self-targeting of foodgrain distribution to the poor by subsidising coarse grains, locating the Public Distribution System (PDS) where the poor live and allowing the purchase of PDS grains on a weekly rather than monthly basis.
Fertiliser Subsidies
• A flat rate of explicit subsidy to the urea industry.
• Rationalisation of urea price subsidy.
• Distribution of fertilisers to the targeted farm households through tradable coupons.
Petroleum Subsidies
• Gradual removal of LPG subsidy.
• Channelling of all sales of kerosene through retail markets by encouraging small distributors.
• Coupons for subsidised purchase of kerosene could be distributed to ration cardholders below poverty line.
Reference
1. Government of India (2004), Central Government Subsidies in India: A Report (Prepared with the assistance of the National Institute of Public Finance and Policy), December.
Table 1.38: Capital Expenditure of the Centre
| |
|
|
|
|
| |
|
|
|
|
|
(Rupees crore) |
| |
|
|
|
|
|
|
|
| |
|
|
2005-06 |
2004-05 |
2003-04 |
Growth Rate (per cent) |
| |
|
|
(BE) |
(RE) |
|
|
|
| |
|
|
|
|
|
2005-06 (BE) |
2004-05 (RE) |
| |
|
|
|
|
|
|
|
|
1 |
|
|
2 |
3 |
4 |
5 |
6 |
|
1. |
Capital expenditure (CE) |
67,832 |
1,19,722 |
1,09,228 |
-43.3 |
9.6 |
|
2. |
NSSF Repayments |
0 |
32,665 |
46,211 |
-100.0 |
-29.3 |
|
3. |
CE less NSSF (1-2) |
67,832 |
87,057 |
63,017 |
-22.1 |
38.1 |
|
4. |
Loans and Advances |
5,652 |
30,442 |
28,768 |
-81.4 |
5.8 |
| |
(a) Loans to States |
179 |
25,108 |
22,990 |
-99.3 |
9.2 |
|
5. |
CE net of NSSF and Loans to States (3-4a) |
67,653 |
61,949 |
40,027 |
9.2 |
54.8 |
|
6. |
Capital outlay (3-4) |
62,180 |
56,615 |
34,249 |
9.8 |
65.3 |
|
7. |
Defence Capital |
|
34,375 |
33,483 |
16,863 |
2.7 |
98.6 |
|
8. |
Non-defence Capital outlay (6-7) |
27,805 |
23,132 |
17,386 |
20.2 |
33.0 |
| |
|
|
|
|
|
|
|
|
BE: Budget Estimates. RE: Revised Estimates. |
substantial increase in 2004-05; non-defence capital outlay would show a higher growth than defence capital outlay (Table 1.38).
I.4.27 The sectoral allocation of expenditure indicates the Government’s thrust on rural development through agriculture and universalisation of education. The shares of agriculture and rural development in total expenditure are budgeted to increase in 2005-06 on account of provision made for developing agriculture market infrastructure, establishment of Rural Knowledge Centre and for initiating strategic agricultural research. The increase in the share of health spending reflects higher allocation for financing, inter alia, the National Rural Health Mission (NRHM) which will be launched from 2005-06 (Table 1.39).
Table 1.39: Expenditure on Select Developmental Heads of the Centre
| |
|
|
|
(Rupees crore) |
| |
|
|
|
|
|
Items |
2005-06(BE) |
2004-05 (RE) |
2003-04 |
| |
|
|
|
|
|
1 |
2 |
|
3 |
4 |
| |
|
|
|
|
|
Agriculture |
39,727 |
|
36,614 |
32,900 |
| |
(7.7) |
|
(7.2) |
(7.0) |
|
Education |
15,941 |
|
12,999 |
10,630 |
| |
(3.1) |
|
(2.6) |
(2.3) |
|
Health |
7,907 |
|
6,032 |
4,980 |
| |
(1.5) |
|
(1.2) |
(1.1) |
|
Rural Development |
11,359 |
|
8,525 |
12,138 |
| |
(2.2) |
|
(1.7) |
(2.6) |
|
Irrigation |
425 |
|
323 |
370 |
| |
(0.1) |
|
(0.1) |
(0.1) |
| |
|
|
|
|
|
BE : Budget Estimates. RE :Revised Estimates.
Note: Figures in parentheses are percentages to total
expenditure. |
|
Financing of Gross Fiscal Deficit
I.4.28 Net market borrowings (excluding allocations budgeted under the MSS) would finance 68.7 per cent of the GFD in 2005-06 as compared with 33.0 per cent in the previous year. Draw down of surplus cash balance with the Reserve Bank would finance 2.1 per cent of the GFD as against 15.1 per cent in 2004-05. Securities against small savings, which financed 24.4 per cent of the GFD in 2004-05, are expected to finance only 2.0 per cent, since they largely represented the transactions under the DSS which was discontinued from 2005-06.
I.4.29 The substantial increase in the market borrowings of the Centre budgeted for 2005-06, coupled with the firming up of interest rate conditions, would have implications for interest cost. According to the budget estimates, the average cost of market loans works out to 9.5 per cent in 2005-06 as compared with 9.1 per cent in 2004-05. On the other hand, the average cost of borrowings from other sources is expected to decline in 2005-06.
I.4.30 To conclude, a noteworthy feature of Central Government finances since 2002-03 has been the progressive reduction in key deficit indicators. This has been, inter alia, enabled by attempts to increase the tax base which is reflected in a sustained increase in tax/GDP ratio from 8.8 per cent in 2002-03 to 9.9 per cent in 2004-05 and expected to increase further to 10.6 per cent in 2005-06. Moreover, the surge in economic activity, especially in the industrial sector, has also enabled an improvement in the tax/GDP ratio and the Central Government finances.
Table 1.40: Major Deficit Indicators of State Governments
| |
|
|
|
| |
|
|
|
|
|
|
|
(Rupees crore) |
| |
|
|
|
|
|
|
|
|
|
|
Item |
2005-06 |
2004-05 |
2004-05 |
2003-04 |
2000-03 |
1995-00 |
1990-95 |
Percentage variation |
| |
(BE) |
(RE) |
(BE) |
|
(Average) |
(Average) |
(Average) |
|
|
| |
|
|
|
|
|
|
|
Col.2/3 |
Col.3/4 |
|
1 |
2 |
3 |
4 |
5 |
6 |
7 |
8 |
9 |
10 |
| |
|
|
|
|
|
|
|
|
|
|
Gross Fiscal Deficit |
1,07,041 |
1,19,288 |
1,11,860 |
1,21,420 |
|
|
|
-10.3 |
6.6 |
| |
(3.1) |
(3.8) |
(3.6) |
(4.4) |
(4.2) |
(3.5) |
(2.8) |
|
|
|
Revenue Deficit |
24,494 |
43,190 |
45,090 |
61,238 |
|
|
|
-43.3 |
-4.2 |
| |
(0.7) |
(1.4) |
(1.5) |
(2.2) |
(2.5) |
(1.7) |
(0.7) |
|
|
|
Primary Deficit |
14,666 |
32,142 |
21,475 |
40,660 |
|
|
|
-54.4 |
49.7 |
| |
(0.4) |
(1.0) |
(0.7) |
(1.5) |
(1.5) |
(1.4) |
(1.6) |
|
|
| |
|
|
|
|
|
|
|
|
|
|
RE: Revised Estimates. BE : Budget Estimates.
Note: Figures in parentheses are percentages to GDP. |
STATE BUDGETS - 2005-064
I.4.31 The State budgets for 2005-06 envisage a sharp correction of fiscal imbalances. All the major deficit indicators are budgeted much lower than their levels in the previous year (Table 1.40).
I.4.32 The improvement in the revenue account during 2005-06 is proposed to be brought about mainly by the containment of growth in non-interest revenue expenditure. The growth rate of almost all major developmental heads under revenue expenditure is budgeted to decelerate. Within non-developmental revenue expenditure, the growth rate of interest payments would decelerate, while that of administrative services is expected to increase sharply. Capital outlay is proposed to be enhanced during 2005-06, though as a ratio to GDP, it would remain at the previous year’s level. In the aggregate, the ratio of developmental expenditure to GDP would record a larger decline than that of non-developmental expenditure to GDP during 2005-06 (Table 1.41).
I.4.33 On the receipts side, the ratio of States’ own tax revenue to GDP is expected to show a further, albeit marginal, increase (Table 1.42).
Table 1.41: Expenditure Pattern of State Governments
| |
|
|
|
|
|
|
|
|
(Rupees crore) |
| |
|
|
|
|
|
|
|
|
|
|
|
Item |
2005-06 |
2004-05 |
2004-05 |
2003-04 |
2000-03 |
1995-00 |
1990-95 |
Percentage |
variation |
| |
|
(BE) |
(RE) |
(BE) |
|
(Average) |
(Average) |
(Average) |
|
|
| |
|
|
|
|
|
|
|
|
Col.2/3 |
Col.3/4 |
| |
|
|
|
|
|
|
|
|
|
|
|
1 |
|
2 |
3 |
4 |
5 |
6 |
7 |
8 |
9 |
10 |
|
Total Expenditure |
5,67,835 |
5,84,073 |
5,44,071 |
5,16,350 |
|
|
|
-2.8 |
7.4 |
|
(1+2 =3+4+5) |
(16.3) |
(18.8) |
(17.5) |
(18.7) |
(16.7) |
(15.3) |
(16.0) |
|
|
|
1. |
Revenue Expenditure |
4,45,818 |
4,20,322 |
4,12,459 |
3,70,468 |
|
|
|
6.1 |
1.9 |
| |
of which |
(12.8) |
(13.5) |
(13.3) |
(13.4) |
(13.8) |
(12.6) |
(12.8) |
|
|
| |
Interest Payments |
92,375 |
87,147 |
90,384 |
80,760 |
|
|
|
6.0 |
-3.6 |
| |
|
(2.7) |
(2.8) |
(2.9) |
(2.9) |
(2.7) |
(2.0) |
(1.7) |
|
|
|
2. |
Capital Expenditure |
1,22,017 |
1,63,751 |
1,31,612 |
1,45,883 |
|
|
|
-25.5 |
24.4 |
| |
of which |
(3.5) |
(5.3) |
(4.2) |
(5.3) |
(2.9) |
(2.7) |
(3.2) |
|
|
| |
Capital outlay |
74,655 |
65,519 |
58,812 |
50,956 |
|
|
|
13.9 |
11.4 |
| |
|
(2.1) |
(2.1) |
(1.9) |
(1.8) |
(1.5) |
(1.4) |
(1.6) |
|
|
|
3. |
Development Expenditure |
3,16,793 |
3,07,425 |
2,81,733 |
2,74,080 |
|
|
|
3.0 |
9.1 |
| |
|
(9.1) |
(9.9) |
(9.1) |
(9.9) |
(9.6) |
(9.6) |
(10.8) |
|
|
|
4. |
Non-Development Expenditure |
2,08,264 |
1,90,679 |
1,97,247 |
1,66,074 |
|
|
|
9.2 |
-3.3 |
| |
|
(6.0) |
(6.1) |
(6.4) |
(6.0) |
(6.0) |
(4.9) |
(4.3) |
|
|
|
5. |
Others |
42,779 |
85,969 |
65,091 |
76,196 |
|
|
|
-50.2 |
32.1 |
| |
|
(1.2) |
(2.8) |
(2.1) |
(2.8) |
(1.2) |
(0.7) |
(0.9) |
|
|
| |
|
|
|
|
|
|
|
|
|
|
|
RE: Revised Estimates. BE: Budget Estimates.
Note : Figures in parentheses are percentages to GDP. |
4 The analysis of State Finances for 2005-06 (Budget Estimates) is based on the Budget documents of 28 State Governments, of which 2 are Vote-on-Accounts. All data are provisional.
Table 1.42: Aggregate Receipts of State Governments
| |
|
|
|
|
|
|
| |
|
|
|
|
|
|
|
|
|
|
(Rupees Crore) |
| |
|
|
|
|
|
|
|
|
|
|
|
|
|
Item |
|
|
2005-06 |
2004-05 |
2004-05 |
2003-04 |
2000-03 |
1995-00 |
1990-95 |
Percentage |
variations |
| |
|
|
|
(BE) |
(RE) |
(BE) |
|
(Average) |
(Average) |
(Average) |
|
|
| |
|
|
|
|
|
|
|
|
|
|
Col.2/3 |
Col.3/4 |
|
1 |
|
|
|
2 |
3 |
4 |
5 |
6 |
7 |
8 |
9 |
10 |
| |
|
|
|
|
|
|
|
|
|
|
|
|
|
Aggregate Receipts (1+2) |
|
5,70,479 |
5,78,069 |
5,41,450 |
5,17,563 |
|
|
|
-1.3 |
6.8 |
| |
|
|
|
(16.4) |
(18.6) |
(17.4) |
(18.8) |
(16.8) |
(15.2) |
(16.1) |
|
|
|
1. |
Total Revenue Receipts |
(a+b) |
4,21,324 |
3,77,132 |
3,67,369 |
3,09,230 |
|
|
|
11.7 |
2.7 |
| |
|
|
|
(12.1) |
(12.1) |
(11.8) |
(11.2) |
(11.3) |
(10.9) |
(12.1) |
|
|
| |
(a) |
States own Revenue |
2,57,383 |
2,33,449 |
2,31,392 |
1,94,807 |
|
|
|
10.3 |
0.9 |
| |
|
|
|
(7.4) |
(7.5) |
(7.5) |
(7.1) |
(7.2) |
(6.9) |
(7.3) |
|
|
| |
|
States Own Tax |
|
2,12,353 |
1,85,494 |
1,83,085 |
1,57,691 |
|
|
|
14.5 |
1.3 |
| |
|
|
|
(6.1) |
(6.0) |
(5.9) |
(5.7) |
(5.7) |
(5.3) |
(5.4) |
|
|
| |
|
States Own Non-Tax |
45,030 |
47,955 |
48,307 |
37,116 |
|
|
|
-6.1 |
-0.7 |
| |
|
|
|
(1.3) |
(1.5) |
(1.6) |
(1.3) |
(1.5) |
(1.6) |
(1.8) |
|
|
| |
(b) |
Central Transfers |
|
1,63,942 |
1,43,683 |
1,35,977 |
1,14,423 |
|
|
|
14.1 |
5.7 |
| |
|
|
|
(4.7) |
(4.6) |
(4.4) |
(4.1) |
(4.1) |
(4.0) |
(4.9) |
|
|
| |
|
Shareable Taxes |
|
87,160 |
77,800 |
75,770 |
64,915 |
|
|
|
12.0 |
2.7 |
| |
|
|
|
(2.5) |
(2.5) |
(2.4) |
(2.4) |
(2.3) |
(2.4) |
(2.6) |
|
|
| |
|
Central Grants |
|
76,782 |
65,883 |
60,208 |
49,508 |
|
|
|
16.5 |
9.4 |
| |
|
|
|
(2.2) |
(2.1) |
(1.9) |
(1.8) |
(1.8) |
(1.6) |
(2.3) |
|
|
|
2. |
Capital Receipts (a+b) |
|
1,49,155 |
2,00,937 |
1,74,081 |
2,08,333 |
|
|
|
-25.8 |
15.4 |
| |
|
|
|
(4.3) |
(6.5) |
(5.6) |
(7.5) |
(5.5) |
(4.2) |
(4.0) |
|
|
| |
(a) |
Loans from Centre@ |
32,203 |
32,683 |
33,018 |
25,752 |
|
|
|
-1.5 |
-1.0 |
| |
|
|
|
(0.9) |
(1.1) |
(1.1) |
(0.9) |
(1.0) |
(1.0) |
(1.2) |
|
|
| |
(b) |
Other Capital Receipts |
1,16,953 |
1,68,254 |
1,41,063 |
1,82,582 |
|
|
|
-30.5 |
19.3 |
| |
|
|
|
(3.4) |
(5.4) |
(4.5) |
(6.6) |
(4.4) |
(3.2) |
(2.9) |
|
|
| |
|
|
|
|
|
|
|
|
|
|
|
|
|
BE: Budget Estimates. RE: Revised Estimates.
@With the change in the system of accounting with effect from 1999-2000, States' share in small savings which was
included earlier under loans from Centre is included under internal debt and shown as special securities issued to National
Small Saving Fund (NSSF) of the Central Government. The data for the years prior to 1999-2000 as reported in this Table,
however, exclude loans against small savings, for the purpose of comparability.
Note : Figures in parentheses are percentages to GDP. |
I.4.34 The implementation of VAT by 20 State Governments with effect from April 1, 2005 (apart from Haryana which had introduced VAT in April 2003) would have an important bearing on the growth rate of States’ own tax revenues during the year. The implementation of VAT follows the release of a White Paper on the subject by the Empowered Committee of State Finance Ministers (Box 1.11). The Union
Box 1.11
White Paper on State-Level Value Added Tax: Salient Features
The Empowered Committee of State Finance Ministers (Convenor: Dr. Asim Kumar Dasgupta) was constituted by the Ministry of Finance, Government of India in November 1999 for laying down the broad contours for introducing State-level Value Added Tax (VAT). The Committee released ';A White Paper on State-level VAT'; in January 2005. The White Paper incorporates the justification and background for switching over to VAT, delineates its main design and addresses key related issues.
In general, all goods would be covered under VAT, excepting a few whose prices are not fully market determined which would continue to be taxed under the existing Sales Tax Act or by making special provisions in the VAT Act. There would be only two basic VAT rates: 4 per cent and 12.5 per cent covering 550 goods. There would be a category of 46 tax-exempted goods comprising natural and unprocessed products in the unorganised sector and a few commodities which are of local social importance for individual States. Another special VAT rate of 1 per cent is for gold and silver ornaments. The 4 per cent rate category would comprise items of basic necessities such as medicines and drugs, all agricultural and industrial inputs, capital goods and declared goods. The remaining commodities will fall under the general VAT rate of 12.5 per cent. On items presently attracting additional excise duties, viz., sugar, textile and tobacco, VAT will not be imposed for one year and will be reviewed thereafter.
The White Paper indicates the need for phasing out the Central Sales Tax (CST) and adequate compensation from the Government of India. The CST would be reviewed during 2005-06. In this regard, the Taxation Information Exchange System is being set up. Acknowledging the possibility of revenue loss due to VAT in the initial years, the Government of India has agreed to compensate the States for the loss up to 100 per cent in the first year, 75 per cent in the second year and 50 per cent in the third year.
Table 1.43: Decomposition and Financing Pattern of the Gross Fiscal Deficit of States
| |
|
|
| |
|
|
|
|
|
|
|
(Per cent) |
| |
|
|
|
|
|
|
|
|
|
Item |
2005-06 |
2004-05 |
2004-05 |
2003-04 |
2000-03 |
1995-00 |
1990-95 |
| |
|
(BE) |
(RE) |
(BE) |
|
(Average) |
(Average) |
(Average) |
| |
|
|
|
|
|
|
|
|
|
1 |
|
2 |
3 |
4 |
5 |
6 |
7 |
8 |
|
Decomposition (1+2+3) |
100.0 |
100.0 |
100.0 |
100.0 |
100.0 |
100.0 |
100.0 |
|
1. |
Revenue Deficit |
22.9 |
36.2 |
40.3 |
50.4 |
58.5 |
44.7 |
24.7 |
|
2. |
Capital Outlay |
69.7 |
54.9 |
52.6 |
42.0 |
34.7 |
43.2 |
55.3 |
|
3. |
Net Lending |
7.4 |
8.9 |
7.1 |
7.6 |
6.8 |
12.1 |
20.0 |
| |
|
|
|
|
|
|
|
|
|
Financing (1+2+3+4+5) |
100.0 |
100.0 |
100.0 |
100.0 |
100.0 |
100.0 |
100.0 |
|
1. |
Small Savings * |
52.9 |
67.6 |
56.3 |
54.6 |
41.6 |
5.8 |
– |
|
2. |
Market Borrowings |
15.3 |
27.3 |
24.3 |
38.6 |
18.6 |
16.1 |
16.0 |
|
3. |
State Provident Fund |
7.3 |
7.9 |
9.3 |
5.7 |
9.2 |
13.4 |
14.3 |
|
4. |
Central Loans |
13.9 |
-18.7 |
-7.8 |
-26.7 |
6.6 |
40.6 |
49.0 |
|
5. |
Others |
10.6 |
15.9 |
17.9 |
27.8 |
24.0 |
24.0 |
20.7 |
| |
|
|
|
|
|
|
|
|
|
BE: Budget Estimates. RE: Revised Estimates. – : Not applicable.
* : Denotes loans against securities issued to the National Small Savings Fund (NSSF) |
Government has reiterated its promise of compensating the revenue loss incurred by the States following the implementation of VAT and has, accordingly, provided Rs.5,000 crore for this purpose in its Budget for 2005-06. Some States have, however, indicated that the expected revenue from VAT during 2005-06 would be higher than from the erstwhile Sales Tax.
I.4.35 The States’ own non-tax revenues, as a ratio to GDP, are expected to decline in 2005-06, mainly as a result of a sharp decline in interest receipts. Current transfers from the Centre, as a ratio to GDP, are budgeted to increase marginally to 4.7 per cent from 4.6 per cent in 2004-05. According to the Union Budget for 2005-06, the total impact of the recommendations of the TFC on the Centre (and as a mirror image, on the States) for the year 2005-06 would be Rs.26,000 crore. States are likely to gain from higher tax devolution, enhanced grants as well as the debt relief schemes.
I.4.36 Small savings and market borrowings of the State Governments are budgeted to finance a lower proportion of the GFD during 2005-06 (Table 1.43). Loans from the Centre, which showed net repayment during the previous three years, are budgeted to finance a considerable proportion of the States’ borrowings requirements.
I.4.37 There are wide variations in the data on various heads of devolution and transfers as recommended by the TFC (and accepted by the Centre) and those reported by the State budgets. For instance, the TFC had recommended the elimination of the loan component of Central assistance for State Plans with effect from 2005-06. Accordingly, the Union Budget for 2005-06 has not made provision for Central loans for State Plans and instead, has indicated that the States would have to mobilise Rs.29,003 crore directly from the market for financing their Annual Plans. Notwithstanding this, Central Plan loans to States have been placed at Rs.32,203 crore in the State budgets. Gross market borrowings and loans from banks and financial institutions have been placed at Rs.21,026 crore and Rs.6,278 crore, respectively. Incorporating the net Central loans for State Plans as reported in the Union Budget 2005-06 and assuming that the State Plans are maintained at the budgeted level, the market borrowings during 2005-06 would not be substantially higher than the budgeted level on account of higher devolution of taxes and grants as envisaged in the Union Budget in accordance with the TFC recommendations and larger receipts from NSSF.
Combined Budgets for 2005-06
I.4.38 The renewed thrust on fiscal consolidation at the Centre as well as at the State level is manifested in the budgeted reductions in all the key deficit indicators in terms of GDP; the revenue deficit and primary deficit are budgeted to decline even in absolute terms (Table 1.44). The reduction in deficits is sought through buoyancy in tax collections coupled with deceleration in expenditure.
I.4.39 Revenue receipts are budgeted to increase solely on account of improved tax collections (Table 1.45). The combined tax-GDP ratio is, therefore, budgeted to improve to 16.5 per cent of GDP in 2005-06 from 15.8 per cent in 2004-05. On the other hand, non-tax revenue is projected to decline by 6.5 per
Table 1.44: Measures of Deficit of the Central and State Governments
| |
|
|
| |
|
|
|
|
|
(Rupees crore) |
| |
|
|
|
|
|
|
|
Year |
|
|
|
Per cent to GDP |
|
| |
Gross Fiscal Deficit |
Revenue Deficit |
Primary Deficit |
Gross Fiscal Deficit |
Revenue Deficit |
Primary Deficit |
| |
|
|
|
|
|
|
|
1 |
2 |
3 |
4 |
5 |
6 |
7 |
|
1990-91 |
53,580 |
23,871 |
28,585 |
9.4 |
4.2 |
5.0 |
|
1995-96 |
77,671 |
37,932 |
18,598 |
6.5 |
3.2 |
1.6 |
|
2000-01 |
1,99,852 |
1,38,803 |
75,035 |
9.6 |
6.6 |
3.6 |
|
2001-02 |
2,26,425 |
1,59,350 |
84,039 |
10.0 |
7.0 |
3.7 |
|
2002-03 |
2,34,987 |
1,62,990 |
76,363 |
9.5 |
6.6 |
3.1 |
|
2003-04 |
2,32,852 |
1,59,500 |
56,282 |
8.4 |
5.8 |
2.0 |
|
2004-05 BE |
2,45,954 |
1,21,261 |
55,508 |
7.9 |
3.9 |
1.8 |
|
2004-05 RE |
2,58,082 |
1,28,355 |
69,543 |
8.3 |
4.1 |
2.2 |
|
2005-06 BE |
2,67,872 |
1,19,806 |
59,701 |
7.7 |
3.4 |
1.7 |
| |
|
|
|
|
|
|
|
BE: Budget Estimates. RE: Revised Estimates.
Note: Data in respect of the States are provisional from 2003-04 onwards and relate to 28 States. |
cent mainly on account of interest receipts. On the expenditure side, the share of developmental expenditure is budgeted to decline during 2005-06 to 51.1 per cent of total expenditure.
I.4.40 Market borrowings are budgeted to finance a higher part of the combined gross fiscal deficit during
Table 1.45: Combined Receipts and Disbursement of the Centre and States
| |
|
|
|
|
(Rupees crore) |
| |
|
|
|
|
|
|
|
Item |
|
2005-06 |
2004-05 |
Variation |
| |
|
|
(BE) |
(RE) |
(BE over RE) |
| |
|
|
|
|
|
|
| |
|
|
|
|
Amount |
Per cent |
| |
|
|
|
|
|
|
|
1 |
|
|
2 |
3 |
4 |
5 |
| |
|
|
|
|
|
|
|
I. |
Total Receipts (A+B) |
9,94,604 |
9,40,127 |
54,477 |
5.8 |
| |
|
|
(28.6) |
(30.3) |
|
|
| |
A. |
Revenue Receipts |
|
|
|
|
| |
|
(1+2) |
6,92,350 |
6,16,747 |
75,603 |
12.3 |
| |
|
1. Tax Receipts |
5,72,979 |
4,89,098 |
83,881 |
17.2 |
| |
|
a) Direct Taxes |
1,97,164 |
1,56,036 |
41,128 |
26.4 |
| |
|
b) Indirect Taxes |
3,75,815 |
3,33,062 |
42,753 |
12.8 |
| |
|
2. Non-Tax Receipts 1,19,371 |
1,27,649 |
-8,278 |
-6.5 |
| |
B. |
Capital Receipts |
3,02,254 |
3,23,380 |
-21,126 |
-6.5 |
|
II. |
Total Disbursements* |
9,67,852 |
8,92,803 |
75,049 |
8.4 |
| |
(A+B) |
(27.8) |
(28.7) |
|
|
| |
A. |
Developmental |
|
|
|
|
| |
|
Expenditure |
4,94,238 |
4,63,722 |
30,516 |
6.6 |
| |
B. |
Non-Developmental |
|
|
|
|
| |
|
Expenditure |
|
|
|
|
| |
|
(Including others*) |
4,73,614 |
4,29,081 |
44,533 |
10.4 |
| |
|
|
|
|
|
|
|
RE: Revised Estimates. BE : Budget Estimates. * : Exclude repayments.
Note : 1. Figures in parentheses are percentages to GDP.
2. Data in respect of the States are provisional and relate to 28 States. |
2005-06 than in 2004-05. The share of small savings and State provident funds is expected to remain broadly stable while recourse to other sources of finance including draw down of Centre’s cash balances is budgeted to come down (Table 1.46).
Social Sector Expenditure
I.4.41 The social sector expenditure of the Centre and the State Governments mainly consists of outlays on health, education and rural development. It has been widely recognised that the level of social sector expenditure has important implications for long-term growth prospects of the economy. The Government’s spending on social sectors has,
Table 1.46: Financing of Gross Fiscal Deficit of the Centre and States
| |
|
|
|
|
|
(Rupees crore) |
| |
|
|
|
|
|
|
|
|
Year |
|
Market |
State |
Small |
External |
Others |
Gross |
| |
Borrowings |
Provident |
Savings |
Borrow- |
|
Fiscal |
| |
|
|
Fund |
|
ings |
|
Deficit |
| |
|
|
|
|
|
|
|
|
1 |
|
2 |
3 |
4 |
5 |
6 |
7 |
| |
|
|
|
|
|
|
|
|
2003-04 |
1,35,709 |
11,824 |
81,408 |
-13,488 |
17,399 |
2,32,852 |
| |
|
(58.3) |
(5.1) |
(35.3) |
(-5.8) |
(7.5) |
(100.0) |
|
2004-05 |
1,17,576 |
14,244 |
70,000 |
8,077 |
36,057 |
2,45,954 |
|
BE |
|
(47.8) |
(5.8) |
(28.7) |
(3.3) |
(14.7) |
(100.0) |
|
2004-05 |
78,488 |
13,450 |
85,000 |
9,035 |
72,109 |
2,58,082 |
|
RE |
|
(30.4) |
(5.2) |
(33.1) |
(3.5) |
(27.9) |
(100.0) |
|
2005-06 |
1,20,158 |
12,765 |
90,000 |
9,656 |
35,293 |
2,67,872 |
|
BE |
|
(44.9) |
(4.8) |
(33.9) |
(3.6) |
(13.2) |
(100.0) |
| |
|
|
|
|
|
|
|
|
BE : Budget Estimates. RE : Revised Estimates.
Note:1.Figures in parentheses are percentages to GFD.
2.Data in respect of the States are provisional and relate to
28 States. |
Table 1.47: Combined Expenditure of the Centre and States on Social Sector
| |
|
|
(Rupees crore) |
| |
|
|
|
|
| |
2005-06 |
2004-05 |
2004-05 |
2003-04 |
| |
(BE) |
(RE) |
(BE) |
|
| |
|
|
|
|
|
1 |
2 |
3 |
4 |
5 |
|
Expenditure on |
|
|
|
|
|
Social Sector* |
2,60,227 |
2,38,018 |
2,23,517 |
2,06,543 |
|
of which: |
|
|
|
|
|
Social Services |
2,00,482 |
1,82,582 |
1,71,157 |
1,53,995 |
|
of which: |
|
|
|
|
|
i) Education |
97,152 |
87,962 |
83,939 |
79,833 |
|
ii) Medical & |
|
|
|
|
|
Public Health |
45,122 |
40,509 |
39,657 |
34,083 |
| |
|
|
|
|
| |
Per cent to GDP |
|
|
|
Expenditure |
|
|
|
|
|
on Social Sector |
7.5 |
7.7 |
7.2 |
7.5 |
|
of which: |
|
|
|
|
|
Social Services |
5.8 |
5.9 |
5.5 |
5.6 |
|
of which: |
|
|
|
|
|
i) Education |
2.8 |
2.8 |
2.7 |
2.9 |
|
ii) Medical & |
|
|
|
|
|
Public Health |
1.3 |
1.3 |
1.3 |
1.2 |
| |
Per cent to Total Expenditure |
|
|
Expenditure |
|
|
|
|
|
on Social Sector |
26.9 |
26.7 |
25.8 |
26.2 |
|
of which: |
|
|
|
|
|
Total Social Services |
20.7 |
20.5 |
19.8 |
19.6 |
|
of which: |
|
|
|
|
|
i) Education |
10.0 |
9.9 |
9.7 |
10.1 |
|
ii) Medical & |
|
|
|
|
|
Public Health |
4.7 |
4.5 |
4.6 |
4.3 |
| |
|
|
|
|
|
* : Expenditure on Social Sector includes expenditure
on social services, rural development and food subsidies.
Note : Data in respect of the States are provisional and
relate to 28 States. |
however, remained low over time. Although some improvement was witnessed in 2004-05, social sector expenditure is budgeted to decline to 7.5 per cent of GDP in 2005-06 (Table 1.47).
I.4.42 To conclude, combined finances of the Centre and States envisage a further reduction in key deficit indicators during 2005-06 enabled by buoyancy in tax collections as well as deceleration in expenditure. The Union Budget for 2005-06 seeks to continue with the process of fiscal consolidation while aiming to build the spirit of cooperative fiscal federalism through higher devolution of resources to States. Fiscal policy is premised on tax reforms and expenditure management with emphasis on outcomes than mere outlays. State Budgets for 2005-06 also envisage substantial fiscal correction through containment of non-interest revenue expenditure.
V. FINANCIAL MARKETS
I.5.1 Financial markets operated in an environment of uncertainty worldwide. The upturn in the interest rate cycle, threat of sharp currency movements emanating from large and growing global macroeconomic imbalances and high and volatile international crude oil prices were major sources of risk. Investor appetite for both mature and emerging markets, nevertheless, remained strong but for a brief lull in the second quarter of 2004-05.
I.5.2 Domestic financial markets remained broadly stable during 2004-05 facilitated by the Reserve Bank’s liquidity management. Money markets continued to be guided by the policy reverse repo rate, barring occasional spells of tight liquidity. The foreign exchange market remained orderly despite the ebbing of capital flows during May-October 2004 and the rise in demand for foreign exchange due to higher oil prices. Yields in the Government securities market hardened in consonance with higher credit off-take, a resurgence of inflationary pressures in the first two quarters of the year and the hardening of international interest rates. After a setback in May 2004, the equity markets staged a strong rally in the second half of 2004-05 (Table 1.48).
INTERNATIONAL FINANCIAL MARKETS
I.5.3 Money market rates firmed up in some economies as leading central banks, including the US Federal Reser ve, began to reverse their accommodative monetary policy stance in response to inflationary pressures (Table 1.49). In other countries/areas such as the UK and the Euro area, however, short-term interest rates reversed their rising trend during the first quarter of 2005-06 in the face of a weakening of economic activity.
I.5.4 Gover nment bond yields in advanced economies firmed up during April-August 2004 as inflation began to climb up on account of a spurt in fuel and other key commodity prices. A correction set in after September 2004 as inflationar y expectations eased with the levelling off of commodity price inflation (Chart I.24). A higher demand for gilts was also engendered by expectations that monetary authorities would be restrained from tightening monetary conditions further because of the fragility of the economic recovery in many economies, on the one hand, and the demand for fixed income products from baby boomers approaching retirement, on the other. As a result, the yield curve has been flattening in
|