|
Table 1.47: Combined Expenditure of the Centre and States on Social Sector
| |
|
|
(Rupees crore) |
| |
|
|
|
|
| |
2005-06 |
2004-05 |
2004-05 |
2003-04 |
| |
(BE) |
(RE) |
(BE) |
|
| |
|
|
|
|
|
1 |
2 |
3 |
4 |
5 |
|
Expenditure on |
|
|
|
|
|
Social Sector* |
2,60,227 |
2,38,018 |
2,23,517 |
2,06,543 |
|
of which: |
|
|
|
|
|
Social Services |
2,00,482 |
1,82,582 |
1,71,157 |
1,53,995 |
|
of which: |
|
|
|
|
|
i) Education |
97,152 |
87,962 |
83,939 |
79,833 |
|
ii) Medical & |
|
|
|
|
|
Public Health |
45,122 |
40,509 |
39,657 |
34,083 |
| |
|
|
|
|
| |
Per cent to GDP |
|
|
|
Expenditure |
|
|
|
|
|
on Social Sector |
7.5 |
7.7 |
7.2 |
7.5 |
|
of which: |
|
|
|
|
|
Social Services |
5.8 |
5.9 |
5.5 |
5.6 |
|
of which: |
|
|
|
|
|
i) Education |
2.8 |
2.8 |
2.7 |
2.9 |
|
ii) Medical & |
|
|
|
|
|
Public Health |
1.3 |
1.3 |
1.3 |
1.2 |
| |
Per cent to Total Expenditure |
|
|
Expenditure |
|
|
|
|
|
on Social Sector |
26.9 |
26.7 |
25.8 |
26.2 |
|
of which: |
|
|
|
|
|
Total Social Services |
20.7 |
20.5 |
19.8 |
19.6 |
|
of which: |
|
|
|
|
|
i) Education |
10.0 |
9.9 |
9.7 |
10.1 |
|
ii) Medical & |
|
|
|
|
|
Public Health |
4.7 |
4.5 |
4.6 |
4.3 |
| |
|
|
|
|
|
* : Expenditure on Social Sector includes expenditure on social
services, rural development and food subsidies.
Note : Data in respect of the States are provisional and relate to 28 States. |
however, remained low over time. Although some improvement was witnessed in 2004-05, social sector expenditure is budgeted to decline to 7.5 per cent of GDP in 2005-06 (Table 1.47).
I.4.42 To conclude, combined finances of the Centre and States envisage a further reduction in key deficit indicators during 2005-06 enabled by buoyancy in tax collections as well as deceleration in expenditure. The Union Budget for 2005-06 seeks to continue with the process of fiscal consolidation while aiming to build the spirit of cooperative fiscal federalism through higher devolution of resources to States. Fiscal policy is premised on tax reforms and expenditure management with emphasis on outcomes than mere outlays. State Budgets for 2005-06 also envisage substantial fiscal correction through containment of non-interest revenue expenditure.
V. FINANCIAL MARKETS
I.5.1 Financial markets operated in an environment of uncertainty worldwide. The upturn in the interest rate cycle, threat of sharp currency movements emanating from large and growing global macroeconomic imbalances and high and volatile international crude oil prices were major sources of risk. Investor appetite for both mature and emerging markets, nevertheless, remained strong but for a brief lull in the second quarter of 2004-05.
I.5.2 Domestic financial markets remained broadly stable during 2004-05 facilitated by the Reserve Bank’s liquidity management. Money markets continued to be guided by the policy reverse repo rate, barring occasional spells of tight liquidity. The foreign exchange market remained orderly despite the ebbing of capital flows during May-October 2004 and the rise in demand for foreign exchange due to higher oil prices. Yields in the Government securities market hardened in consonance with higher credit off-take, a resurgence of inflationary pressures in the first two quarters of the year and the hardening of international interest rates. After a setback in May 2004, the equity markets staged a strong rally in the second half of 2004-05 (Table 1.48).
INTERNATIONAL FINANCIAL MARKETS
I.5.3 Money market rates firmed up in some economies as leading central banks, including the US Federal Reser ve, began to reverse their accommodative monetary policy stance in response to inflationary pressures (Table 1.49). In other countries/areas such as the UK and the Euro area, however, short-term interest rates reversed their rising trend during the first quarter of 2005-06 in the face of a weakening of economic activity.
I.5.4 Gover nment bond yields in advanced economies firmed up during April-August 2004 as inflation began to climb up on account of a spurt in fuel and other key commodity prices. A correction set in after September 2004 as inflationar y expectations eased with the levelling off of commodity price inflation (Chart I.24). A higher demand for gilts was also engendered by expectations that monetary authorities would be restrained from tightening monetary conditions further because of the fragility of the economic recovery in many economies, on the one hand, and the demand for fixed income products from baby boomers approaching retirement, on the other. As a result, the yield curve has been flattening in
Table 1.48: Domestic Financial Markets at a Glance
|
Month |
Call Money |
Govt. Securities |
|
Foreign Exchange |
|
Liquidity Management |
|
Equity |
|
| |
|
|
|
|
|
|
|
|
|
|
|
|
|
|
|
| |
Average |
Average |
10-year |
Turnover |
Average |
Average |
RBI's |
Average |
MSS |
Average |
Average |
Average |
Average |
Average |
| |
Daily |
|
Call |
Yield@ |
in Govt. |
Daily |
Exchange |
Net |
Forward |
Outstanding |
Daily |
Daily |
Daily |
BSE |
S & P |
| |
Turnover |
Rates* (Per cent) |
Securities |
Inter- |
Rate |
Foreign |
Premia |
(Rupees |
Reverse |
BSE |
NSE |
Sensex** |
CNX |
| |
(Rupees |
(Per cent) |
|
(Rupees |
bank |
(Rs. per |
Currency |
3-month |
crore) |
Repo |
Turnover |
Turnover |
|
Nifty** |
| |
crore) |
|
|
|
crore)# |
Turnover |
US $) |
Sales(-)/ |
(Per cent) |
|
(LAF) |
(Rupees |
(Rupees |
|
|
| |
|
|
|
|
|
(US $ |
Purchases(+) |
|
Outstanding |
crore) |
crore) |
|
|
| |
|
|
|
|
|
million) |
|
(US $ |
|
|
(Rupees |
|
|
|
|
| |
|
|
|
|
|
|
|
million) |
|
|
crore) |
|
|
|
|
| |
|
|
|
|
|
|
|
|
|
|
|
|
|
|
|
|
1 |
2 |
|
3 |
4 |
5 |
6 |
7 |
8 |
9 |
10 |
11 |
12 |
13 |
14 |
15 |
|
2004-05 |
|
|
|
|
|
|
|
|
|
|
|
|
|
|
|
|
April |
12,916 |
|
4.29 |
5.14 |
3,00,864 |
10,302 |
43.93 |
7,427 |
-0.36 |
22,851 |
75,006 |
2,243 |
5,048 |
5809 |
1848 |
|
May |
10,987 |
|
4.30 |
5.29 |
1,92,264 |
8,882 |
45.25 |
-220 |
-1.33 |
30,701 |
74,502 |
2,188 |
4,710 |
5205 |
1640 |
|
June |
10,973 |
|
4.35 |
5.81 |
1,75,802 |
7,847 |
45.51 |
-413 |
0.93 |
37,812 |
61,981 |
1,681 |
3,859 |
4824 |
1506 |
|
July |
8,632 |
|
4.31 |
6.18 |
1,30,400 |
7,756 |
46.04 |
-1,180 |
2.25 |
46,206 |
59,594 |
1,793 |
4,265 |
4973 |
1568 |
|
August |
11,562 |
|
4.41 |
6.16 |
1,29,373 |
5,974 |
46.34 |
-876 |
2.85 |
51,635 |
42,692 |
1,736 |
3,948 |
5144 |
1615 |
|
September |
17,088 |
|
4.45 |
6.23 |
1,75,635 |
7,348 |
46.09 |
19 |
2.20 |
52,255 |
31,589 |
1,800 |
4,023 |
5423 |
1692 |
|
October |
16,667 |
|
4.63 |
6.89 |
1,12,709 |
7,262 |
45.78 |
-99 |
2.87 |
55,087 |
10,805 |
1,730 |
3,785 |
5702 |
1795 |
|
November |
13,820 |
|
5.62 |
7.18 |
78,225 |
9,930 |
45.13 |
3,792 |
2.16 |
51,872 |
-5,066 |
1,786 |
4,102 |
5961 |
1874 |
|
December |
19,527 |
|
5.28 |
6.57 |
1,33,447 |
9,447 |
43.98 |
1,393 |
2.03 |
53,481 |
7,570 |
2,183 |
5,026 |
6394 |
2022 |
|
January |
16,534 |
|
4.72 |
6.69 |
1,10,535 |
9,114 |
43.75 |
0 |
2.50 |
54,499 |
18,721 |
2,310 |
5,249 |
6307 |
1978 |
|
February |
16,041 |
|
4.76 |
6.45 |
1,29,917 |
11,583 |
43.68 |
4,974 |
1.99 |
60,835 |
19,895 |
2,484 |
4,999 |
6595 |
2067 |
|
March |
15,293 |
|
4.72 |
6.65 |
87,892 |
11,286 |
43.69 |
6,030 |
1.82 |
64,211 |
29,809 |
2,706 |
5,139 |
6679 |
2096 |
| |
|
|
|
|
|
|
|
|
|
|
|
|
|
|
|
|
2005-06 |
|
|
|
|
|
|
|
|
|
|
|
|
|
|
|
|
April |
17,213 |
|
4.77 |
7.31 |
90,040 |
9,880 |
43.74 |
0 |
1.96 |
67,087 |
30,675 |
1,890 |
4,136 |
6379 |
1987 |
|
May |
15,269 |
|
4.99 |
6.97 |
1,17,969 |
10,083 |
43.49 |
0 |
1.57 |
69,016 |
22,754 |
1,971 |
3,946 |
6483 |
2002 |
|
June |
20,135 |
|
5.10 |
6.89 |
2,04,197 |
10,871 |
43.58 |
-107 |
1.40 |
71,681 |
13,916 |
2,543 |
4,843 |
6926 |
2134 |
|
July |
20,046 |
|
5.02 |
7.01 |
1,14,634 |
n.a. |
43.54 |
n.a. |
1.56 |
68,765 |
10,754 |
3,095 |
6,150 |
7337 |
2237 |
|
* : Average of daily weighted call money borrowing rates.
# : Outright turnover in Central Government dated securities during the month.
@ : End-Month. **: Average of daily closing indices. MSS : Market Stabilisation Scheme. LAF :Liquidity Adjustment Facility.
BSE : The Stock Exchange, Mumbai. NSE : National Stock Exchange of India Ltd. n.a. : Not available. |
advanced countries. In the US, the 10-year Treasury yield at 3.8 per cent reached at a 14-month low in early-June 2005. Japanese 10-year bond yields and
Table 1.49: Short-term Interest Rates
| |
|
|
(Per cent) |
| |
|
|
|
|
Country |
July 2005 |
March 2005 |
March 2004 |
| |
|
|
|
|
1 |
2 |
3 |
4 |
|
Advanced Economies |
|
|
|
|
US |
3.49 |
2.90 |
1.04 |
|
UK |
4.56 |
4.95 |
4.31 |
|
Euro Area |
2.13 |
2.15 |
1.96 |
|
Japan |
0.02 |
0.02 |
0.03 |
|
Sweden |
1.45 |
1.97 |
2.12 |
|
Emerging Market Economies |
|
|
|
China |
2.00 |
2.25 |
n.a. |
|
Hong Kong |
3.54 |
2.79 |
0.17 |
|
South Korea |
3.49 |
3.54 |
3.90 |
|
Argentina |
6.88 |
4.56 |
2.88 |
|
Brazil |
19.75 |
19.25 |
16.02 |
|
Malaysia |
2.88 |
2.82 |
3.00 |
|
Philippines |
6.75 |
7.25 |
9.19 |
|
Singapore |
2.00 |
2.06 |
0.69 |
|
Thailand |
3.05 |
2.64 |
1.31 |
| |
|
|
|
|
n.a. : Not available. |
|
|
|
|
Source : The Economist. |
|
|
|
Euro area bond yields also dropped to record lows in May and
June 2005. Similarly, yield curves in Australia, New Zealand and the UK flattened
or inverted.
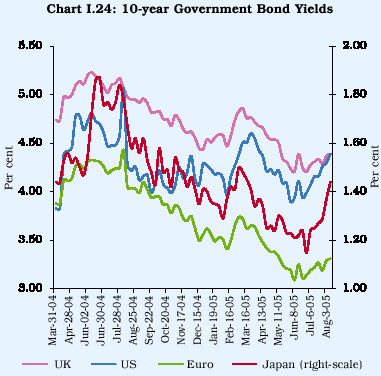
Table 1.50: Domestic and International Equity Markets in 2004-05
|
Country/ |
Index |
Percentage |
Volatility** |
|
Region |
|
Variation* |
|
| |
|
|
|
|
1 |
2 |
3 |
4 |
| |
|
|
|
|
EMEs |
MSCI Emerging Market Index |
12.0 |
10.8 |
|
Hong Kong |
Hang Seng |
6.6 |
6.2 |
|
India |
BSE Sensex |
16.1 |
11.2 |
|
Indonesia |
Jakarta Composite Index |
46.8 |
15.8 |
|
Japan |
Nikkei 225 |
-0.4 |
3.3 |
|
Korea |
KOSPI |
9.7 |
9.1 |
|
Malaysia |
KLSE Composite Index |
-3.4 |
4.5 |
|
Taiwan |
Taiwan Index |
-7.9 |
5.3 |
|
Thailand |
SET Composite Index |
5.3 |
5.8 |
|
UK |
FTSE 100 |
11.6 |
4.5 |
|
US |
Dow Jones Industrial Average |
1.4 |
2.7 |
|
US |
Nasdaq Composite |
0.3 |
4.9 |
| |
|
|
|
|
EMEs: Emerging Market Economies.
MSCI: Morgan Stanley Capital International Inc.
KOSPI: Korean Composite Stock Price Index.
KLSE: Kuala Lumpur Stock Exchange.
SET: The Stock Exchange of Thailand.
* : Point-to-point variation over previous year.
** : Measured as coefficient of variation.
|
I.5.5 The performance of the equity markets was guided by country-specific
factors as well as international factors. Most equity markets gained on the
back of positive expectations generated by the global recovery, albeit
dampened by higher oil prices. The Indian stock markets outperformed a number
of major markets (Table 1.50). Despite some firming up of the risk premia, inter
national investor confidence in emerging market economies (EMEs) continued to
be strong.
DOMESTIC FINANCIAL MARKETS
Money Market
Call/Notice Money Market
I.5.6 Liquidity in the call/notice money markets remained adequate
in 2004-05. Reflecting easy liquidity conditions, average daily call money borrowing
rates generally ruled below reverse repo rate levels, but were anchored to the
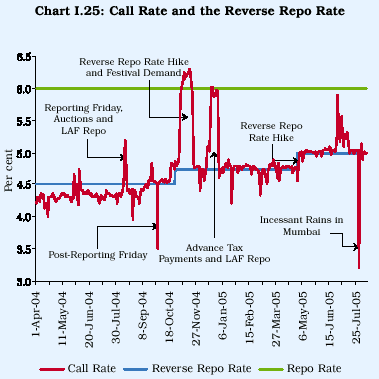
policy rate (Chart I.25).
I.5.7 Call rates remained soft in April 2004 as the seasonal
jump in market liquidity was reinforced by the initial liquidity overhang of
about Rs.81,000 crore, a bunching of capital flows and the cancellation of a
Government bond auction. The Reserve Bank, in fact, held nine auctions under
the newly-operationalised
Market Stabilisation Scheme (MSS) (Rs.23,000 crore) to supplement
large-scale reverse repo operations in mopping up market liquidity. Although
foreign institutional investor (FII) inflows began to dry up with the dip in
Asian equity markets by mid-May 2004, the weighted average call rates continued
to remain below the reverse repo rate till July 2004. A spike in the call rates
in August due to an outflow of funds on account of auction of Central Government
securities, redemption pressure on mutual funds and undercovering of reserve
maintenance was assuaged by the Reserve Bank by injecting Rs.5,000 crore under
the LAF (Appendix Table I.37). With the hike in the Cash Reserve Ratio (CRR)
by 25 basis points with effect from September 18, 2004, the daily average turnover
in the call/notice money market increased.
I.5.8 Call rates firmed up in early October 2004 with the increase
in the CRR by another 25 basis points with effect from October 2, 2004. Liquidity
conditions also came under some pressure during the latter part of the month.
The hike of 25 basis points in the LAF reverse repo rate effective October 27,
2004 correspondingly raised the floor in the money market. Call rates touched
an intra-year peak of 6.30 per cent on November 18, 2004. The Reserve Bank injected
liquidity under the LAF repo auctions to comfort market sentiments. The Reserve
Bank reintroduced overnight fixed rate reverse repo auctions under the LAF with
effect from November 1, 2004 and discontinued 7-day and 14-day reverse repo
auctions. Liquidity conditions began to ease by end-November 2004, interrupted
by occasional
Table 1.51: Call/Notice Money Market Borrowing Rates - Summary Statistics
| |
|
Low |
|
|
High |
|
Weighted Average |
| |
|
|
|
|
|
|
|
|
|
|
|
|
|
Month |
Min (%) |
Max (%) |
Avg. (%) |
CV |
Min. (%) |
Max (%) |
Avg. (%) |
CV |
Min. (%) |
Max (%) |
Avg. (%) |
CV |
| |
|
|
|
|
|
|
|
|
|
|
|
|
|
1 |
2 |
3 |
4 |
5 |
6 |
7 |
8 |
9 |
10 |
11 |
12 |
13 |
| |
|
|
|
|
|
|
|
|
|
|
|
|
|
2003-04 |
1.00 |
5.25 |
3.38 |
0.18 |
4.50 |
12.00 |
4.89 |
0.13 |
3.99 |
6.21 |
4.62 |
0.06 |
|
2004-05 |
0.60 |
6.50 |
3.59 |
0.21 |
3.50 |
10.95 |
5.02 |
0.14 |
3.50 |
6.30 |
4.65 |
0.10 |
|
April |
1.00 |
3.80 |
3.09 |
0.22 |
4.50 |
4.55 |
4.52 |
0.01 |
4.01 |
4.42 |
4.29 |
0.02 |
|
May |
2.00 |
3.75 |
3.14 |
0.17 |
4.50 |
7.50 |
4.61 |
0.12 |
4.16 |
4.67 |
4.30 |
0.02 |
|
June |
2.50 |
4.00 |
3.51 |
0.10 |
4.50 |
6.25 |
4.61 |
0.07 |
4.18 |
4.74 |
4.35 |
0.02 |
|
July |
2.00 |
3.80 |
3.41 |
0.10 |
4.50 |
4.80 |
4.52 |
0.01 |
4.13 |
4.41 |
4.31 |
0.01 |
|
August |
1.50 |
3.50 |
3.21 |
0.17 |
4.50 |
10.95 |
5.19 |
0.26 |
3.96 |
5.20 |
4.41 |
0.05 |
|
September |
2.00 |
4.00 |
3.32 |
0.19 |
3.50 |
6.12 |
4.82 |
0.11 |
3.50 |
4.85 |
4.45 |
0.05 |
|
October |
2.00 |
4.00 |
3.49 |
0.18 |
4.65 |
6.10 |
5.01 |
0.06 |
4.32 |
4.86 |
4.63 |
0.03 |
|
November |
3.50 |
5.00 |
4.49 |
0.11 |
5.05 |
7.00 |
6.06 |
0.09 |
4.76 |
6.30 |
5.62 |
0.10 |
|
December |
2.25 |
5.00 |
4.00 |
0.15 |
4.85 |
6.30 |
5.70 |
0.09 |
4.42 |
6.03 |
5.28 |
0.11 |
|
January |
2.00 |
4.60 |
3.64 |
0.19 |
4.80 |
6.00 |
5.13 |
0.05 |
4.20 |
4.88 |
4.72 |
0.03 |
|
February |
3.00 |
4.00 |
3.79 |
0.07 |
4.85 |
5.30 |
5.22 |
0.02 |
4.67 |
4.81 |
4.76 |
0.01 |
|
March |
0.60 |
4.00 |
3.39 |
0.26 |
4.80 |
6.25 |
5.09 |
0.06 |
4.15 |
5.00 |
4.72 |
0.04 |
|
2005-06 |
|
|
|
|
|
|
|
|
|
|
|
|
|
April |
2.00 |
4.30 |
3.70 |
0.10 |
4.80 |
6.10 |
5.06 |
0.06 |
4.55 |
5.01 |
4.77 |
0.02 |
|
May |
3.00 |
4.00 |
3.80 |
0.10 |
5.05 |
5.30 |
5.14 |
0.01 |
4.89 |
5.07 |
4.99 |
0.01 |
|
June |
2.50 |
4.60 |
4.14 |
0.09 |
5.05 |
6.50 |
5.36 |
0.08 |
4.95 |
5.89 |
5.10 |
0.08 |
|
July |
1.00 |
4.65 |
4.05 |
0.24 |
5.05 |
6.25 |
5.58 |
0.06 |
3.19 |
5.60 |
5.02 |
0.10 |
| |
|
|
|
|
|
|
|
|
|
|
|
|
|
Min. : Minimum. Max: Maximum. Avg.: Average. CV: Coefficient of Variation. |
pressures. By March 2005, the weighted average call rates ranged between 4.15-5.00 per cent with some firmness during the latter part of the month on account of balance sheet adjustments, coupled with advance tax outflows. The volatility in call money rates was somewhat higher during 2004-05 than in the preceding year, essentially on account of fluctuations in call rates during November-December 2004 (Table 1.51).
I.5.9 The call money market began the first quarter of 2005-06 under conditions of comfortable liquidity stemming from the overhang in the system. Despite FII outflows in April, the Reserve Bank had to supplement reverse repo operations with sale of Government paper under the MSS to absorb liquidity and balance market conditions. Average daily call money borrowing rates hovered around reverse repo rate levels. With the increase in the fixed reverse repo rate by 25 basis points on April 29, 2005 call rates also edged up by a similar magnitude. Towards the end of June 2005, call rates rose above the reverse repo rate under demand pressures emanating from advance tax payments, scheduled Treasury Bills auctions and a higher oil import bill. The Reserve Bank injected Rs.210 crore and Rs.575 crore under the LAF repo on June 28, 2005 and June 30, 2005, respectively, to assuage the demand pressure. On a net basis, however, on these two days, there was liquidity absorption. Call money rates eased by mid- July 2005 and stood at 5.00 per cent on August 18, 2005.
I.5.10 In recent years, relative shares of the different constituents of the money market have undergone significant changes. Banks’ share of borrowings from call market witnessed a gradual decline over the years till 2003-04, reflecting lower demand for funds in the wake of excess liquidity in the economy and substantial scaling down of CRR prescriptions. Thus, in a scenario of shrinking turnover in the call money market, primary dealers (PDs), whose demand was guided by the volume of market borrowing programme, emerged as the largest borrower as a group in this market. The situation changed during 2004-05 with banks re-emerging as the largest group of borrowers following a pick up in credit and the increase in CRR with effect from September 18, 2004. The truncation in the market borrowing programme of the Central Government reduced the demand from PDs in the call/notice money market (Table 1.52). On the lending side, the share of non-bank entities had declined during 2001-02 and 2002-03 following the commencement of the process of their phasing out from the call/notice market. Their shares, however, increased during 2003-04 in relative terms due to shrinkage in the aggregate turnover of the call market. The share of the banking sector has been rising since September 2004 on account of strong growth in non-food credit.
Table 1.52: Relative Shares in Call/Notice Money Market
| |
|
|
|
|
(Per cent) |
| |
|
|
|
|
|
|
Year |
Borrowing |
|
Lending |
|
| |
|
|
|
|
|
| |
Banks |
PDs |
Banks |
PDs |
Non-banks |
|
1 |
2 |
3 |
4 |
5 |
6 |
|
2000-01 |
67 |
33 |
47 |
12 |
41 |
|
2001-02 |
62 |
38 |
65 |
10 |
25 |
|
2002-03 |
53 |
47 |
69 |
2 |
29 |
|
2003-04 |
36 |
64 |
57 |
2 |
41 |
|
2004-05 |
65 |
35 |
70 |
1 |
29 |
|
2005-06* |
72 |
28 |
90 |
0 |
10 |
|
* : Up to July 2005. |
Repo and CBLO Markets
I.5.11 The gradual phasing out of non-bank participants from
the call market, tightening of prudential norms relating to the call exposure
of banks and availability of cheaper funds led to increased activity in the
repo market (outside the LAF). The monthly average turnover increased by 64.2
per cent to Rs.17,135 crore during 2004-05 and further to Rs.18,103 crore in
July 2005. Apart from banks, mutual funds and financial institutions were the
main participants in the repo market. The repo rates ranged between 3.70 per
cent and 5.58 per cent during the year, barring occasional spikes in November
and December 2004.
I.5.12 The collateralised borrowing and lending obligations
(CBLO) market continued to expand during 2004-05. By July 2005, 121 members
had been admitted in the CCIL’s CBLO segment out of which 56 were active members.
The daily average turnover increased from Rs.2,496 crore in April 2004 to Rs.9,625
crore by March 2005 and further to Rs.15,291 crore by July 2005. Initially,
only one insurance company and few co-operative banks supplied funds in this
market. Currently, mutual funds have emerged as the largest suppliers of funds.
On the demand side, apart from banks, PDs have also been participating regularly
on account of lower borrowing costs in CBLO vis-à-vis call market.
I.5.13 A distinctive feature of 2004-05 was the growth in the
turnover of the CBLO market vis-à-vis the call money market (Chart
I.26). A number of players preferred to migrate from the uncollateralised call/notice
market to market repo and CBLO segments, essentially on account of cheaper funding
costs. In June 2005, however, turnover in the call money market increased on
account of increased demand for funds due to tightening of liquidity conditions.
Term Money Market
I.5.14 During 2004-05, the average outstanding volume of transactions
in the term money market was Rs.477 crore, down from Rs.519 crore during the
previous year (Table 1.53). During 2005-06 (up to July 2005), the average outstanding
increased to Rs.614 crore.
Certificates of Deposit
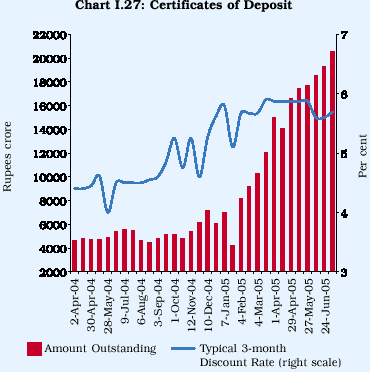
I.5.15 The outstanding amount of certificates of deposit (CDs)
issued by scheduled commercial banks increased markedly dur ing 2004-05, reflecting
the banks’ requirement of funds in view of sustained increase in credit demand
(Chart I.27 and Appendix Table I.38). The typical discount rate (for 3-month
maturity) on CDs also increased by about 94 basis points over the year. Issuances
of CDs depend not only on overall liquidity conditions but also on bank-specific
factors. In this context, select foreign and private sector banks have been
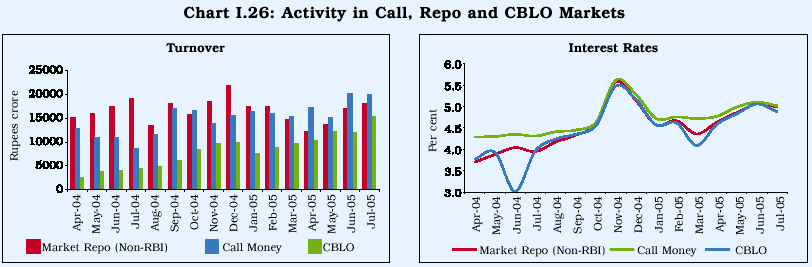
Table 1.53: Activity in Other Money Market Segments
| |
|
|
|
|
|
|
(Rupees crore) |
| |
|
|
|
|
|
|
|
|
Month |
Average Daily Turnover |
Outstanding |
Amount |
Forward Rate |
Commercial |
| |
|
|
|
|
|
Agreements/ |
Bills |
| |
Term Money |
Repo Market |
Collateralised |
Commercial |
Certificates of |
|
|
| |
|
|
|
|
|
Interest Rates |
Rediscounted |
| |
Market |
(Outside |
Borrowing |
Paper |
Deposit |
|
|
| |
|
|
|
|
|
Swaps |
by Commercial |
| |
|
the LAF) |
and Lending |
|
|
|
|
| |
|
|
|
|
|
(Notional |
Banks |
| |
|
|
Obligation |
|
|
|
|
| |
|
|
|
|
|
Amount) |
|
| |
|
|
(CBLO) |
|
|
|
|
| |
|
|
|
|
|
|
|
|
1 |
2 |
3 |
4 |
5 |
6 |
7 |
8 |
| |
|
|
|
|
|
|
|
|
2004-05 |
|
|
|
|
|
|
|
|
April |
325 |
15,195 |
2,496 |
10,362 |
4,725 |
5,76,808 |
330 |
|
May |
372 |
15,932 |
3,872 |
11,038 |
4,860 |
6,11,595 |
370 |
|
June |
274 |
17,517 |
4,015 |
10,950 |
5,438 |
6,04,669 |
85 |
|
July |
445 |
19,226 |
4,508 |
11,038 |
5,478 |
5,90,118 |
100 |
|
August |
311 |
13,561 |
4,962 |
11,002 |
4,480 |
6,40,173 |
195 |
|
September |
487 |
18,178 |
6,149 |
11,371 |
5,112 |
8,53,195 |
375 |
|
October |
539 |
15,719 |
8,466 |
10,409 |
4,785 |
9,25,175 |
320 |
|
November |
407 |
18,560 |
9,651 |
10,719 |
6,118 |
9,50,151 |
1,099 |
|
December |
504 |
21,922 |
9,962 |
13,272 |
6,103 |
9,75,135 |
288 |
|
January |
514 |
17,556 |
7,701 |
13,092 |
4,236 |
10,14,442 |
316 |
|
February |
878 |
17,562 |
8,952 |
13,189 |
9,214 |
9,46,293 |
375 |
|
March |
1,253 |
14,688 |
9,625 |
14,235 |
12,078 |
10,62,242 |
401 |
| |
|
|
|
|
|
|
|
|
2005-06 |
|
|
|
|
|
|
|
|
April |
661 |
12,174 |
10,369 |
15,598 |
16,602 |
10,76,513 |
785 |
|
May |
545 |
13,688 |
12,233 |
17,182 |
17,689 |
10,72,684 |
755 |
|
June |
534 |
17,163 |
12,075 |
17,797 |
19,270 |
10,93,367 |
n.a. |
|
July |
717 |
18,103 |
15,291 |
18,349 |
20,509 * |
12,13,895 |
n.a. |
| |
|
|
|
|
|
|
|
|
n.a. : Not available. * : As on July 8, 2005. |
raising resources through the issuance of CDs on account of
a smaller retail network and cost effectiveness. The steady expansion in issuance
of
CDs during 2004-05 was encouraged by factors such as reduction
in stamp duty on CDs effective March 1, 2004, no tax deduction at source, no
premature closure of deposits under CDs vis-à-vis alternative
competing instruments such as fixed deposits and greater opportunity for secondary
market trading. Furthermore, mutual funds (MFs) have also turned to CDs after
the Securities and Exchange Board of India (SEBI) placed a bar on parking their
funds in bank deposits. An encouraging development was that some of the top
issuing banks got their CDs rated for better access to the market even when
such rating was not mandatory under the extant guidelines.
I.5.16 Balances under CDs recorded a further pickup during
2005-06 (up to July 8, 2005) mainly due to higher issuances by some private
sector banks. The higher recourse to CDs was also driven by the reduction in
the minimum maturity period to seven days. The typical three-month discount
rate on CDs remained broadly stable during the quarter. Total CDs outstanding
constituted 5.1 per cent of the aggregate deposits of the issuing banks.
Commercial Paper
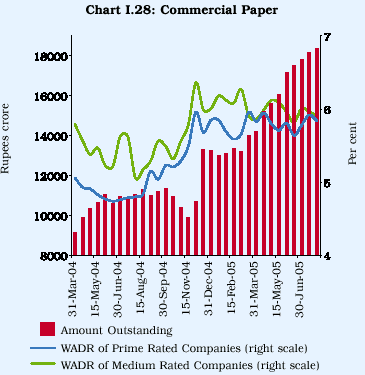
I.5.17 The market for commercial paper (CP) continued to remain
buoyant during 2004-05 (Chart I.28). In tandem, the discount rate firmed up
from a range of 4.70-6.50 per cent during 2003-04 to 5.20-7.25 per cent during
2004-05, with the weighted average discount rate (WADR) moving up from 5.11
per cent to 5.84 per cent. The spread of the WADR between the prime-rated and
medium-rated companies declined to 3 basis points during the fortnight ended
March 31, 2005 from 73 basis points during the fortnight ended March 31, 2004.
The preferred maturity of CP was for periods ranging from ‘61 to 90 days’ and
‘180 days and above’.
I.5.18 In terms of groups of issuers, there has been a decline
in the amount of CPs being issued by manufacturing companies over time. Their
share in the aggregate amount of CPs raised came down to 31 per cent during
2004-05 from 44 per cent during 2003-04. On the other hand, the share of finance/leasing
companies increased to 56 per cent (38 per cent during 2003-04) while FIs accounted
for 13 per cent (18 per cent during 2003-04). The decline in CP issuance by
manufacturing companies reflected larger internal accruals due to enhanced efficiency
in their operations. Introduction of sub-PLR lending has also enabled corporates
to raise funds at comparable rates from banks without incurring any additional
cost towards
stamp duty, dematerialisation costs or fees for issuing and
paying agents (IPAs). Furthermore, easier access to external commercial borrowings
(ECBs) also helped top-rated corporates to borrow cheaper funds instead of relying
essentially on domestic sources. Larger issuances of CP by finance and leasing
companies was par tly on account of the policy-induced phasing out their access
to public deposits. Large investment interest by mutual funds on account of
the Reserve Bank’s guidelines on non-SLR debt securities by banks and reduction
in stamp duty on CP effective March 1, 2004 also boosted CP issuances. Though
the CP market is overwhelmingly dominated by first class prime rated issuers
(i.e., P1+ and above of CRISIL or its equivalent), their share in issuances
of CP declined marginally to 88.2 per cent in 2004-05 from 91.9 per cent during
2002-03. During 2004-05, around 91 per cent of the CP issuances was accounted
for by the corporates with net worth of more than Rs.50 crore.
I.5.19 The market for CPs continued to remain strong in 2005-06
(up to end-July 2005) and outstanding CPs increased from Rs.14,235 crore at
end-March 2005 to Rs.18,349 crore by end-July 2005 (Appendix Table I.39). Leasing
and finance companies accounted for 62.5 per cent of the total CP outstanding
in July 2005. The WADR on CPs increased by four basis points to 5.88 per cent
on July 31, 2005 over its level on March 31, 2005.
Forward Rate Agreements (FRAs)/Interest Rate Swaps (IRS)
I.5.20 There was a sharp increase in volumes in the FRAs/IRS
market during 2004-05. FRAs/IRS transactions rose from 20,413 contracts amounting
to Rs.5,76,808 crore in April 2004 to 37,864 contracts for Rs.10,62,242 crore
in March 2005. The major participants in this market include select foreign
banks, private sector banks and PDs. In a majority of these contracts, the National
Stock Exchange (NSE)-Mumbai Inter-bank Offered Rate (MIBOR) and Mumbai Inter-bank
Forward Offered Rate (MIFOR) were used as the benchmark rates. The other benchmark
rates used included secondary market yields of Government of India securities
having a residual maturity of one year and primary cut-off yields on 364-day
Treasury Bills. During 2005-06 (up to July 2005), the number of contracts increased
further to 45,225 amounting to Rs.12,13,895 crore.
FOREIGN EXCHANGE MARKET
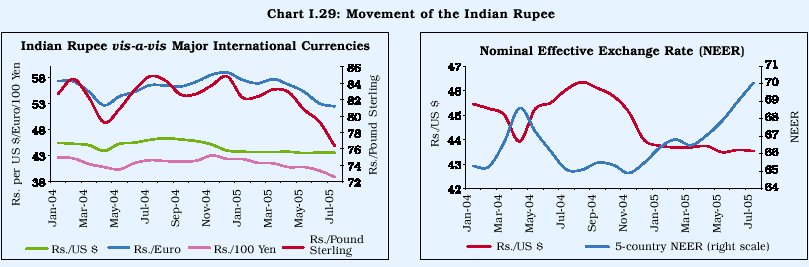
I.5.21 The foreign exchange market remained generally stable
during 2004-05. In response to the switches in capital flows during the year,
the rupee moved in a relatively wide range of Rs.43.36-Rs.46.46 per US dollar
during the year. The rupee appreciated by 2.2 per cent against the US dollar
on an annual average basis while it weakened against the euro, the pound sterling
and the Japanese yen by 4.5 per cent, 6.3 per cent and 2.6 per cent, respectively,
during 2004-05. Reflecting these cross-currency movements, the nominal
effective exchange rate (NEER) depreciated by 1.9 per cent during 2004-05 (Chart
I.29).
I.5.22 Excess supply in the foreign exchange market in April
2004 drove the forwards into discounts during the month (Chart I.30). The excess
supply situation changed by mid-May 2004 because of the turbulence in equity
markets leading to outflows on account of FIIs and rising global oil prices.
As a result, the rupee depreciated by 4.3 per cent against the US dollar during
May-August 2004. The Reserve Bank made net market sales of US $ 2.7 billion
during this period (Table 1.54). The two-way movement in the rupee prompted
corporates to hedge foreign currency exposures and forwards moved into premia
in June 2004. The pressure on the rupee started easing from September 2004 onwards
with the revival in FII flows, step-up in trade credits and ECBs by importers.
Remittances from exporters and heavy FII inflows continued to provide strength
to the rupee against the US dollar in the following months. The weakness of
the US dollar against other major currencies led the rupee to appreciate by
6.6 per cent during August-December 2004. Although FII flows slowed down in
January 2005, the rupee remained strong against the US dollar during the last
quarter of the financial year as the US dollar weakened sharply in the international
markets. The Reserve Bank made net market purchases of US $ 16.1 billion during
September 2004-March 2005.
I.5.23 During April-May 2005, despite outflows by FIIs and
a higher merchandise trade deficit, the rupee firmed up against the US dollar
from Rs.43.76 at end-March 2005 to Rs.43.30 per US dollar on May 12, 2005. In
subsequent weeks, the Indian rupee depreciated, reaching Rs.43.76 on June 2,
2005 due to strengthening of the US dollar in the international markets. With
the revaluation of the Chinese yuan on July 21, 2005, there were appreciation
pressures and the rupee stood at Rs.43.58 per US dollar on August 19, 2005.
On the whole, the Indian rupee appreciated by 0.4 per cent over its level on
March 31, 2005.
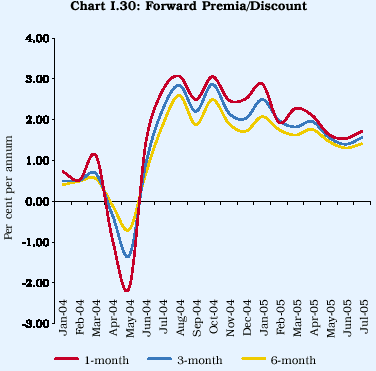
Table 1.54: Purchases and Sales of US dollars by the Reserve Bank
| |
|
|
|
|
|
(US $ million) |
|
Month |
|
Purchases(+) |
Sales (-) |
Net@ (+/-) |
Cumulative (during the |
Outstanding Net Forward |
| |
|
|
|
|
financial year) |
Sales (-) /Purchases (+) |
| |
|
|
|
|
|
(end of month) |
| |
|
|
|
|
|
|
|
1 |
|
2 |
3 |
4 |
5 |
6 |
| |
|
|
|
|
|
|
|
2004-05 |
|
|
|
|
|
|
April |
|
10,759 |
3,332 |
(+) 7,427 |
(+) 7,427 |
(+) 311 |
|
May |
|
3,220 |
3,440 |
(-) 220 |
(+) 7,207 |
(+) 125 |
|
June |
|
970 |
1,383 |
(-) 413 |
(+) 6,793 |
(+) 115 |
|
July |
|
0 |
1,180 |
(-) 1,180 |
(+) 5,614 |
(+) 115 |
|
August |
|
5 |
881 |
(-) 876 |
(+) 4,738 |
(+) 110 |
|
September |
143 |
124 |
(+) 19 |
(+) 4,757 |
(+) 5 |
|
October |
5 |
104 |
(-) 99 |
(+) 4,658 |
0 |
|
November |
3,792 |
0 |
(+) 3,792 |
(+) 8,450 |
0 |
|
December |
1,501 |
108 |
(+) 1,393 |
(+) 9,843 |
0 |
|
January |
0 |
0 |
0 |
(+) 9,843 |
0 |
|
February |
4,974 |
0 |
(+) 4,974 |
(+) 14,817 |
0 |
|
March |
|
6,030 |
0 |
(+) 6,030 |
(+) 20,847 |
0 |
| |
|
|
|
|
|
|
|
2005-06 |
|
|
|
|
|
|
April |
|
0 |
0 |
0 |
0 |
0 |
|
May |
|
0 |
0 |
0 |
0 |
0 |
|
June |
|
0 |
107 |
(-) 107 |
(-) 107 |
0 |
| |
|
|
|
|
|
|
|
(+) :Implies purchases including purchase leg under swaps and outright forwards.
(-) :Implies sales including sale leg under swaps and outright forwards.
@ :Includes transactions under India Millennium Deposits (IMDs).
Note: This Table is based on value dates. |
I.5.24 Spot market conditions kept forward premia low during
the first quarter of 2005-06. Forward premia declined in May 2005 in view of
the announcement to phase out the Mumbai Inter-bank Forward Offered Rate (MIFOR)
as a benchmark for pricing interest rate derivative deals for non-banks.
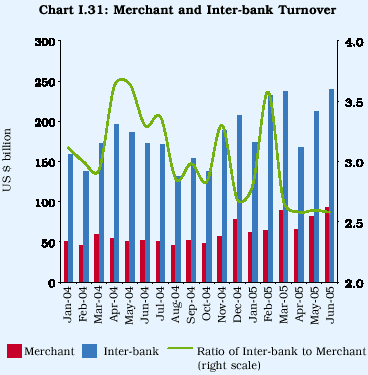
I.5.25 The turnover in both the merchant and inter-bank segments
of the foreign exchange market increased sharply, reflecting the strong growth
in merchandise trade, services and capital flows (Appendix Table I.40). While
the merchant turnover increased from US $ 54.0 billion in April 2004 to US $
88.6 billion in March 2005, the inter-bank turnover increased from US $ 195.7
billion to US $ 237.0 billion during the same period (Chart I.31). The ratio
of inter-bank to merchant turnover hovered in the range of 2.7-3.6 during the
year, indicative of orderly market conditions.
I.5.26 According to the BIS Triennial Survey, the average daily
turnover in the international markets rose to US $ 2.4 trillion in 2004 from
US $ 1.6 trillion in 2001. India’s share in global foreign exchange turnover
has been increasing, although it still remains quite low (Table 1.55).
Table 1.55: Foreign Exchange Market Turnover*
| |
| |
(US $ billion) |
|
Item |
2004 |
2001 |
1998 |
|
1 |
2 |
3 |
4 |
|
Global Turnover |
2,408 |
1,618 |
1,968 |
|
India’s Share in Global Turnover (%) |
0.3 |
0.2 |
0.1 |
|
* : Net of local inter-dealer double counting.
Source: Triennial Central Bank Survey, 2004, BIS. |
GOVERNMENT SECURITIES MARKET
I.5.27 Yields hardened in the Government
securities market reflecting the upturn in the international interest rate cycle,
rise in international crude oil prices, domestic monetary policy tightening
and edging up of inflation in the first half of 2004-05. The growth of the aggregate
volume of transactions (outright as well as repos) in Central and State Government
dated securities and Treasury Bills slowed down to 3.2 per cent during 2004-05
from 36.0 per cent during 2003-04 reflecting the reduced appetite for Government
securities (Box I.12 and Appendix Table I.42). While the Central Government
dated securities constituted 92.0 per cent of the outright transactions, Treasury
Bills constituted 7.0 per cent. The share of State Government securities was
negligible at 1.0 per cent.
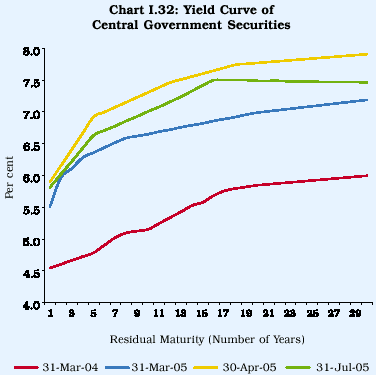
I.5.28 During 2004-05, the yield
curve underwent an upward shift. The secondary market yields on the 10-year
Government securities moved up by 150 bps between end-March 2004 and end-March
2005 (Chart I.32).
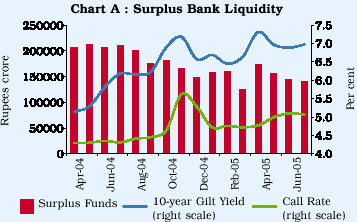
Box I.12
Surplus Bank Liquidity and Yields
Assuming that the loan business
has the first charge on banks’ resources after meeting the statutory reserve
requirements, the surplus liquidity of commercial banks could, therefore, be
computed as the resources available in excess of statutory pre-emptions and
credit offtake. Consequently, as the surplus bank liquidity increases, commercial
banks’ appetite for Government paper increases leading to a decline in yields
and vice versa (Chart A).
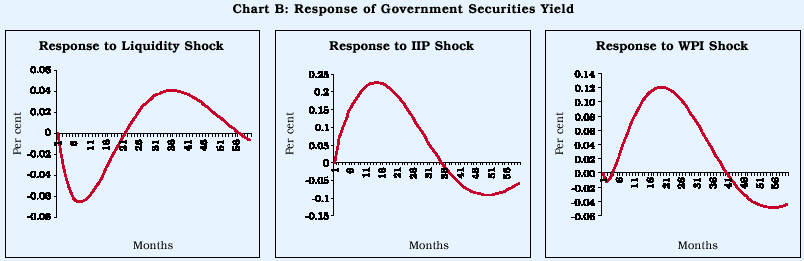
The dynamics of surplus liquidity
in response to shocks are examined through an unrestricted vector autoregression
(VAR) model. Using monthly data for the period April 2000 to March 2005, the
VAR model was estimated with four endogenous variables in the following order:
secondary market 10-year yield in the Government securities market, seasonally-adjusted
wholesale price index (WPI), seasonally-adjusted index of industrial production
(IIP) and seasonally-adjusted surplus liquidity of commercial banks. The domestic
price of petroleum, oil and lubricants (POL) was also included as an exogenous
variable. Impulse response analysis indicates
I.5.29 The yield on 10-year Government
paper rose from 5.15 per cent as on March 31, 2004 to 6.73 per cent on August
11, 2004 with the gradual tightening of liquidity conditions following a drying
up of capital inflows, a spurt in domestic inflation, strong growth and the
reversal of the accommodative monetary policy stance by the US Federal Reserve.
The yield, however, retracted to 5.89 per cent by September 3, 2004 reflecting
fiscal measures taken by the Government to rein in inflation, a lower than anticipated
hike in the MSS ceiling amount, some moderation in global oil prices and a one-time
permission by the Reserve Bank to banks to transfer securities to the held-to-maturity
(HTM) category. With liquidity conditions tightening again due to an increase
in the CRR in September-October 2004 and the hike in the reverse repo rate in
October 2004, the 10-year yield edged up and peaked at 7.31 per cent on November
8, 2004. Subsequently, yields fell on cancellation of scheduled auctions, ebbing
of international oil prices and easing of liquidity conditions following the
revival of capital inflows. The market rallied in February 2005, buoyed by the
Standard & Poor’s rating upgrade, lower inflation numbers and news of a
decline in the fiscal deficit. During March 2005, however, yields firmed up
again on concerns about the higher than expected Government borrowings as announced
in the Union Budget, 2005-06. Persistent concerns about international crude
oil prices and year-end
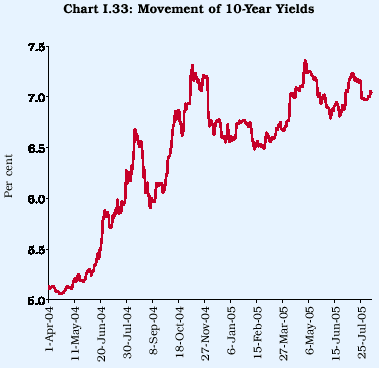
balance sheet adjustments hardened
the 10-year yield to 6.73 per cent on March 22, 2005 before it finally closed
at 6.65 per cent on March 31, 2005 (Chart I.33).
I.5.30 During 2005-06, yields started
to harden from the second week of April 2005, reflecting a further rise in international
crude oil prices, higher than expected inflation and a hike in the reverse repo
rate. The 10-year benchmark yield firmed up to 7.31 per cent on April 30, 2005
from 6.65 per cent on March 31, 2005. Yields softened during the first three
weeks of May 2005 with the decline in international crude oil prices and easing
of inflation. As crude oil prices renewed their upward climb, the 10-year yield
hardened to 7.23 per cent as on July 11, 2005. With the reverse repo rate being
left unchanged on July 26, 2005 in the First Quarter Review of the Annual Statement
on Monetary Policy, yields softened under comfor table liquidity conditions
and stood at 7.08 per cent on August 19, 2005. Thus, yields hardened by 43 basis
points between end-March and August 19, 2005.
I.5.31 In line with the Government
securities market, the yields on 5-year AAA-rated corporate bonds edged up during
2004-05. The yield spread between 5-year AAA-rated corporate bonds and 5-year
Government securities, however, narrowed to 28 basis points at end-July 2005
from 66 basis points at end-March 2004 (Chart I.34).
CREDIT MARKET
I.5.32 Despite a strong pick-up
in credit demand, deposit and lending rates of banks remained broadly stable,
reflecting appropriate liquidity in the system. Deposit rates, in fact, eased
till December 2004 before edging up in March 2005 (Table 1.56). Public sector
banks (PSBs) realigned their deposit rates in the tenor of one year and above
to 5.25-6.50 per cent by June 2005 from a range of 4.75-7.00 per cent in March
2005.
I.5.33 Benchmark prime lending
rates (BPLR) for public sector and foreign banks experienced some softening
even while that of private sector banks hardened. Sub-BPLR lending of the banking
system (excluding exports, the bulk of which is at sub-BPLR) constituted over
65 per cent of total outstanding advances above Rs.2 lakh.
EQUITY AND DEBT MARKETS
I.5.34 Strong macroeconomic fundamentals
kept the capital market buoyant during 2004-05. The primar y segment benefited
from the positive sentiment in the secondary market and an upbeat investment
climate. Equity issues by corporates through initial public offerings recorded
a substantial increase. Pr ivately placed debt issuances by public sector companies
dominated the pr imar y market segment. Issuances in international markets by
Indian corporates also increased during the year. Stock markets recovered from
the setback of May 2004 to touch all-time high levels towards the close of the
year. During the most
Table 1.56: Movements in Deposit and Lending
Rates
| |
|
|
|
|
|
|
(Per cent) |
| |
|
|
|
|
|
|
|
|
Interest Rate |
June 2005 |
March 2005 |
December 2004 |
September 2004 |
June 2004 |
March 2004 |
| |
|
|
|
|
|
|
|
|
1 |
|
2 |
3 |
4 |
5 |
6 |
7 |
|
1. |
Domestic Deposit Rate @ |
|
|
|
|
|
|
| |
Public Sector Banks |
|
|
|
|
|
|
| |
Up to 1 year |
2.75-6.00 |
2.75-6.00 |
3.50-5.00 |
3.50-5.00 |
3.50-5.25 |
3.75-5.25 |
| |
More than 1 year and up to 3 years |
5.25-6.00 |
4.75-6.50 |
4.75-5.50 |
4.75-5.75 |
5.00-5.75 |
5.00-5.75 |
| |
More than 3 years |
5.50-6.50 |
5.25-7.00 |
5.00-5.75 |
5.25-5.75 |
5.25-5.75 |
5.25-6.00 |
| |
Private Sector Banks |
|
|
|
|
|
|
| |
Up to 1 year |
3.00-6.50 |
3.00-6.25 |
3.00-6.00 |
3.00-6.00 |
3.00-6.00 |
5.00-6.50 |
| |
More than 1 year and up to 3 years |
5.00-7.00 |
5.25-7.25 |
5.00-6.75 |
5.00-6.50 |
5.00-6.50 |
5.00-6.50 |
| |
More than 3 years |
5.75-7.25 |
5.25-7.00 |
5.25-6.50 |
5.25-7.00 |
5.25-7.00 |
5.25-7.00 |
| |
Foreign Banks |
|
|
|
|
|
|
| |
Up to 1 year |
3.00-5.50 |
3.00-6.25 |
3.00-5.75 |
2.75-7.50 |
2.75-7.50 |
2.75-7.75 |
| |
More than 1 year and up to 3 years |
3.50-6.50 |
3.50-6.50 |
3.50-7.00 |
3.25-8.00 |
3.25-8.00 |
3.25-8.00 |
| |
More than 3 years |
4.00-7.00 |
3.50-7.00 |
3.50-7.00 |
3.25-8.00 |
3.25-8.00 |
3.25-8.00 |
|
2. |
Benchmark Prime Lending Rate |
|
|
|
|
|
|
| |
Public Sector Banks |
10.25-11.25 |
10.25-11.25 |
10.25-11.25 |
10.25-11.50 |
10.25-11.50 |
10.25-11.50 |
| |
Private Sector Banks |
11.00-13.50 |
11.00-13.50 |
10.50-13.50 |
9.75-13.00 |
9.75-13.00 |
10.50-13.00 |
| |
Foreign Banks |
10.00-14.50 |
10.00-14.50 |
10.00-15.00 |
11.00-14.85 |
11.00-14.85 |
11.00-14.85 |
|
3. |
Actual Lending Rate* |
|
|
|
|
|
|
| |
Public Sector Banks |
3.35-16.50 |
2.75-16.00 |
3.50-19.50 |
2.75-16.00 |
4.25-16.00 |
4.00-16.00 |
| |
Private Sector Banks |
3.15-24.94 |
3.15-22.00 |
2.62-22.00 |
3.15-21.48 |
4.00-22.19 |
4.50-22.00 |
| |
Foreign Banks |
4.00-25.00 |
3.55-23.50 |
3.00-23.00 |
2.55-23.00 |
3.75-23.00 |
3.75-23.00 |
| |
|
|
|
|
|
|
|
|
*: Interest rate on non-export demand and term loans above Rs.2 lakh
excluding lending rates at the extreme five per cent on both sides.
@: As on June 10, 2005. |
part of the period November 2004-March 2005, the BSE Sensex remained above the 6000-mark. The BSE Sensex reached new highs during July-August 2005, closing at 7,860 on August 17, 2005. The rise in indices was accompanied with a sharp increase in turnover in a market flush with liquidity. The rally in the stock markets was broad-based and spread widely across small and mid-cap companies from various sectors. FIIs evinced keen interest in the Indian capital market.
Primary Market
I.5.35 Resource mobilisation from the primary market through public issues (excluding offers for sale) almost trebled during 2004-05 (Table 1.57). The
Table 1.57: Mobilisation of Resources from the Primary Market
| |
|
|
|
(Amount in Rupees crore) |
| |
|
|
|
|
|
|
|
|
|
Item |
|
|
2004-05P |
2003-04 |
| |
|
|
|
|
|
|
|
|
| |
|
|
|
|
No. |
Amount |
No. |
Amount |
| |
|
|
|
|
of |
|
of |
|
| |
|
|
|
Issues |
|
Issues |
|
| |
|
|
|
|
|
|
|
|
|
1 |
|
|
|
|
2 |
3 |
4 |
5 |
| |
|
|
|
|
|
|
|
|
|
A. |
Prospectus and Rights Issues* |
|
|
|
|
| |
1. Private Sector (a+b) |
|
54 |
13,482 |
38 |
3,675 |
| |
|
|
|
|
|
(266.9) |
|
(95.7) |
| |
|
a) |
Financial |
|
11 |
5,702 |
4 |
1,353 |
| |
|
b) |
Non-financial |
|
43 |
7,780 |
34 |
2,322 |
| |
2. Public Sector (a+b+c) |
|
5 |
8,410 |
9 |
4,176 |
| |
|
|
|
|
|
(101.4) |
|
(39.7) |
| |
|
a) |
Public Sector Undertakings |
– |
– |
– |
– |
| |
|
b) |
Government Companies |
|
1 |
2,684 |
1 |
100 |
| |
|
c) |
Banks/Financial Institutions |
4 |
5,726 |
8 |
4,076 |
| |
3. |
Total (1+2) |
|
59 |
21,892 |
47 |
7,851 |
| |
|
|
|
|
|
(178.8) |
|
(61.3) |
| |
|
Of which: |
|
|
|
|
|
| |
|
|
(i) Equity |
|
54 |
18,024 |
40 |
3,427 |
| |
|
|
(ii) Debt |
|
5 |
3,868 |
7 |
4,424 |
|
B. |
Private Placement |
|
|
|
|
|
| |
1. Private Sector |
|
716 |
35,144 |
640 |
18,760 |
| |
|
|
|
|
|
(90.5) |
|
( 30.7 ) |
| |
|
a) |
Financial |
|
255 |
20,974 |
344 |
12,551 |
| |
|
b) |
Non-financial |
|
461 |
14,770 |
296 |
6,209 |
| |
2. Public Sector |
|
198 |
48,308 |
234 |
45,141 |
| |
|
|
|
|
|
(7.0) |
|
(6.8) |
| |
|
a) |
Financial |
|
128 |
26,128 |
132 |
26,461 |
| |
|
b) |
Non-financial |
|
70 |
22,180 |
102 |
18,680 |
| |
3. Total (1+2) |
|
914 |
84,052 |
892 |
63,901 |
| |
|
|
|
|
|
(31.5) |
|
(-7.8) |
|
C. |
Total (A+B) |
|
970 |
1,03,718 |
909 |
71,091 |
| |
|
|
|
|
|
(45.9) |
|
(-1.0) |
| |
|
|
|
|
|
|
|
|
|
Memo : |
|
|
|
|
|
|
|
Euro Issues |
|
|
3,353 |
|
3,098 |
| |
|
|
|
|
|
(8.2) |
|
(9.6) |
|
P :Provisional.
* : Excluding offers for sale. – : Nil/Negligible.
Note: Data in parentheses are percentage variations over the
previous year. |
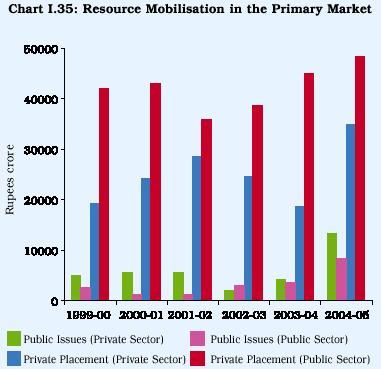
average size of a public issue was substantially higher at
Rs.371 crore in 2004-05 than Rs.168 crore in 2003-04 and Rs.106 crore during
the five-year period 1999-2004. The amounts raised through public issues more
than doubled to 0.7 per cent of GDP in 2004-05 from 0.3 per cent in the previous
year (Chart I.35).
I.5.36 Non-Government public limited companies (private sector)
accounted for 61.6 per cent of resources mobilised by way of public issues during
2004-05 as compared with 46.8 per cent during 2003-04 (Appendix Table I.45 and
Chart I.36). Banks and
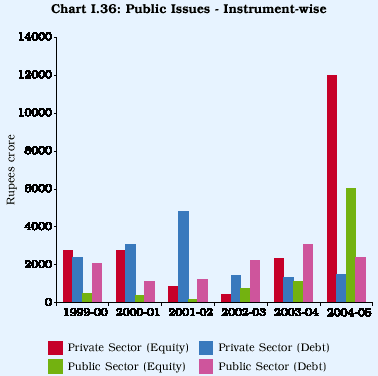
financial institutions (in both public and private sector)
mobilised 52.2 per cent of resources by public issues. Two public sector banks
raised equity worth Rs.3,336 crore during 2004-05. The share of the initial
public offerings (IPOs) by unlisted companies increased substantially during
2004-05, both in terms of number of issues and amounts raised. Out of 59 public
issues, 23 issues were IPOs, constituting 24.4 per cent of the total resource
mobilisation. All the IPOs generated enthusiastic investor response. Equity
issues constituted 82.3 per cent of the total resource mobilisation through
public issues during 2004-05 as compared with 43.7 per cent during the previous
year. Out of the 59 public issues during 2004-05, only five were debt issues.
The Indian corporate sector has been relying on the private placement route
for raising debt alongside tapping the international markets.
I.5.37 During April-June 2005, resource mobilisation through
public issues (excluding offers for sale) amounted to Rs.3,884 crore through
25 issues as compared with Rs.3,251 crore through five issues during April-June
2004. The bulk of resources were raised by way of equity issues. Non-Government
public limited companies (private sector) accounted for 41.6 per cent of resources
mobilised during April-June 2005. Two public sector banks raised equity worth
Rs.2,270 crore during April-June 2005.
I.5.38 Mobilisation of resources through private placement
underwent a substantial turnaround during 2004-05 (Table 1.57). Public sector
entities (both financial and non-financial) continued to dominate the private
placement market although their share fell to 57.5 per cent of the total mobilisation
from 70.6 per cent in 2003-04. Resources raised by financial intermediaries
(both public sector and private sector) accounted for 56.0 per cent of the total
mobilisation by private placements during 2004-05 as compared with 61.1 per
cent during 2003-04. While all-India
financial institutions, viz., IDBI, IFCI and IIBI, mobilised
Rs.4,541 crore through private placements during 2004-05, private and public
sector banks mobilised Rs.10,552 crore through private placements. The amount
raised by way of private placements increased to 2.7 per cent of GDP during
2004-05 from 2.3 per cent in the previous year.
I.5.39 During 2004-05, resources raised by Indian corporates
from the international capital markets increased by 8.2 per cent. These were
mainly by way of Global Depository Receipts (GDRs). There was no American Depository
Receipt (ADR) issue, while resource mobilisation through Foreign Currency Convertible
Bonds (FCCBs) recorded a marginal decline. Most of the issues were by private
non-financial companies. IT companies accounted for nearly half of the GDR issues.
During April-June 2005, the resources raised through Euro issues by Indian corporates
increased sharply by 138.5 per cent to Rs.1,834 crore.
Mutual Funds
I.5.40 Net funds mobilised by mutual funds (net of redemptions)
declined by 95.3 per cent during 2004-05 (Table 1.58). The UTI Mutual Fund and
public sector mutual funds recorded net outflows during 2004-05 in contrast
to net inflows during 2003-04. Net resource mobilisation by private sector mutual
funds was also substantially lower than in the previous year. Net assets under
management of mutual funds increased by 12.9 per cent during 2004-05.
I.5.41 The bulk of the resources mobilised by mutual funds
during 2004-05 were under liquid/ money market and growth/equity-oriented schemes
(Table 1.59). Mobilisation under debt schemes, which have traditionally been
garnering the largest amount of resources, declined during the year due to a
hardening of yields. Equity-oriented schemes
Table 1.58: Resource Mobilisation by Mutual Funds
| |
|
|
|
|
(Rupees crore) |
| |
|
|
|
|
|
|
|
Mutual Fund |
|
2004-05 |
|
|
2003-04 |
|
| |
|
|
|
|
|
|
| |
Gross |
Net |
Net |
Gross |
Net |
Net |
| |
Mobilisation |
Mobilisation@ |
Assets* |
Mobilisation |
Mobilisation@ |
Assets* |
| |
|
|
|
|
|
|
|
1 |
2 |
3 |
4 |
5 |
6 |
7 |
|
Private Sector Mutual Funds |
7,36,463 |
7,600 |
1,17,487 |
5,34,649 |
42,545 |
1,07,087 |
|
Public Sector Mutual Funds |
56,589 |
-2,677 |
11,374 |
31,548 |
1,667 |
11,912 |
|
UTI Mutual Fund |
46,656 |
-2,722 |
20,740 |
23,993 |
2,597 |
20,617 |
|
Total |
8,39,708 |
2,201 |
1,49,601 |
5,90,190 |
46,809 |
1,39,616 |
|
@: Net of redemptions. * : As at the end of March.
Source: Securities and Exchange Board of India. |
Table 1.59: Funds Mobilised by Mutual Funds - Type of Schemes
| |
|
|
|
|
|
|
|
(Amount in Rupees crore) |
| |
|
|
|
|
|
|
|
|
|
|
|
Scheme |
|
|
2004-05 |
|
|
|
|
2003-04 |
|
| |
|
|
|
|
|
|
|
|
|
|
| |
|
No. of |
Gross |
|
Net |
Net |
No. of |
Gross |
Net |
Net |
| |
|
Schemes |
Mobilisation |
Mobilisation@ |
Assets* |
Schemes |
Mobilisation |
Mobilisation@ |
Assets* |
| |
|
|
|
|
|
|
|
|
|
|
|
1 |
|
2 |
3 |
|
4 |
5 |
6 |
7 |
8 |
9 |
| |
|
|
|
|
|
|
|
|
|
|
|
A. Income/Debt |
|
|
|
|
|
|
|
|
|
|
Oriented Schemes |
227 |
7,98,674 |
-5,244 |
1,06,250 |
197 |
5,60,972 |
39,603 |
1,10,255 |
|
(i) |
Liquid/Money Market |
39 |
6,38,594 |
10,348 |
54,068 |
36 |
3,75,646 |
24,577 |
41,704 |
|
(ii) |
Gilt |
30 |
4,361 |
-1,345 |
4,576 |
30 |
12,387 |
2,232 |
6,026 |
|
(iii) |
Debt (other than assured return) |
158 |
1,55,719 |
-14,247 |
47,605 |
131 |
1,72,940 |
12,805 |
62,524 |
|
(iv) |
Debt (assured return) |
0 |
0 |
|
0 |
0 |
0 |
0 |
-10 |
0 |
| |
|
|
|
|
|
|
|
|
|
|
|
B. Growth/Equity Oriented Schemes |
188 |
37,280 |
7,100 |
38,484 |
169 |
26,695 |
7,219 |
25,281 |
|
(i) |
Equity Linked |
|
|
|
|
|
|
|
|
|
| |
Savings Schemes |
37 |
155 |
|
-194 |
1,727 |
43 |
53 |
-466 |
1,668 |
|
(ii) |
Others |
151 |
37,125 |
7,294 |
36,757 |
126 |
26,642 |
7,685 |
23,613 |
|
C. Balanced Schemes |
35 |
3,755 |
|
345 |
4,867 |
37 |
2,523 |
-13 |
4,080 |
|
D. Fund of Funds Scheme |
12 |
1,827 |
|
59 |
980 |
8 |
1,189 |
777 |
816 |
|
Total |
|
462 |
8,41,535 |
2,260 |
1,50,581 |
411 |
5,91,379 |
47,587 |
1,40,431 |
|
@ : Net of redemptions. * : As at the end of March.
Source: Securities and Exchange Board of India. |
attracted higher funds mainly due to attractive returns in a buoyant secondary market. A substantial amount was parked in liquid/money market schemes which accounted for 35.9 per cent of total assets under management, followed by debt-oriented schemes (31.6 per cent). Net assets under equity-oriented schemes increased sharply by 52.2 per cent on account of increase in the market value of the equity portfolio. During April-June 2005, net funds mobilised by mutual funds declined by 32.5 per cent to Rs.14,273 crore mainly due to large redemptions.
All-India Financial Institutions
I.5.42 Financial institutions (FIs) can raise resources from the markets provided that the total outstanding at any time does not exceed 10 times their Net Owned Funds (NOF). Consequent upon IDBI converting itself into a scheduled bank with effect from October 2004, and IFCI and IIBI’s NOF turning negative, the aggregate umbrella limit for raising of resources declined from Rs.23,873 crore on April 2, 2004 to Rs.16,160 crore on March 18, 2005. In the event, the aggregate amount of outstanding resources mobilised by FIs by way of these instruments declined from Rs.6,496 crore (27.2 per cent of limit) on April 2, 2004 to Rs.2,431 crore (15.0 per cent of limit) on March 18, 2005. On an average basis, CP was the most preferred instrument (Rs.2,387 crore), followed by term deposits (Rs.1,305 crore). Besides the erstwhile IDBI, only the EXIM Bank, NHB, IDFC and SIDBI were active in mobilising through these instruments during 2004-05. The aggregate umbrella limit increased to Rs. 17,536 crore on July 8, 2005 and the aggregate amount of outstanding resources raised by these FIs also increased to Rs.3,145 crore (17.9 per cent of limit).
1.5.43 Total resources mobilised by the All-India Financial Institutions (AIFIs), excluding erstwhile IDBI, increased by 16.4 per cent during 2004-05. FIs such as IFCI Ltd. and IIBI Ltd. continued to be barred from mobilising fresh resources on account of their poor financial performance. While the weighted average maturity of the instruments issued shortened, the weighted average cost of funds rose across the FIs (Table 1.60). Financial assistance sanctioned and disbursed by AIFIs declined by 8.6 per cent and 21.1 per cent, respectively (Appendix Table I.46).
Secondary Market
I.5.44 The stock market exhibited sustained buoyancy in the latter half of 2004-05 after a volatile period during April-June 2004. Gaining a speedy recovery from the decline on May 17, 2004, the BSE Sensex gathered momentum to close at its intra-year peak of 6915 on March 8, 2005 (Appendix Table I.47 and Chart I.37). The dramatic drop in the Indian stock markets on May 17, 2004 reflected domestic political uncertainties as well as adverse investor sentiment
| |
|
|
|
|
|
(Amount in Rupees crore) |
| |
|
|
|
|
|
|
|
|
|
|
Institution |
Resources Raised |
Outstanding |
Weighted Average |
Weighted Average |
| |
|
|
|
Borrowings |
Cost of Funds |
(Per cent) |
Maturity (years) |
| |
|
|
|
|
|
|
|
|
|
| |
|
2004-05 |
2003-04 |
March 2005 |
March 2004 |
2004-05 |
2003-04 |
2004-05 |
2003-04 |
| |
|
|
|
|
|
|
|
|
|
|
1 |
|
2 |
3 |
4 |
5 |
6 |
7 |
8 |
9 |
| |
|
|
|
|
|
|
|
|
|
|
IIBI |
|
.. |
176 |
2,229 |
2,420 |
.. |
8.7 |
.. |
18.0 |
|
IFCI |
|
.. |
.. |
13,385 |
17,564 |
.. |
8.2 |
.. |
3.2 |
|
TFCI |
|
23 |
172 |
421 |
546 |
10.4 |
8.6 |
4.9 |
10.0 |
|
Exim Bank |
5,430 |
6,881 |
14,704 |
12,752 |
6.6 |
5.9 |
4.2 |
6.7 |
|
IDFC |
|
4,253 |
3,575 |
6,533 |
3,975 |
6.0 |
5.6 |
3.7 |
5.9 |
|
SIDBI |
|
2,364 |
2,972 |
8,427 |
10,535 |
5.9 |
4.9 |
1.9 |
2.8 |
|
NABARD |
8,843 |
5,334 |
23,805 |
11,883 |
5.5 |
5.4 |
5.0 |
5.4 |
|
NHB |
|
5,172 |
3,290 |
14,385 |
10,569 |
6.3 |
5.4 |
2.6 |
3.2 |
|
Total |
|
26,085 |
22,401 |
83,889 |
70,245 |
|
|
|
|
| |
|
|
|
|
|
|
|
|
|
|
.. : Not applicable.
Note:1. Data on resources raised include: long-term resources mobilised through bonds/debentures; short-term resources mobilised through commercial papers, certificates of deposit, ICDs, term deposits and term money; and
foreign currency resources mobilised through bonds.
2. Data are provisional.
Source:Respective Financial Institutions (FIs). |
in many other emerging market economies. Stock markets in South
Korea (-5.1 per cent), Taiwan (-5.1 per cent) and Thailand (-4.6 per cent) also
declined on the same day. The concerns arising out of the imposition of the
securities transaction tax had a short-lived impact on the markets.
I.5.45 Buoyant conditions resumed in the market during the second half of August
2004 in line with
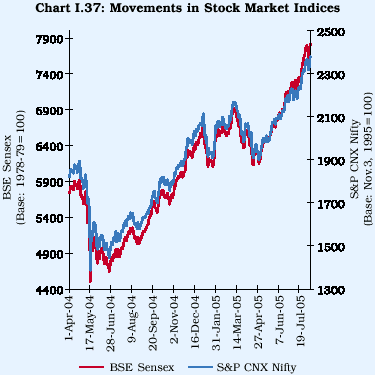
positive sentiments in world equity markets (Chart I.38). The
robust macroeconomic outlook, encouraging investment climate, strong investments
by FIIs, policy initiatives relating to foreign direct investment in telecom
and construction sectors and impressive financial performance of Indian companies
were the main factors that boosted the market sentiment in the second half of
the financial year. Consistent growth
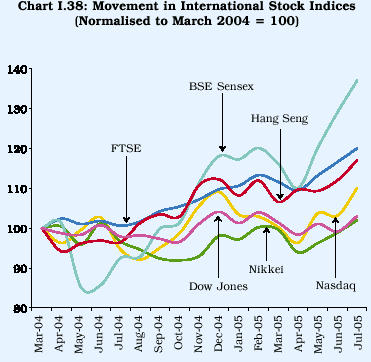
Table 1.61 Corporate Financial Performance
| |
|
|
|
|
|
|
|
(Growth rates in per cent) |
| |
|
|
|
|
|
|
|
|
|
|
|
Item |
|
|
2004-05 |
|
|
|
2003-04 |
|
| |
|
|
|
|
|
|
|
|
|
|
| |
2004-05 |
2003-04 |
Q4 |
Q3 |
Q2 |
Q1 |
Q4 |
Q3 |
Q2 |
Q1 |
| |
|
|
|
|
|
|
|
|
|
|
|
1 |
2 |
3 |
4 |
5 |
6 |
7 |
8 |
9 |
10 |
11 |
| |
|
|
|
|
|
|
|
|
|
|
|
Sales |
25.2 |
15.4 |
21.0 |
24.1 |
23.7 |
24.8 |
19.6 |
20.5 |
14.6 |
11.1 |
|
Expenditure |
24.0 |
14.7 |
19.8 |
24.3 |
22.4 |
23.4 |
17.5 |
20.7 |
14.8 |
11.6 |
|
Gross Profit |
38.9 |
26.6 |
35.3 |
30.5 |
35.8 |
36.0 |
37.8 |
25.3 |
18.2 |
16.0 |
|
Interest Cost |
-2.0 |
-11.5 |
-5.4 |
-13.0 |
2.1 |
-3.2 |
-17.1 |
-16.6 |
-15.9 |
-15.5 |
|
Profit after Tax |
53.8 |
57.9 |
51.4 |
45.5 |
45.3 |
51.2 |
67.2 |
52.3 |
54.6 |
40.6 |
|
Memo: |
|
|
|
|
|
|
|
|
|
|
|
No. of Companies |
1,273 |
2,201 |
1,301 |
1,464 |
1,353 |
1,255 |
1,386 |
1,263 |
1,213 |
1,202 |
| |
|
|
|
|
|
|
|
|
|
|
|
Note : 1.Growth rates are percentage change in the level in the period under reference over the corresponding period of the previous
year.
2.Data are based on the unaudited /audited abridged results of non-financial non-Government companies except column
(3) which are based on the audited balance sheets for 2003-04 . |
in corporate profits was a key factor driving markets (Table
1.61). Moderation in domestic inflation and easing of international crude oil
prices also contributed to the upsurge.
I.5.46 Stock markets exhibited weakness in April, 2005 reflecting
rise in international crude oil prices, slowdown of investment by FIIs and a
cautious approach adopted by investors ahead of the announcement of corporate
results for the last quarter of 2004-05. Buoyancy returned to the markets in
May 2005 with the declaration of satisfactory results by some companies, announcement
of fresh reform measures in the banking sector and firm trends in major international
markets. The stock market was invigorated in the third week of June 2005 with
the settlement of the Reliance family dispute and the revival of the monsoon.
The BSE Sensex crossed the 7000-mark during intra-day trading for the first
time in its history on June 20, 2005 and closed at an all-time high of 7860
on August 17, 2005. The BSE Sensex registered an increase of around 21 per cent
between August 17, 2005 and end-March 2005.
I.5.47 The rally in the stock market during 2004-05 was spread
across mid-cap and small-cap companies. The broad-based BSE 500 index increased
by 21.9 per cent on a point-to-point basis during 2004-05 as compared with an
increase of 16.1 per cent in the BSE Sensex. The major sectoral indices registered
gains during 2004-05 in line with the generally upbeat sentiment in the stock
market (Chart I.39).
I.5.48 The market capitalisation of the BSE increased by 41.4
per cent during 2004-05 reflecting increase in stock prices as well as listing
of new securities (Table 1.62 and Appendix Table I.48). Despite an increase
in stock prices, the price-earning (P/E) ratio remained generally attractive
due to an increase in corporate earnings. Although the P/E ratio of the BSE
Sensex was marginally higher than in other emerging markets, the ratio is much
lower than in earlier years. Volatility in the stock market declined substantially
during 2004-05 although it remained higher than most of the international stock
markets. The number of companies listed in the BSE came down due to mergers
and acquisitions and de-listing of companies.
I.5.49 The turnover in major stock exchanges increased with
a surge in liquidity. The average daily turnover (BSE and NSE) increased by
3.5 per cent during 2004-05. The increase in turnover in equity derivatives
was even stronger at 19.5 per cent
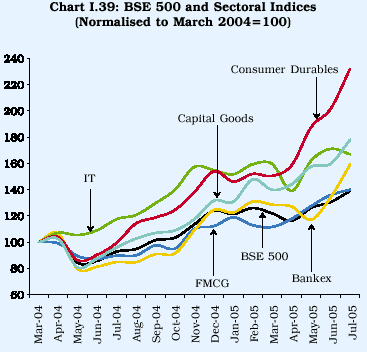
Table 1.62: Indian Equity Markets –Key Indicators
|
Indicator |
BSE |
NSE |
| |
|
|
|
|
|
| |
|
2004-05 |
2003-04 |
2004-05 |
2003-04 |
| |
|
|
|
|
|
|
1 |
|
2 |
3 |
4 |
5 |
| |
|
|
|
|
|
|
1. |
BSE Sensex/ |
|
|
|
|
| |
S&P CNX Nifty |
|
|
|
|
| |
(i) Average |
5741 |
4492 |
1805 |
1427 |
| |
(ii) End of the year |
6493 |
5591 |
2036 |
1772 |
|
2. |
Coefficient of |
|
|
|
|
| |
Variation (Per cent) |
11.2 |
23.0 |
11.3 |
23.3 |
|
3. |
Price-Earning Ratio@ 16.6 |
16.2 |
14.8 |
16.1 |
|
4. |
Price-Book Value Ratio@ 3.3 |
2.8 |
3.3 |
3.1 |
|
5. |
Yield@ (Per cent |
|
|
|
|
| |
per annum) |
2.0 |
2.0 |
2.2 |
2.1 |
|
6. |
Number of |
|
|
|
|
| |
Listed Companies |
4,731 |
5,528 |
970 |
909 |
|
7. |
Turnover |
|
|
|
|
| |
(Rs. crore) |
5,18,717 |
5,02,620 |
11,40,071 |
10,99,535 |
|
8. |
Market |
|
|
|
|
| |
Capitalisation |
|
|
|
|
| |
(Rs. crore)# |
16,98,428 |
12,01,207 |
15,85,585 |
11,20,976 |
| |
|
|
|
|
|
|
@: Annual averages for 30 scrips included in the BSE Sensex and 50
scrips included in the S&P CNX NIfty.
#: As at end-March.
Source : The Stock Exchange, Mumbai and the National Stock Exchange of
India Limited. |
(Chart I.40 and Appendix Table I.49). Trading in stock futures
accounted for a significant portion of turnover in equity derivatives.
I.5.50 During 2004-05, foreign institutional investors (FIIs) continued to
invest heavily in the Indian equity
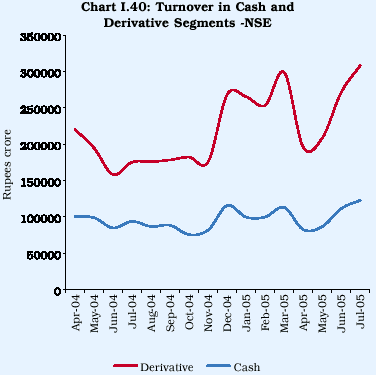
Table 1.63: Trends in Institutional Investments
| |
| |
|
|
(Rupees crore) |
| |
|
|
|
|
|
Year |
FIIs |
|
Mutual Funds |
| |
Net |
Net |
Net |
Net |
| |
Investment |
Investment |
Investment |
Investment |
| |
in Equity |
in Debt |
in Equity |
in Debt |
| |
|
|
|
|
|
1 |
2 |
3 |
4 |
5 |
| |
|
|
|
|
|
2002-03 |
2,527 |
60 |
-2,067 |
12,604 |
|
2003-04 |
39,959 |
5,805 |
1,308 |
22,701 |
|
2004-05 |
44,123 |
1,759 |
448 |
16,987 |
|
Source: Securities and Exchange Board of India. |
market. As net buyers in equities during each month, barring May 2004, net equity investments by the FIIs in the Indian equity market increased by 10.4 per cent during 2004-05. FII investment in debt instruments was, however, lower in 2004-05 than in the previous year (Table 1.63). Mutual funds continued to remain net buyers in equities during 2004-05. Their investments in debt were lower in line with a fall in resource mobilisation under debt schemes. During 2005-06 (up to August 11, 2005), FIIs made net investments of Rs.15,451 crore in equity as compared with Rs.6,249 crore in the corresponding period of the previous year. Mutual funds made net investments of Rs.4,087 crore in equity during 2005-06 (up to August 11, 2005) as compared with net sales of Rs.190 crore in the corresponding period of the previous year.
Developments in Wholesale Debt Market Segment of NSE
I.5.51 In the Wholesale Debt Market (WDM) segment of NSE, 3,097 securities were available for trading as on March 31, 2005 as compared with 2,621 securities as on March 31, 2004. The turnover in WDM, however, declined by 32.6 per cent to Rs.8,87,294 crore in 2004-05. Transactions in dated securities accounted for the bulk of trading - 95.7 per cent of the total traded value during 2004-05. Transactions in corporate debt securities accounted for only 2.0 per cent of total traded volume in the WDM segment. Total market capitalisation of the securities available for trading on the WDM segment worked out to Rs.14,61,734 crore as on March 31, 2005.
I.5.52 To conclude, during 2004-05, domestic financial markets remained stable, even as interest rates in various segments edged up. In the foreign exchange market, the rupee appreciated vis-à-vis the US dollar, reflecting excess supply conditions. The stock markets exhibited buoyant conditions reflecting a robust macroeconomic outlook.
VI. EXTERNAL SECTOR
I.6.1 Several significant developments underscored the strength and vibrancy in India’s external sector in 2004-05. First, merchandise export growth exceeded 24 per cent in US dollar terms, extending a phase of high growth that began in 2002-03. Second, there was a massive increase in merchandise imports, driven up by the upsurge in international crude oil prices and a strong resumption of domestic investment demand. As a consequence, the trade deficit increased substantially during 2004-05. Third, notwithstanding strong growth in net invisible receipts – mainly backed by services exports and remittances from Indians employed abroad – the current account slipped into a modest deficit after a continuous span of three years of surpluses. Fourth, private capital, led by portfolio flows in stock exchanges, endorsed the attractiveness of the Indian economy relative to other emerging market economies (EMEs) as an investment destination on account of its strong macroeconomic performance. Fifth, the intermittent surges in portfolio flows were accompanied by sizeable expansion in recourse to debt flows in the form of trade credit – both short and long-term. The favourable sentiment for India in international financial markets was buoyed up by upgrades of the sovereign rating in 2004-05 by Standard & Poor’s Rating Services. Sixth, by March 2005, India had accumulated the fifth largest stock of international reserves in the world, sufficient to finance about 14 months of imports. As a result, India’s international investment position showed a marked improvement. The robust external sector performance facilitated further liberalisation of the exchange and payments system.
INTERNATIONAL DEVELOPMENTS
I.6.2 Global GDP expanded by 5.1 per cent during 2004 - the highest rate of growth since 1976. In advanced economies, growth accelerated to 3.4 per cent in 2004 from 2.0 per cent in 2003, led by the US; in emerging market and developing economies, it accelerated to 7.2 per cent from 6.4 per cent. With GDP growing by 9.5 per cent, driven by strong fixed investment demand and exports, China emerged as the world’s fastest growing economy, underpinning the strength of global growth. The acceleration in global economic activity was accompanied by a doubling of the growth of world trade volumes from 4.9 per cent in 2003 to 9.9 per cent in 2004.
I.6.3 Private capital flows to emerging market and developing countries increased to near 1997 (pre-Asian crisis) levels during 2004, mainly in the form of foreign direct investment (FDI) flows (Table 1.64). Asia
Table 1.64: Net Capital Flows to Emerging Markets and Developing Countries
| |
| |
|
| |
(US $ billion) |
| |
|
|
|
|
Item |
2004 |
2003 |
2002 |
|
1 |
2 |
3 |
4 |
| |
|
|
|
|
Private Capital Flows |
196.6 |
149.5 |
75.8 |
|
Private Direct Investment |
186.4 |
151.9 |
144.4 |
|
Private Portfolio Investment |
28.8 |
-9.9 |
-90.0 |
|
Other Private Capital Flows |
-18.6 |
7.5 |
21.4 |
|
Official Flows |
-58.0 |
-58.1 |
8.5 |
| |
|
|
|
|
Source: World Economic Outlook, IMF, April 2005. |
continued to be a major recipient, led by China. The western
Hemisphere also received a significant increase, particularly, Mexico and Brazil,
boosted by increased cross-border merger and acquisition activity in the banking
and manufacturing sectors.
I.6.4 Abundant liquidity characterised global financial markets
in 2004. Monetary authorities in the US, the UK, Canada and New Zealand gradually
tightened the key policy rates. Nonetheless, the longer-term government bond
yields fell in a number of advanced economies, resulting in a flattening of
the yield curve. Financial conditions thus remained accommodative, attributable
to the decline of longer-term treasury yields, corporate credit spreads and
mortgage rates.
I.6.5 Looking forward, rising interest rates, high oil prices
and large global macroeconomic imbalances combined with the waning of the fiscal
stimulus that has supported growth in the recent past carry downside risks for
world growth in 2005. According to the IMF, a permanent US $ 5 per barrel increase
in oil prices is estimated to lower global GDP growth by up to 0.3 percentage
points. Macroeconomic imbalances widened further with the US current account
deficit estimated at 5.7 per cent of GDP in 2004, matched by current account
surpluses in emerging Asia, Japan and the oil producing Middle-East countries.
US deficits were financed significantly by Asian central banks, contrary to
the traditional predominance of foreign investors in funding the gap. There
is a widespread view that an orderly adjustment of global imbalances calls for
fiscal consolidation and greater exchange rate flexibility supported by continuing
financial sector reforms in Asia and intensified structural reforms to boost
growth and domestic demand in the Euro area.
I.6.6 Against this backdrop, global economic growth is projected
by the IMF to decelerate to 4.3 per cent in 2005 (Chart I.41). Amongst major
economies, growth in the US is expected to be supported by higher investment
and consumer demand. In the Euro area,
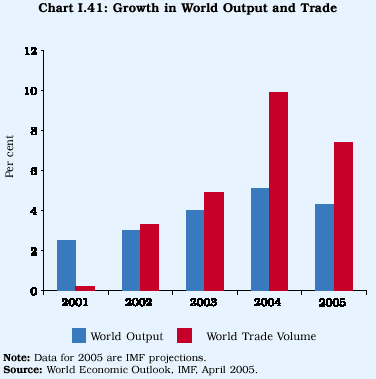
however, business sentiment remains fragile and consumer demand
sluggish, mainly on account of faltering exports and weak domestic demand. In
Japan, cautious optimism is gaining ground about revival of consumer demand.
Despite the losses suffered by Tsunami-affected countries towards the
end of 2004, growth rates in Asian EMEs are likely to remain strong, led by
China and India, and aided by various factors including strong domestic demand
and liberalisation of textile trade.
BALANCE OF PAYMENTS
I.6.7 After three years beginning in 2001-02, India’s balance
of payments recorded the return of a current account deficit in 2004-05. The
turnaround was driven by the merchandise trade deficit reaching 5.5 per cent
of GDP, but underpinned by an intrinsic link between import intensity and export
performance (Table 1.65). Invisible receipts rose by 46.3 per cent, suppor ted
by buoyant ser vices expor ts and
Table 1.65: Balance of Payments – Key Indicators
| |
|
|
|
|
|
|
|
|
|
|
(US $ million) |
| |
|
|
|
|
|
|
|
|
|
|
|
|
Item/Indicator |
|
|
2004-05 (P) |
2003-04 |
2002-03 |
2001-02 |
2000-01 |
1990-91 |
| |
|
|
|
|
|
|
|
|
|
|
|
|
1 |
|
|
|
|
|
2 |
3 |
4 |
5 |
6 |
7 |
| |
|
|
|
|
|
|
|
|
|
|
|
|
i) |
|
Trade Balance |
|
|
-38,130 |
-15,454 |
-10,690 |
-11,574 |
-12,460 |
-9,437 |
|
ii) |
|
Invisibles, net |
|
|
31,699 |
26,015 |
17,035 |
14,974 |
9,794 |
-243 |
|
iii) |
Current Account Balance |
|
|
-6,431 |
10,561 |
6,345 |
3,400 |
-2,666 |
-9,680 |
|
iv) |
Capital Account |
|
|
32,175 |
20,542 |
10,840 |
8,551 |
8,840 |
7,056 |
|
v) |
|
Overall Balance # |
|
|
26,159 |
31,421 |
16,985 |
11,757 |
5,868 |
-2,492 |
|
vi) |
Foreign Exchange Reserves* |
|
|
-26,159 |
-31,421 |
-16,985 |
-11,757 |
-5,842 |
1,278 |
| |
|
[Increase(-)/Decrease(+)] |
|
|
|
|
|
|
|
|
|
Indicators (in per cent) |
|
|
|
|
|
|
|
|
|
1. |
|
Trade |
|
|
|
|
|
|
|
|
| |
|
i) |
Exports/GDP |
|
|
11.7 |
10.8 |
10.6 |
9.4 |
9.9 |
5.8 |
| |
|
ii) |
Imports/GDP |
|
|
17.2 |
13.3 |
12.7 |
11.8 |
12.7 |
8.8 |
| |
|
iii) |
Export Volume Growth |
|
|
n.a. |
6.0 |
21.7 |
3.9 |
23.9 |
11.0 |
|
2. |
|
Invisibles |
|
|
|
|
|
|
|
|
| |
|
i) |
Invisible Receipts/GDP |
|
|
11.2 |
8.8 |
8.2 |
7.7 |
7.1 |
2.4 |
| |
|
ii) |
Invisible Payments/GDP |
|
|
6.6 |
4.5 |
4.9 |
4.6 |
4.9 |
2.4 |
| |
|
iii) |
Invisibles (Net)/GDP |
|
|
4.6 |
4.3 |
3.3 |
3.1 |
2.2 |
-0.1 |
|
3. |
|
Current Account |
|
|
|
|
|
|
|
|
| |
|
i) |
Current Receipts@/GDP |
|
|
22.8 |
19.5 |
18.7 |
17.0 |
17.0 |
8.0 |
| |
|
ii) |
Current Receipts Growth@ |
|
34.6 |
23.0 |
17.6 |
4.5 |
14.8 |
6.6 |
| |
|
iii) |
Current Receipts@/Current Payments |
95.7 |
109.3 |
106.6 |
103.8 |
96.4 |
71.5 |
| |
|
iv) |
Current Account Balance/GDP |
-0.9 |
1.7 |
1.2 |
0.7 |
-0.6 |
-3.1 |
|
4. |
|
Capital Account |
|
|
|
|
|
|
|
|
| |
|
i) |
Foreign Investment/GDP |
|
|
2.1 |
2.7 |
1.2 |
1.7 |
1.5 |
0.0 |
| |
|
ii) |
Foreign Investment/Exports |
|
17.9 |
24.8 |
11.2 |
18.2 |
14.9 |
0.6 |
|
5. |
|
Others |
|
|
|
|
|
|
|
|
| |
|
i) |
Debt - GDP Ratio |
|
|
17.4 |
17.8 |
20.3 |
21.2 |
22.6 |
28.7 |
| |
|
ii) |
Debt Service Ratio |
|
|
6.2 |
16.3 |
16.4 |
13.4 |
16.6 |
35.3 |
| |
|
iii) |
Liability Service Ratio |
|
|
7.1 |
17.1 |
16.1 |
14.9 |
18.4 |
35.6 |
| |
|
iv) |
Import Cover of Reserves (in months) |
14.3 |
16.9 |
14.2 |
11.5 |
8.8 |
2.5 |
|
P:Preliminary.
#: Includes errors and omissions. @ : Excluding official transfers.
*:Excluding valuation changes. n.a. : Not available. |
sustained remittances from Indians working overseas. The innate
vigour of invisible earnings can be gauged from the fact that, despite a surge
in invisible payments of the order of 69.8 per cent, the massive merchandise
trade deficit was financed to the extent of 83.1 per cent by the net surplus
in the invisible account at US $ 31.7 billion. In the capital account, the surge
in imports was manifested in a large recourse to overseas borrowings by Indian
banks, trade credits and external commercial borrowings. According to the World
Economic Outlook (April 2005), portfolio flows to India accounted for 30.6 per
cent of global flows to EMEs and developing countries in 2004. Inflows of FDI
also picked up strongly during the year. The cumulative impact of liberalisation
in the policy regime was reflected in a noteworthy rise in India’s outward FDI
and aid flows, coincident with the jump in invisible payments in the current
account. The accretion to reserves, excluding valuation effects, was of the
order of US $ 26.2 billion, somewhat lower than in 2003-04.
Merchandise Trade
I.6.8 Both exports and imports recorded sharp growth during
2004-05, reflecting the onset of international competitiveness of the manufacturing
sector in an environment of expanding trade integration, a supportive domestic
policy framework, sustained recovery in global demand and an increase in international
commodity prices. Exports at US $ 79.3 billion during 2004-05 registered a growth
of 24.1 per cent, the highest recorded in the last three decades and substantially
higher than the annual target of 16 per cent set by the Ministry of Commerce
and Industry. Export growth was broad-based across major product groups (Char
t I.42). Exports of agricultural and allied products remained subdued, reflecting
domestic supply conditions; on the other hand, exports of ores and minerals
recorded a substantial jump during 2004-05, mainly on account of iron ore exports
to China.
I.6.9 Exports of manufactured products maintained growth momentum
(20.0 per cent in 2004-05 as compared with 20.5 per cent recorded in 2003-04)
(Appendix Table I.53). Among the key drivers, exports of engineering goods were
buoyed up by technology-intensive items like metal, machinery and instruments,
transport equipment, electronic goods and iron and steel due to demand picking
up in East Asia, China and non-traditional markets like Latin America and Africa.
Exports of gems and jewellery continued to record a sharp increase, reflecting
the benefits of various promotional measures as well as recovery in
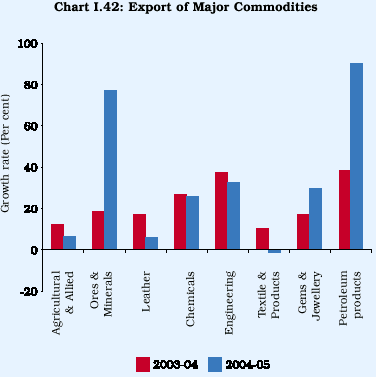
major markets like the US. Exports of petroleum products surged
by 90.3 per cent, reflecting the expansion in domestic refining capacity and
higher international prices of refined products. India emerged among the top
five petroleum refining countries in the world. In the textile segment, exports
of domestic raw materials (cotton yarn, fabrics, made-ups) and readymade garments
declined while those using synthetic/imported raw materials (manmade yarn, fabrics,
made-ups, etc.) recorded a significant increase. World trade in textiles
and clothing is geared for a more competitive environment due to the elimination
of quota restrictions under the Multi-Fibre Arrangement with effect from January
2005.
I.6.10 In terms of destination, exports were well-diversified
with Singapore, China and Belgium being the fastest growing markets during 2004-05,
driven by several initiatives under bilateral trade negotiations (Chart I.43).
Exports to East Asian countries including Hong Kong, South Korea, Singapore,
Malaysia and Thailand also recorded a pick-up in growth. Exports to the OECD
countries increased significantly as demand conditions improved.
I.6.11 Imports at US $ 107.1 billion grew by 37.0 per cent
in 2004-05 - the highest since 1980-81 - on top of 27.3 per cent in 2003-04
(Appendix Table I.52). Oil imports at US $ 29.8 billion shot up by 45.1 per
cent in 2004-05, mainly on account of the surge in international crude oil prices
as in volume terms, the growth rate of oil imports slowed to 5.5 per cent in
2004-05 from 10.6 per cent in 2003-04.
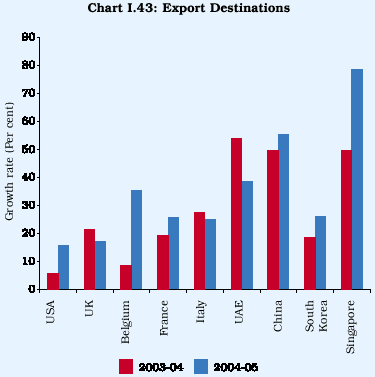
I.6.12 Non-oil imports maintained the momentum of growth recorded
in the previous year, in tandem with the pick-up in domestic manufacturing activity.
Non-oil impor ts, excluding gold and silver, increased by 30.9 per cent during
2004-05. Imports of mainly industrial inputs (non-oil imports net of gold and
silver, bulk consumption, manufactured fertilisers and professional instruments)
grew by 32.8 per cent during 2004-05 as compared with 29.1 per cent during 2003-04.
Imports of capital goods (mainly compr ising metals, machine tools, machinery
and electronic goods), in particular, posted a significant growth of 23.5 per
cent during 2004-05 on the top of 35.4 per cent growth during 2003-04 (Chart
I.44). During 2004-05, imports of gold and silver at US $ 10.8 billion posted
a high growth of 57.9 per cent, similar to the increase during 2003-04 (Appendix
Table I.54). India has traditionally been a leading destination for global gold
trade. The sharp rebound in household demand in an environment of high economic
growth and softening of gold prices contributed to growth of gold imports. More
recently, the new Foreign Trade Policy 2004-09 has provided various incentives
pertaining to duty free import of gold and jewelleries for exporters.
I.6.13 During 2004-05, there was a well-distributed increase
in imports across major regions. The sourcing pattern of imports showed a distinct
tilt in favour of the Asian countries. China turned out to be the largest source
of India’s imports, surpassing the US.
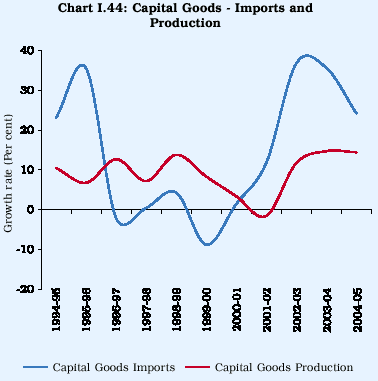
I.6.14 The merchandise trade deficit at US $ 27.8 billion during
2004-05 touched a historic peak with the increase in non-oil imports (US $ 29.8
billion) being the major contributing factor (Appendix Table I.52). The non-oil
trade balance, which remained in surplus during 2000-01 to 2003-04, turned into
a deficit of US $ 4.8 billion during 2004-05.
I.6.15 The pace of expansion of merchandise trade has enlarged
the degree of India’s openness. The ratio of merchandise trade to GDP increased
to 28.8 per cent in 2004-05 from 14.6 per cent in 1990-91. India’s share in
world exports increased to 0.84 per cent during 2004 from 0.52 per cent in 1990.
The changing structure of India’s exports across commodity groups and destinations
provides evidence of the underlying shifts in the production structure and rising
levels of competitiveness and productivity. The export basket is well-diversified,
ranging from products from the low-value addition chain to items with high technology
content. The diversification of the export basket has improved since the 1990s.
According to the United Nations Conference on Trade and Development (UNCTAD),
India is among the top ten exporters in as many as 32 commodities out of 70
leading export items from developing economies. The share of these commodities
in aggregate world exports is about 22 per cent. These 32 commodities account
for about 60 per cent of India’s total exports.
I.6.16 During 2005-06 (April-July), the underlying pace of
merchandise export growth in US dollar terms (21.3 per cent) remained firm,
although there was some loss of momentum from a year ago (31.2 per cent). Besides
the high base of the previous year, seasonal demand patterns associated with
various commodity sectors and the evolving configurations in global demand impacted
on export performance in 2005-06 (April-July). Preliminary information indicates
that engineering goods led by transport equipments, metals and manufactures,
machinery and parts and chemicals were the key drivers of export growth. Among
other products, rice, iron ore, marine products, plastic and linoleum, readymade
garments and petroleum products showed strong growth. Imports surged in an environment
of buoyant economic activity. Imports during April-July 2005 increased by 36.4
per cent (35.2 per cent a year ago), driven by both oil and non-oil imports.
The rise in oil imports (32.3 per cent) was propelled by a sharp increase in
international crude oil prices as well as a pick-up in volume growth. Non-oil
imports (38.1 per cent) maintained high growth during April-July 2005 (28.0
per cent a year ago) in tune with acceleration in industrial activity. Non-oil
imports excluding gold and silver witnessed substantial increase at 61.1 per
cent during April-May 2005 (17.2 per cent a year ago), led by impor ts of mainly
industrial inputs (bulk consumption goods, manufactured fertilisers and professional
instruments). Within industrial inputs, capital goods were the key driver posting
a growth of 34.3 per cent in April-May 2005 (22.7 per cent a year ago). The
robust expansion of imports of capital goods, accompanied by a strong growth
of domestic production of capital goods, reflects the substantial build-up in
capacity of the industrial sector. The trade
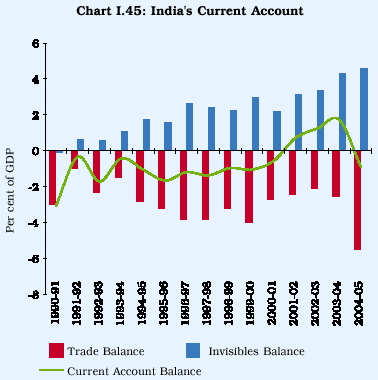
deficit surged 82 per cent to US $ 14.0 billion during April-July
2005 from US $ 7.7 billion during April-July 2004. Increase in non-oil imports
was the major factor underlying the expansion in the trade deficit. During April-May
2005, the non-oil trade balance showed a deficit of US $ 2.7 billion as against
a marginal surplus of US $ 0.1 billion a year ago.
Invisibles
I.6.17 A sustained rise in net invisible surpluses has moderated
the impact of growing trade deficits since the 1990s, eventually driving the
current account into surplus during 2001-02 to 2003-04 (Chart I.45).
I.6.18 During 2004-05, the net invisible surplus at 4.6 per
cent of GDP was able to finance 83.1 per cent of the trade deficit. Service
exports and remittances from Indians working abroad were the key drivers. Gross
earnings from invisibles constituted 49.1 per cent of external current receipts
in 2004-05, significantly above 29.3 per cent in 1990-91 (Chart I.46).
Services
I.6.19 According to the IMF’s Balance of Payments Statistics
Yearbook 2004, India emerged as the 18th largest service
exporter in the world in 2003, expanding its market share to 1.3 per cent from
0.6 per cent in 1990. Services exports were led by rapid rise in business and
professional services, travel and software services (Table 1.66). The compositional
shift in favour of software and business services became even more pronounced
in 2004-05.
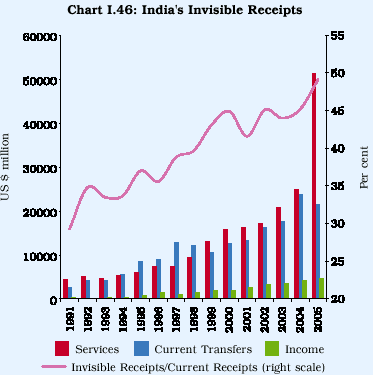
Table 1.66: Structure of India’s Services Exports
|
Year |
Amount |
Percentage Share in Total Services Exports |
|
| |
(US $ million) |
|
|
|
|
|
|
| |
|
Travel |
Transportation |
Insurance |
G.N.I.E. |
Software |
Miscellaneous* |
| |
|
|
|
|
|
|
|
|
1 |
2 |
3 |
4 |
5 |
6 |
7 |
8 |
| |
|
|
|
|
|
|
|
|
1970-71 |
292 |
16.8 |
49.7 |
5.5 |
13.7 |
0.0 |
14.4 |
|
1980-81 |
2,804 |
43.5 |
16.3 |
2.3 |
4.0 |
0.0 |
33.9 |
|
1990-91 |
4,551 |
32.0 |
21.6 |
2.4 |
0.3 |
0.0 |
43.7 |
|
2000-01 |
16,268 |
21.5 |
12.6 |
1.7 |
4.0 |
39.0 |
21.3 |
|
2003-04 |
24,949 |
16.5 |
13.1 |
1.7 |
1.1 |
48.9 |
18.7 |
|
2004-05 |
51,326 |
9.8 |
9.9 |
2.0 |
0.8 |
33.7 |
43.9 |
|
*: Excluding software services. G.N.I.E. : Government not included elsewhere. |
I.6.20 Travel receipts acquired a distinct buoyancy during 2004-05 (Table 1.67). The recent revival in tourist interest in India has resulted in a marginal improvement in India’s share in world tourist earnings to 0.74 per cent in 2003 (ranking 27th in world tourist earnings) from an average of 0.68 per cent in the late 1990s. Travel payments grew sharply, reflecting the impact of a liberalised exchange and payments regime and expanding business travel. In line with sustained growth in outbound tourist traffic, travel payments increased from US $ 3.5 billion in 2003-04 to US $ 5.5 billion in 2004-05, exceeding travel receipts. During 2004-05, while business travel continued to account for a major share of travel payments (about 60 per cent), there was a rebound in the share of tourist/leisure travel by Indians (21 per cent).
I.6.21 Business and professional services include a host of services such as communication, construction, financial services, software, news agency, royalties, license fee and management services. During 2004-05, the rapid growth in these services was contributed by communication and business services, besides software services. The category ‘business services’ emerged as an important driver of service exports. In recognition of their
Table 1.67: Foreign Tourist Arrivals in India and Outbound Tourist Traffic
|
Year |
Arrivals |
Growth |
Departure |
Growth |
| |
(millions) |
Rate (%) |
(millions) |
Rate (%) |
| |
|
|
|
|
|
1 |
2 |
3 |
4 |
5 |
| |
|
|
|
|
|
1992 |
1.9 |
11.3 |
2.2 |
15.8 |
|
2001 |
2.5 |
-4.2 |
4.6 |
4.5 |
|
2002 |
2.4 |
-4.0 |
4.9 |
6.5 |
|
2003 |
2.8 |
16.7 |
5.4 |
10.2 |
|
2004 (P) |
3.4 |
21.4 |
6.2 |
14.8 |
| |
|
|
|
|
|
P : Provisional.
Source: Ministry of Tourism, Government of India.
|
growing importance, new reporting arrangements were put in place in 2004-05 wherein a number of new purpose codes were introduced with a view to collect data separately for these services. During 2004-05, two-thirds of total service payments by India were contributed by imports of business and professional services. They included payments for construction, financial, communication and managerial services besides a host of other business services, reflecting the ongoing technological transformation of the economy and modernisation of Indian industry with a focus on technological upgradation.
Software Services and ITES-BPO
I.6.22 Exports of software and IT-Enabled Services recorded a strong growth of 34.4 per cent to reach US $ 17.2 billion in 2004-05 (Table 1.68). Notwithstanding increasing competitive pressures, India remains an attractive source of software exports because of low cost of operations, high quality and skilled manpower. Additionally, a favourable time zone difference helps organisations to run internal operations and render customer service round the clock. India’s software industry has progressively enhanced its market share in global IT spending from 1.5 per cent in 2000-01 to an estimated 2.2 per cent in 2004-05.
Table 1.68: Software and Services Exports of India
| |
|
(US $ million) |
| |
|
|
|
|
Year |
IT Services |
ITES-BPO |
Total Software |
| |
|
|
|
|
1 |
2 |
3 |
4 (2+3) |
| |
|
|
|
|
1995-96 |
754 |
– |
754 |
|
2000-01 |
5,287 |
930 |
6,217 |
|
2003-04 |
9,200 |
3,600 |
12,800 |
|
2004-05 |
12,000 |
5,200 |
17,200 |
| |
|
|
|
|
ITES : IT Enabled Services.
BPO : Business Process Outsourcing.
Source: NASSCOM.
|
Globally, India ranks second only to Ireland in exports of computer and IT services.
I.6.23 Within the software sector exports, the ITES-BPO industry recorded an even higher growth of 44.4 per cent in 2004-05, driven by increased offshoring by firms in America and Europe. The global market for software and services (including BPO) is projected to grow by 8.6 per cent per annum over 2004-08. With the industry structure undergoing transformation, established software service companies have entered into the ITES-BPO segment encouraged by cross-selling opportunities, critical mass, strong balance sheets and end-to-end service offerings. The structure of software service (including ITES-BPO) exports reveals that financial services including banks, insurance companies and securities firms account for the largest share of Indian software services (37 per cent). This is followed by manufacturing and the telecom sector (13 per cent each). Within the ITES, service lines, customer care and finance have been the fastest growing segments.
Private Transfers
I.6.24 Remittances remained buoyant during 2004-05 on the back of robust global growth, particularly in the US and oil exporting countries, and some improvement in remittance receiving infrastructure domestically. Remittances by Indians working abroad include repatriation of funds for family maintenance and local withdrawals from the non-resident Indian (NRI) deposits. The surge in remittances, par ticularly since the information technology revolution in the 1990s, has placed India as the highest remittance receiving country in the world (Table 1.69).
I.6.25 Remittances to India have emerged as a stable source of inflows with their share hovering around three per cent of GDP since the latter half of the 1990s. Private transfers have exhibited the lowest volatility, after merchandise expor ts, amongst components of current receipts. This stability reflects the increasing use of formal channels for remittance transfers backed by factors such as the institution of a market-determined exchange rate, current account convertibility and increasing availability of speedier and cost effective money transfer arrangements through the banking channels and post offices. While banking channels account for bulk of the inward remittances to India, two schemes, viz., Money Transfer Service Scheme (MTSS) and Rupee Drawing Arrangements (RDA) that provide benefits of easier and speedier operations have assumed significance in expanding the outreach of remittance services to remote locations in the country. During 2004 (January-December), remittances received under RDA and MTSS amounted to US $ 6.1 billion and US $ 1.2 billion, respectively (US $ 5.3 billion and US $ 0.9 billion, respectively, in 2003).
Investment Income
I.6.26 Investment income receipts continued to rise during 2004-05, reflecting mainly the income earned on foreign exchange reserves, a trend that set in since the late 1990s with the build up of foreign exchange reserves. A shift in the level of investment income payments since 2000-01 towards profits and dividends has been primarily on account of inclusion of reinvested ear nings of FDI enterprises as per the revised definition of recording FDI in India.
Table 1.69: Workers’ Remittances: Top Ten Remittance Receiving Countries
| |
|
|
|
(US $ million) |
| |
|
|
|
|
|
|
Country |
2003 |
Country |
1996 |
Country |
1991 |
| |
|
|
|
|
|
|
1 |
2 |
3 |
4 |
5 |
6 |
| |
|
|
|
|
|
|
India |
21,579 |
India |
8,453 |
Portugal |
4,517 |
|
Mexico |
13,266 |
Mexico |
4,224 |
Egypt |
4,054 |
|
Spain |
4,715 |
Portugal |
3,575 |
India |
3,275 |
|
Pakistan |
3,963 |
Turkey |
3,542 |
Turkey |
2,819 |
|
Morocco |
3,614 |
Egypt |
3,107 |
Mexico |
2,414 |
|
China |
3,343 |
Greece |
2,894 |
Greece |
2,115 |
|
Bangladesh |
3,180 |
Spain |
2,749 |
Morocco |
1,990 |
|
Colombia |
3,060 |
Morocco |
2,165 |
Spain |
1,792 |
|
Egypt |
2,961 |
Brazil |
1,866 |
Pakistan |
1,541 |
|
Portugal |
2,824 |
China |
1,672 |
Brazil |
1,057 |
|
Source: Balance of Payments Statistics Yearbook, IMF. |
Current Account
I.6.27 Reflecting the sharp rise in the merchandise trade deficit, the current account turned into a deficit from the second quarter of 2004-05 onwards and for the year as a whole, it was 0.9 per cent of GDP. In a national accounting perspective, the re-emergence of a current account deficit in 2004-05 represents a cessation of a brief period of export of domestic saving and the resumption of the supplemental role of foreign saving in financing higher investment and growth in the economy. This augurs well for the higher growth trajector y envisaged for the Indian economy over the medium-term. Many other EMEs such as China, Malaysia, the Philippines, Thailand, Korea, Indonesia, Argentina and Brazil, however, continued to record significant current account surpluses reflecting the counterpart to the massive current account deficit of the US.
Capital Account
I.6.28 Capital account developments continued to dominate the balance of payments outcome in 2004-05. In the first half of 2004-05, there was a considerable slowdown in foreign investment inflows while NRI deposits recorded outflows. Foreign investment inflows picked up sharply in the second half mainly on account of a revival of FII interest in Indian equities. External commercial borrowings and trade credit rose sharply during the second half of the year.
Foreign Investment
I.6.29 Foreign investment flows moderated during May-July 2004, but bounced back in the second half of the year (Table 1.70). The slowdown in the first half was on account of global uncertainties caused by hardening of crude oil prices and the upturn in the interest rate cycle. The resumption in the net FII inflows to India from August 2004 continued till the end of 2004-05.
I.6.30 FDI into India, including equity capital of unincorporated entities, reinvested earnings and inter-corporate debt transactions between the related entities, was higher in 2004-05 (Chart I.47). The improvement in FDI flows reflected the impact of recent initiatives aimed at creating an enabling environment for FDI and for encouraging infusion of new technologies and management practices. The decision to hike sectoral caps on FDI in telecom from 49 per cent to 74 per cent and in air transport
Table 1.70: Foreign Investment Flows to India
| |
|
| |
|
|
|
|
|
| |
|
|
|
(US $ million) |
| |
|
|
|
|
|
|
Item |
2004-05 (P) |
2003-04 |
2002-03 |
| |
|
|
|
|
|
|
1 |
|
|
2 |
3 |
4 |
| |
|
|
|
|
|
|
A. |
Direct Investment (I+II+III) |
5,536 |
4,673 |
5,035 |
| |
I. |
Equity (a+b+c+d+e) |
3,363 |
2,387 |
2,764 |
| |
|
a) Government (SIA/FIPB) |
1,062 |
928 |
919 |
| |
|
b) RBI |
1,259 |
534 |
739 |
| |
|
c) NRI |
– |
– |
– |
| |
|
d) Acquisition of shares* |
930 |
735 |
916 |
| |
|
e) Equity capital of |
|
|
|
| |
|
unincorporated bodies |
112 |
190 |
190 |
| |
II. |
Re-invested earnings |
1,816 |
1,798 |
1,833 |
| |
III. |
Other capital # |
357 |
488 |
438 |
|
B. |
Portfolio Investment (a+b+c) |
8,909 |
11,377 |
979 |
| |
a) |
GDRs/ADRs |
613 |
459 |
600 |
| |
b) |
FIIs @ |
8,280 |
10,918 |
377 |
| |
c) |
Off-shore funds and others |
16 |
– |
2 |
|
C. |
Total (A+B) |
14,445 |
16,050 |
6,014 |
|
P : Provisional – : Nil/Negligible.
* : Relates to acquisition of shares of Indian
companies by non - residents under Section 6 of FEMA 1999.
# : Data pertain to inter-company debt transactions of FDI entities.
@:Data represent net inflow of funds by FIIs.
Note:
1. Data on reinvested earnings for 2003-04 and 2004-05 are
estimates.
2. Data on foreign investment presented in this table represent
inflows into the country and may not tally with the data
presented in other tables. They may also differ from data
relating to net investment in stock exchanges by FIIs.
|
services (domestic airlines) from 40 per cent to 49 per cent buoyed investors’
interest in these sectors.
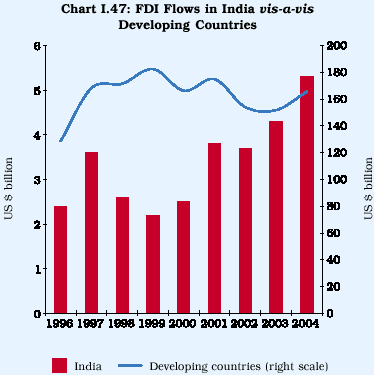
I.6.31 Country-wise details of FDI flows reveal the continued
predominance of Mauritius, the US and the Netherlands as major investors in
India (Table 1.71). FDI flows from Germany and Japan increased sharply during
2004-05. Sector-wise, FDI flows into India were attracted by the increasing
competitiveness of select manufacturing industries and services, particularly
business and computer services. At the global level, services have been the
key attraction for foreign direct investors, a structural shift indicative of
offshoring. In India, the services sector attracted the largest FDI flows -
US $ 1.2 billion in 2004-05 (US $ 0.9 billion in 2003-04). FDI flows into the
manufacturing sector more than doubled in 2004-05. India has steadily improved
its rank in terms of Outward FDI Performance Index (UNCTAD, World Investment
Report 2004) and FDI Confidence Index (AT Kearney) over the years, indicating
improved investment climate and better growth prospects (Chart I.48).
I.6.32 FII inflows in the Indian equity markets remained buoyant
during August-March 2004-05. Between mid-August 2004 and March 2005, the price-earning
(P/E) ratio of Indian equity stocks moved up to 13.5 from 11.5 (Table 1.72).
As a result, the return on equity declined to 1.8 per cent for Indian stocks
from 1.7-3.8 per cent in other major East Asian countries.
I.6.33 FII flows to India broadly follow the trends in developing economies
(Chart I.49).
India’s Direct Investment Abroad
I.6.34 An important development in India’s balance of payments
since the late 1990s has been the rising prominence of Indian investment abroad
through joint ventures and wholly owned subsidiaries. Cumulative
Table 1.71: Foreign Direct Investment to India: Country-wise and Industry-wise*
| |
|
(US $ million) |
| |
|
|
|
|
Source/Industry |
2004-05 (P) |
2003-04 |
2002-03 |
| |
|
|
|
|
1 |
2 |
3 |
4 |
|
Total FDI |
2,320 |
1,462 |
1,658 |
|
Country-wise Inflows |
|
Mauritius |
820 |
381 |
534 |
|
USA |
469 |
297 |
268 |
|
UK |
84 |
157 |
224 |
|
Germany |
143 |
69 |
103 |
|
Netherlands |
196 |
197 |
94 |
|
Japan |
122 |
67 |
66 |
|
France |
44 |
34 |
53 |
|
Singapore |
64 |
15 |
39 |
|
Switzerland |
64 |
5 |
35 |
|
South Korea |
14 |
22 |
15 |
|
Others |
300 |
218 |
227 |
|
Industry-wise Inflows |
|
Fisheries |
10 |
2 |
9 |
|
Mining |
11 |
18 |
9 |
|
Manufacturing |
924 |
426 |
480 |
|
Food and Dairy Products |
183 |
64 |
39 |
|
Electricity |
14 |
90 |
48 |
|
Construction |
209 |
172 |
237 |
|
Trade, Hotels & Restaurants |
22 |
67 |
39 |
|
Transport |
70 |
20 |
12 |
|
Financing, Insurance, Real Estate & |
|
|
|
|
Business Services |
363 |
206 |
223 |
|
Computer Services |
372 |
166 |
297 |
|
Educational Services |
2 |
0 |
1 |
|
Research & Scientific Services |
5 |
1 |
0 |
|
Health & Medical Services |
25 |
15 |
28 |
|
Other Services |
10 |
2 |
18 |
|
Others |
100 |
213 |
218 |
|
* : Data in this table exclude FDI inflows by way of
acquisition of shares by non-residents under section 6 of
FEMA, 1999.
P : Provisional. |
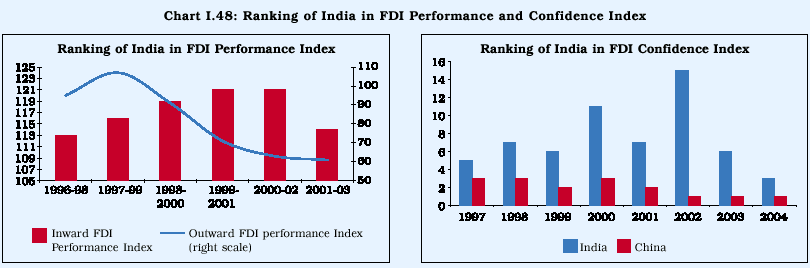
Table 1.72: Foreign Portfolio Investment Flows
|
Country |
|
Portfolio Inflows |
Price-Earnings |
| |
|
|
(US $ billion) |
|
Ratio (Per cent) |
| |
|
|
|
|
|
| |
|
2004 |
2003 |
2002 |
March 2005 |
|
1 |
|
2 |
3 |
4 |
5 |
|
Chile |
|
1.1 |
2.1 |
1.0 |
16.6 |
|
Hong Kong |
4.6 |
1.4 |
-1.1 |
14.4 |
|
India |
|
8.8 |
8.2 |
1.1 |
13.5 |
|
Philippines |
1.9 |
0.9 |
1.6 |
18.5 |
|
South Korea |
19.0 |
22.7 |
5.4 |
14.0 |
|
Thailand |
0.2 |
0.3 |
-0.7 |
9.8 |
|
Note :1.Data for the Philippines for calendar year 2004
are up to September.
2.Price-earnings ratio for India pertains to average for 100
scrips included in BSE-100.
Source :International Financial Statistics, IMF;
and The Stock Exchange, Mumbai. |
outward FDI flows crossed US $ 7 billion in 2004-05. Total
(equity and loans) investment abroad by Indian companies in 2004-05 stood at
US $ 1.5 billion, most of which went to the manufacturing sector. Outward FDI
has begun to grow rapidly, particularly through mergers and acquisitions (M&As)
(Table 1.73 and Box I.13).
I.6.35 In terms of the outward FDI stock, India is placed 20th
among developing economies. India’s rank had improved to 61 in 2003 (close to
China at 58) from 107 in 1999 in the Outward FDI Performance Index computed
by UNCTAD.
I.6.36 In recent years, following the convergence towards international
best practices, there has been a remarkable improvement in dissemination of
FDI
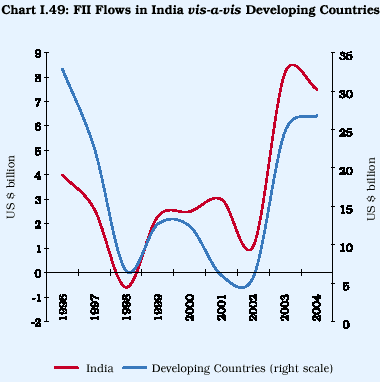
Table 1.73: Cross-Border Mergers and Acquisitions - India
| |
(US $ million) |
| |
|
|
|
Year |
Sales |
Purchases |
| |
|
|
|
1 |
2 |
3 |
| |
|
|
|
1997 |
1,520 |
1,287 |
|
1998 |
361 |
11 |
|
1999 |
1,044 |
126 |
|
2000 |
1,219 |
910 |
|
2001 |
1,037 |
2,195 |
|
2002 |
1,698 |
270 |
|
2003 |
949 |
1,362 |
|
Source : World Investment Report
2004, UNCTAD. |
statistics. The Survey of Implementation of Methodological Standards for Direct Investment (SIMSDI) adopted jointly by the IMF and the OECD is a step in improving the quality of FDI data (Box I.14).
Debt Flows
I.6.37 External assistance flows, net of principal repayments, turned positive in 2004-05 as against a net outflow (on account of pre-payments) in 2003-04. Net resource transfers under external assistance which had remained negative during 1995-2004 also turned positive in 2004-05.
I.6.38 Corporates’ recourse to ECBs was substantially higher in 2004-05, reflecting strong investment demand domestically as well as favourable financing conditions overseas. The narrowing down of spreads on emerging market bonds to historic lows in early 2005 was engendered by excess global liquidity and search for returns. Accordingly, the global investors, particularly pension funds and insurance companies showed a clear preference for investment in EME bonds. Indian corporates raised ECBs mainly for financing import of capital goods, local sourcing of capital goods, investment in new projects, modernisation/expansion of existing units and overseas investment in JVs/WOS (Table 1.74). The weighted average maturity period of ECBs during 2004-05 worked out to seven years.
I.6.39 NRI deposits recorded outflows of US $ 1.3 billion during the first half of 2004-05 reflecting the alignment of interest rates on NRE deposits to global interest rates. These outflows were partly offset in the period from November 2004 onwards following the revision in interest rates on NRE deposits to LIBOR/ SWAP rates of US dollar plus 50 basis points on October 26, 2004 (Table 1.75).
Box I.13
India’s Direct Investment Abroad
The regime for Indian investments overseas has been substantially liberalised in order to provide Indian industry access to new markets and technologies, including research and development, with a view to increasing competitiveness globally and strengthening exports. The acquisition of foreign companies which started off in the IT and related services sector has now spread to other areas (Table A).
Table A: India’s Direct Investment Abroad by Sectors
| |
|
|
|
(US $ million) |
| |
|
|
|
|
|
|
Industry |
2004-05 |
2003-04 |
2002-03 |
2001-02 |
2000-01 |
| |
|
|
|
|
|
|
1 |
2 |
3 |
4 |
5 |
6 |
| |
|
|
|
|
|
|
Financial Services |
6.9 |
1.4 |
3.0 |
4.3 |
6.3 |
|
Manufacturing |
1057.8 |
893.5 |
1270.8 |
527.6 |
169.1 |
|
Non-financial |
|
|
|
|
|
|
Services |
230.1 |
456.4 |
403.8 |
349.8 |
470.0 |
|
Trading |
175.5 |
112.8 |
82.5 |
79.3 |
51.6 |
|
Others |
76.8 |
31.5 |
37.8 |
20.0 |
11.3 |
|
Total |
1547.1 |
1495.6 |
1797.9 |
981.0 |
708.3 |
Many large Indian companies in basic industry such as steel, viscose fibre and copper have acquired upstream companies in resource-rich countries such as Canada and Australia with the objective of backward integration. Information technology and pharmaceutical companies have also come forward for investing abroad. While some of them are trying to develop stand-alone local operations, most work as market and market intelligence arms for the parent companies in India. Some domestic telecom companies have bought underground telephone cable networks from foreign companies for integrating their domestic telephone networks in the international network. Public sector oil companies are acquiring equities in exploration, retailing and refinery.
Destination-wise, the United States has attracted the highest level of FDI from India, followed by Russia and Mauritius (Table B). While most of the investment to Russia and Sudan went towards oil exploration, investments to the US have mostly gone into IT and pharmaceuticals. Indian firms have about 440 investments/joint ventures in the UK, mostly technology-oriented. There are more than 1,400 Indian companies operating in Singapore. Of these more than 450 are technology enterprises. More and more Indian companies are getting listed on New York Stock Exchange (NYSE), London Stock Exchange (LSE) and NASDAQ. Increase in FDI outflows has enabled Indian companies to expand and diversify their operations across a wider spectrum of countries for diffusion of technical innovations and managerial expertise.
Table B: Country-wise Approvals Issued between April 1995 and March 2005
| |
|
|
|
(US $ million) |
| |
|
|
|
|
|
|
Country |
No. of |
Equity |
Loan |
Guaran- |
Total |
| |
approvals |
|
|
tee |
|
|
1 |
2 |
3 |
4 |
5 |
6 |
| |
|
|
|
|
|
|
USA |
2268 |
1,762 |
163 |
234 |
2,159 |
|
Russia |
32 |
1,757 |
5 |
1 |
1,763 |
|
Mauritius |
388 |
682 |
182 |
174 |
1,038 |
|
Sudan |
5 |
964 |
– |
– |
964 |
|
British Virgin |
|
|
|
|
|
|
Islands |
87 |
769 |
19 |
136 |
924 |
|
UK |
633 |
584 |
101 |
92 |
777 |
|
Bermuda |
34 |
503 |
5 |
181 |
689 |
|
Hong Kong |
126 |
102 |
98 |
345 |
544 |
I.6.40 Trade credits rose strongly during the year to accommodate the higher financing requirements arising on account of oil and non-oil imports. The availability of suppliers’ credit for financing of gold imports for a period of one year also contributed to a sharp rise in access to trade credits in the beginning of 2004-05. Although trade credit can be availed of for financing import of capital goods up to three years,
Box I.14
Survey of Implementation of Methodological Standards for Direct Investment
The increasing importance of foreign direct investment (FDI) and its geographic and sectoral diversity has stimulated interest among policy makers, analysts and statisticians. In response, the first Survey of Implementation of Methodological Standards for Direct Investment (SIMSDI) was conducted in 1997 by the IMF and the OECD. A total of 114 countries responded and in 2001, the results were updated for 61 countries (30 OECD member countries and 31 selected non-OECD countries). The Survey was once again undertaken for the year 2003, encompassing a comprehensive study of data sources, collection methods, and dissemination and methodological practices for FDI statistics.
India participated in all the rounds of SIMSDI. India is among the first group of countries who could finalise the metadata for the SIMSDI 2003 within the given time frame and whose metadata has been posted on the IMF’s external website along with 43 other countries. The metadata for India for SIMSDI 2003 has been made available to the public in order to enable a better understanding of the Indian situation and to provide feedback to benchmark national compilation procedures to international best practices.
Table 1.74: ECB* Approvals during 2004-05
|
(US $ million) |
| |
|
|
Purpose |
Amount |
| |
|
|
1 |
2 |
| |
|
|
Import of Capital Goods |
3,059 |
|
Import of Non-capital Goods |
1 |
|
Local Sourcing of Capital Goods |
1,765 |
|
Working Capital |
134 |
|
On-lending or Sub-lending |
1,401 |
|
New Projects |
2,273 |
|
Modernisation/Expansion of Existing Units |
2,057 |
|
Overseas Investment in JV/WOS |
265 |
|
Textile/Steel Re-structuring Package |
100 |
|
Others |
435 |
|
Total |
11,490 |
|
* : Includes FCCBs. |
the share of the maturity bucket of one to three years is relatively insignificant. A reduction of the time period of trade credit for direct import of gold to 90 days in July 2004 had a moderating impact on gold imports.
I.6.41 Net inflows under banking capital were lower during 2004-05 than in the preceding year, attributable to outflows under NRI deposits. Overseas borrowings of banks remained volatile during the first half but were sizeable during October-December, 2004. Interest rate movements induced utilisation of nostro balances held by banks.
Table 1.75: Balances under NRI Deposit Schemes
| |
|
|
|
(US $ million) |
| |
|
|
|
|
|
| |
Scheme |
Outstanding (end-March) |
Net Inflows@ |
| |
|
2005P |
2004 |
2004-05P |
2003-04 |
|
1 |
|
2 |
3 |
4 |
5 |
|
1. |
FCNR(B) |
11,490 |
10,961 |
530 |
762 |
|
2. |
NR(E)RA |
21,109 |
20,559 |
-99 |
4,695 |
|
3. |
NR(NR)RD |
271 |
1,746 |
-1,500 |
-1,816 |
|
Total |
32,870 |
33,266 |
-1,069 |
3,641 |
| |
|
|
|
|
|
|
P: Provisional.
@: All figures are inclusive of accrued interest and valuation changes
arising on account of fluctuation in non-dollar currencies against the
US dollar.
Note : Net inflows in respect of NR(E)RA and NR(NR)RD deposits
in columns 4 and 5 may not match with the differences
between the outstanding stocks on account of exchange rate
fluctuations during the year. |
External Assistance Extended by India
I.6.42 India is emerging as an important donor to developing countries. External assistance provided by India rose to US $ 437 million in 2004-05 from US $ 247 million in 2000-01 (Table 1.76). India provides aid mainly in the form of technical cooperation and training. Grants continued to dominate the external aid with a share of about 70 per cent. The major beneficiaries of the assistance during 2004-05 were Bhutan, Sri Lanka, Myanmar, Nepal and the African countries.
Table 1.76: India's Grants and Loans to Foreign Governments
| |
|
|
|
|
|
(US $ million) |
| |
|
|
|
|
|
|
|
|
|
Item |
|
|
|
2004-05 |
|
|
2000-01 |
|
| |
|
|
Grant |
Loan |
Total |
Grant |
Loan |
Total |
|
1 |
|
|
2 |
3 |
4 |
5 |
6 |
7 |
|
A. |
Plan (External Affairs) |
101 |
62 |
164 |
76 |
44 |
120 |
|
B. |
Non-Plan (i+ii+iii) |
208 |
65 |
273 |
88 |
38 |
127 |
| |
i. |
External Affairs |
194 |
4 |
198 |
81 |
16 |
97 |
| |
|
Bangladesh |
1 |
4 |
5 |
2 |
16 |
18 |
| |
|
Bhutan |
70 |
0 |
70 |
44 |
0 |
44 |
| |
|
Nepal |
15 |
0 |
15 |
14 |
0 |
14 |
| |
|
Africa |
24 |
0 |
24 |
1 |
0 |
1 |
| |
|
Myanmar |
1 |
0 |
1 |
4 |
0 |
4 |
| |
|
Sri Lanka |
3 |
0 |
3 |
2 |
0 |
2 |
| |
|
Other Developing Countries |
80 |
0 |
80 |
14 |
0 |
14 |
| |
ii. Finance |
14 |
61 |
75 |
7 |
22 |
29 |
| |
|
Contribution to U.N.D.P. |
5 |
0 |
5 |
5 |
0 |
5 |
| |
|
Mauritius |
0 |
8 |
8 |
0 |
2 |
2 |
| |
|
Myanmar |
0 |
18 |
18 |
0 |
4 |
4 |
| |
|
Sri Lanka |
0 |
22 |
22 |
0 |
3 |
3 |
| |
|
Surinam |
0 |
9 |
9 |
0 |
0 |
0 |
| |
|
Other Countries |
3 |
4 |
7 |
2 |
13 |
15 |
| |
|
Development Assistance |
6 |
0 |
6 |
0 |
0 |
0 |
| |
iii.Shipping |
0 |
0 |
0 |
1 |
0 |
1 |
| |
|
Bangladesh |
0 |
0 |
0 |
1 |
0 |
1 |
|
C. |
Grand Total (A+B) |
310 |
127 |
437 |
165 |
82 |
247 |
| |
|
|
|
|
|
|
|
|
|
Source: Union Budgets, Government of India. |
EXTERNAL DEBT
I.6.43 India’s external debt stock increased by US $ 11.6 billion (10.4 per cent during 2004-05) to US $ 123.3 billion at end-March 2005. All components of external debt, except bilateral aid and rupee debt, recorded an increase (Table 1.77). Commercial borrowings increased sharply during the year as access of the corporates to international capital markets improved during the year. Short-term debt, particularly trade credits, also surged on account of financing requirements of the higher import growth. The US dollar continues to dominate the currency composition of India’s external debt stock.
I.6.44 Indicators of external debt sustainability further strengthened during the year. The ratio of external debt to GDP showed a steady improvement, dropping to 17.4 per cent at end-March 2005 from 30.8 per cent at end-March 1995 (Table 1.78). The foreign currency assets of the Reserve Bank provided a cover of around 110 per cent of total external debt outstanding on March 31, 2005. India was the eighth largest debtor country in 2003; however, among the top 20 debtor countries, India had the lowest debt-GDP ratio, next only to China. The ratio of the short-term debt to total external debt was also among the lowest for India and was placed at 6.1 per cent at end-March 2005 as against an average of 15.7 per cent for the developing countries as a group.
Table 1.77: India's External Debt
| |
|
|
| |
|
|
(US $ million) |
| |
|
|
|
|
|
Item |
End-March |
End-March |
Variation during |
| |
2005 |
2004 |
2004-05 |
| |
|
|
|
|
| |
|
|
Absolute |
Per cent |
| |
|
|
|
|
|
1 |
2 |
3 |
4 |
5 |
| |
|
|
|
|
|
1. Multilateral |
31,763 |
29,288 |
2,475 |
8.5 |
|
2. Bilateral |
17,222 |
17,278 |
-56 |
-0.3 |
|
3. Trade Credit |
4,960 |
4,680 |
280 |
6.0 |
|
4. External Commercial 26,942 |
22,101 |
4,841 |
21.9 |
|
Borrowings |
|
|
|
|
|
5. NRI Deposits |
32,599 |
31,216 |
1383 |
4.4 |
|
6. Rupee Debt |
2,300 |
2,721 |
-421 |
-15.5 |
|
7. Short Term |
7,524 |
4,431 |
3,093 |
69.8 |
|
8. Total |
1,23,310 |
1,11,715 |
11,595 |
10.4 |
FOREIGN EXCHANGE RESERVES
I.6.45 India’s foreign exchange reserves comprising foreign currency assets, gold, SDRs and the reserve position with the IMF increased by as much as US $ 28.6 billion during 2004-05 and stood at US $ 141.5
Table 1.78: External Debt Service Payments
| |
|
| |
|
(US $ million) |
| |
|
|
|
|
Item |
2004-05 |
2003-04 |
| |
|
|
|
|
1 |
|
2 |
3 |
| |
|
|
|
|
1. |
External Assistance@ |
2,723 |
6,895 |
|
2. |
External Commercial Borrowings* |
5,238 |
10,389 |
|
3. |
IMF # |
0 |
0 |
|
4. |
NRI Deposits (Interest Payments) |
1,353 |
1,492 |
|
5. |
Rupee Debt Service |
417 |
376 |
|
6. |
Total Debt Servicing |
9,731 |
19,152 |
|
7. |
Total Current Receipts ** |
1,57,710 |
1,17,142 |
|
8. |
External Debt to GDP Ratio (%) |
17.4 |
17.8 |
|
9. |
Short Term Debt to Total Debt Ratio (%) |
6.1 |
4.0 |
|
10. Short Term Debt to Foreign Exchange |
|
|
| |
Reserves Ratio (%) |
5.3 |
3.9 |
|
11. Foreign Exchange Reserves to |
|
|
| |
External Debt Ratio (%) |
114.8 |
101.1 |
|
12. Debt Service Ratio (6/7) (%) |
6.2 |
16.3 |
|
13. Interest Payments to |
|
|
| |
Current Receipts Ratio (%) |
2.3 |
3.9 |
|
14. Debt to Current Receipts Ratio (%) |
78.2 |
95.4 |
|
15. Liability Service Ratio (%) |
7.1 |
17.1 |
|
@: Inclusive of non-Government loans.
*: Inclusive of interest component of trade credits.
#: Excluding charges on net cumulative allocation.
**: Excluding official transfers.
Note: 1. Debt Service payments in this table follow accrual method
of accounting consistent with balance of payments
compilation and may, therefore, vary from those recorded
on cash basis.
2. Liability service ratio represents debt service payments and
remittances of profits and dividends taken together as a
ratio of total current receipts. |
billion as on March 31, 2005 (Table 1.79). India turned a creditor to the IMF under the Financial Transactions Plan (FTP) in 2003. During 2004-05, US $ 93.5 million (SDR 61 million) was made available under the FTP to countries like Uruguay, Haiti, Dominican Republic and Sri Lanka.
I.6.46 At end-March 2005, India held the fourth largest stock of international reserve assets among EMEs. In terms of trade-related reserve adequacy indicators, India’s foreign exchange reserves at 14.3 months of imports are higher than other EMEs in Asia. India’s ratio of reserves to short-term debt comfortably satisfies the adequacy criterion vis-àvis comparator countries. In terms of overall external debt and total external liabilities, India’s reserves are broadly adequate. In view of the steady improvement in the external sector and growth prospects, Standard & Poor’s Rating Services raised its long-
Table 1.79: Foreign Exchange Reserves
| |
|
|
|
| |
|
|
|
|
(US $ million) |
| |
|
|
|
|
|
|
|
As at end of |
Gold |
SDR |
Foreign Currency |
Reserve Position |
Total |
Use of IMF |
|
March |
|
|
Assets |
in the IMF |
(2+3+4+5) |
Credit |
| |
|
|
|
|
|
|
|
1 |
2 |
3 |
4 |
5 |
6 |
7 |
|
1993 |
3,380 |
18 |
6,434 |
296 |
10,128 |
4,799 |
|
1994 |
4,078 |
108 |
15,068 |
299 |
19,553 |
5,040 |
|
1995 |
4,370 |
7 |
20,809 |
331 |
25,517 |
4,300 |
|
1996 |
4,561 |
82 |
17,044 |
310 |
21,997 |
2,374 |
|
1997 |
4,054 |
2 |
22,367 |
291 |
26,714 |
1,313 |
|
1998 |
3,391 |
1 |
25,975 |
283 |
29,650 |
664 |
|
1999 |
2,960 |
8 |
29,522 |
663 |
33,153 |
287 |
|
2000 |
2,974 |
4 |
35,058 |
658 |
38,694 |
26 |
|
2001 |
2,725 |
2 |
39,554 |
616 |
42,897 |
0 |
|
2002 |
3,047 |
10 |
51,049 |
610 |
54,716 |
0 |
|
2003 |
3,534 |
4 |
71,890 |
672 |
76,100 |
0 |
|
2004 |
4,198 |
2 |
1,07,448 |
1,311 |
1,12,959 |
0 |
|
2005 |
4,500 |
5 |
1,35,571 |
1,438 |
1,41,514 |
0 |
term foreign currency rating on India by one notch to ‘BB+’ (still one notch below the investment grade) and affirmed its ‘BB+’ long-term local currency and short-term ratings on February 2, 2005.
I.6.47 The objectives of reserve management in India are preservation of the long-term value of the reserves in terms of purchasing power and the need to minimise risk and volatility in returns. Foreign assets are held in major convertible currencies. Investments comprise deposits with other central banks, the Bank for International Settlements (BIS), top-rated foreign commercial banks, securities representing debt of sovereigns and supranational institutions with residual maturity not exceeding 10 years and any other instruments or institutions as approved by the Central Board of the Reserve Bank. Accordingly, the foreign currency assets are invested in multi-currency and multi-market portfolios (Table 1.80).
Table 1.80: Deployment Pattern of Foreign Currency Assets
| |
|
|
(US $ million) |
| |
|
|
|
|
Item |
As on March |
As on March |
| |
|
31, 2005 |
31, 2004 |
| |
|
|
|
|
1 |
|
2 |
3 |
| |
|
|
|
|
Foreign Currency Assets |
1,35,571 |
1,07,448 |
|
(a) |
Securities |
36,819 |
35,024 |
|
(b) |
Deposits with other Central |
|
|
| |
Banks and BIS |
65,127 |
45,877 |
|
(c) |
Deposits with Foreign |
|
|
| |
Commercial banks |
33,625 |
26,547 |
I.6.48 Decisions involving the patter n of investments are driven by the broad parameters of portfolio management with a strong bias for capital preservation and liquidity. The counterparties with whom deals are conducted are subject to a rigorous selection process, taking into account their international reputation and track record, apart from factors such as size, capital, rating, financial position and efficiency of operations. Counter-parties could be banks, subsidiaries of banks or security houses.
I.6.49 The Reserve Bank has two broad portfolios with independent risk parameters, viz., the money market portfolio and the bonds portfolio. The money market portfolio, predominantly guided by transaction and intervention needs, comprises instruments with maturity of less than one year and lower duration and runs a lower market risk in relation to interest rate movements. In contrast, the bonds portfolio consists of long-term holdings of AAA-rated instruments issued by sovereigns and supranationals.
INTERNATIONAL INVESTMENT POSITION
I.6.50 India’s net international investment position, i.e., the stock of external assets net of the stock of external liabilities, improved significantly (Table 1.81). Net external liabilities declined to US $ 48.6 billion by end-March 2004 from US $ 60.6 billion at end-March 2003. International assets grew much faster than international liabilities, attributable to the marked rise in reserve assets. The ratio of India’s
Table 1.81: Cross-Country IIP: Select Indicators (end-December 2003)
| |
|
|
| |
|
|
|
|
|
(Per cent) |
| |
As a ratio of GDP |
Reserve Assets as a ratio of |
As a ratio of Total International Liabilities |
| |
|
|
Total International Assets |
|
|
|
|
Country |
Foreign Assets |
Foreign Liabilities |
|
Direct |
Portfolio |
Other |
| |
|
|
|
Investment |
Investment |
Investment |
| |
|
|
|
|
|
|
|
1 |
2 |
3 |
4 |
5 |
6 |
7 |
|
India |
21.4 |
29.1 |
83.1 |
21.0 |
23.8 |
55.3 |
|
Hong Kong |
756.9 |
505.2 |
10.0 |
48.2 |
15.8 |
33.5 |
|
Indonesia |
26.9 |
78.0 |
64.8 |
6.4 |
14.3 |
79.3 |
|
Japan |
83.8 |
46.3 |
18.7 |
4.5 |
43.7 |
51.5 |
|
Korea |
42.4 |
56.6 |
60.5 |
19.3 |
49.1 |
31.4 |
|
Philippines |
40.3 |
92.8 |
52.8 |
16.6 |
28.2 |
55.2 |
|
Singapore |
492.7 |
409.5 |
21.3 |
45.6 |
16.1 |
38.3 |
|
Thailand |
44.6 |
82.9 |
66.1 |
40.1 |
24.6 |
34.7 |
|
US |
71.5 |
95.6 |
2.3 |
23.2 |
49.5 |
27.4 |
|
Note : Data for India relate to end-March 2004. |
reserve assets to total international assets compares favourably with many EMEs (Table 1.82). Reflecting
Table 1.82: International Investment Position of India
| |
|
|
|
(US $ million) |
| |
|
|
|
|
|
|
Item |
|
|
End-March |
|
| |
|
|
|
|
|
| |
|
|
2004 P |
2003 PR |
1997 PR |
| |
|
|
|
|
|
| |
|
1 |
2 |
3 |
4 |
|
A. |
Assets |
|
|
|
| |
1. |
Direct Investment Abroad |
6,592 |
5,054 |
617 |
| |
2. |
Portfolio Investment |
731 |
709 |
282 |
| |
|
2.1 Equity securities |
396 |
374 |
172 |
| |
|
2.2 Debt securities |
335 |
335 |
110 |
| |
3. |
Other Investments |
15,697 |
12,878 |
10,097 |
| |
|
3.1 Trade credits |
1,251 |
1,097 |
973 |
| |
|
3.2 Loans |
1,758 |
1,412 |
548 |
| |
|
3.3 Currency and deposits |
9,548 |
7,517 |
5,287 |
| |
|
3.4 Other assets |
3,139 |
2,853 |
3,288 |
| |
4. |
Reserve Assets |
112,959 |
76,100 |
26,714 |
|
Total Foreign Assets |
135,979 |
94,741 |
37,710 |
| |
of which: Banks |
11,442 |
9,158 |
7,271 |
|
B. Liabilities |
|
|
|
| |
1. |
Direct Investment in India |
38,676 |
30,827 |
10,630 |
| |
2. |
Portfolio Investment |
43,856 |
32,410 |
18,744 |
| |
|
2.1 Equity securities |
33,954 |
20,089 |
13,631 |
| |
|
2.2 Debt securities |
9,902 |
12,321 |
5,113 |
| |
3. |
Other Investments |
102,044 |
92,146 |
89,388 |
| |
|
3.1 Trade credits |
6,497 |
4,761 |
5,698 |
| |
|
3.2 Loans |
62,622 |
61,103 |
67,743 |
| |
|
3.3 Currency and deposits |
32,136 |
25,569 |
15,300 |
| |
|
3.4 Other liabilities |
789 |
714 |
646 |
|
Total Foreign Liabilities |
184,576 |
155,383 |
118,762 |
|
of which: Banks |
39,109 |
36,864 |
18,383 |
|
C. |
Net Foreign Liabilities (B-A) |
48,597 |
60,642 |
81,052 |
| |
of which: Banks |
27,667 |
27,706 |
11,112 |
|
D. |
Net Foreign Liabilities |
|
|
|
| |
to GDP (per cent) |
7.7 |
11.7 |
21.0 |
|
P: Provisional. PR: Partially Revised. |
these positive developments, the ratio of net foreign liabilities to GDP for India recorded a steady improvement from 21.0 per cent at end-March 1997 to 7.7 per cent at end-March 2004.
I.6.51 Non-debt liabilities, comprising primarily direct and portfolio investment (equity component), have risen sharply in terms of their share in total international liabilities (Table 1.83).
I.6.52 Growth in net international liabilities of the Indian banking sector decelerated to 15.1 per cent in 2004-05 from 19.8 per cent in 2003-04 (Table 1.84). Country-wise, the US accounted for nearly one-fourth of total international liabilities and assets of Indian banks. While the assets denominated in foreign currency formed 98.1 per cent of total international assets, the proportion of foreign currency denominated liabilities in total international liabilities was lower at 57.9 per cent at end-March 2005.
Table 1.83: Composition of India's International Liabilities
| |
|
(Per cent) |
| |
|
|
|
Year (end-March) |
Debt Liabilities |
Non-debt Liabilities |
| |
|
|
|
1 |
2 |
3 |
| |
|
|
|
1997 |
79.0 |
21.0 |
|
1998 |
76.7 |
23.3 |
|
1999 |
77.1 |
23.0 |
|
2000 |
74.5 |
25.6 |
|
2001 |
72.5 |
27.5 |
|
2002 |
69.2 |
30.8 |
|
2003 |
67.2 |
32.8 |
|
2004 |
60.7 |
39.3 |
Table 1.84: International Liabilities and Assets of Banks in India
| |
|
|
| |
|
|
|
|
|
(US $ million) |
| |
|
|
|
|
|
|
|
Category/Item |
|
|
|
Amount outstanding at end of |
| |
|
|
|
|
|
|
| |
|
|
March 2005* |
March 2004 |
March 2003 |
|
1 |
|
|
|
2 |
3 |
4 |
| |
|
|
|
|
|
|
|
Total International Liabilities |
|
|
|
58,161 |
50,871 |
42,209 |
|
of which: |
|
|
|
|
|
|
|
FCNR(B) Deposits |
|
|
|
11,654 |
10,460 |
9,261 |
|
NRE Rupee Deposits |
|
|
|
19,494 |
17,501 |
11,184 |
|
Foreign Currency Borrowings |
|
|
|
10,368 |
7,743 |
3,876 |
|
Bonds (including RIBs and IMDs) |
|
|
|
6,128 |
6,389 |
9,281 |
|
NR(NR) Rupee Deposits |
|
|
|
192 |
1,690 |
3,201 |
|
ADRs and GDRs |
|
|
|
2,819 |
1,474 |
807 |
|
EEFC Accounts |
|
|
|
1,296 |
1,045 |
1,028 |
| |
|
|
|
|
|
|
|
Total International Assets |
|
|
|
30,306 |
26,680 |
22,015 |
|
of which: |
|
|
|
|
|
|
|
Foreign Currency Loans to Residents |
|
|
|
13,337 |
10,159 |
7,760 |
|
Outstanding Export Bills |
|
|
|
5,834 |
4,750 |
4,051 |
|
NOSTRO Balances |
|
|
|
8,016 |
9,053 |
7,728 |
| |
|
|
|
|
|
|
|
* : Provisional. |
|
|
|
|
|
|
|
RIBs : Resurgent India Bonds. IMDs:India Millennium Deposits. ADRs : American Depository Receipts.
GDRs : Global Depository Receipts. EEFC:Exchange Earners' Foreign Currency.
Note: All figures are inclusive of accrued interest. |
I.6.53 To conclude, there was a sharp turnaround in the current account balance during the year - from a surplus of 1.7 per cent of GDP in 2003-04 to a deficit of 0.9 per cent in 2004-05 - mainly due to a substantial increase in imports, even as export growth and invisibles surplus remained robust. As capital flows were considerably in excess of the current account deficit, the overall balance of payments remained comfortable and the foreign exchange reserves (excluding valuation effects) increased by a substantial US $ 26.2 billion during 2004-05. |