|
VI PUBLIC DEBT MANAGEMENT
VI.1 Public debt management by the Reserve Bank in 2004-05 was guided by the twin objectives of minimisation of cost over time and lengthening of the maturity profile of debt for both the Centre and the States in a scenario of upward shifting yield curves. The market borrowing programme of the Central and State Governments was successfully completed in easy liquidity conditions. The weighted average cost of market borrowings of the Centre as well as the States increased marginally after eight years of consecutive decline, reflecting the hardening of interest rates attributable to uncertainty surrounding international oil prices, the upturn in global interest rates, buoyant domestic growth and sharp spikes in domestic inflation. The weighted average maturity of the primary issuances of Centre and States under the market borrowing programme during the year declined marginally. The Central Government did not avail of overdraft during 2004-05. The utilisation of WMA by State Governments was also lower as compared with the previous year. Issuances of Floating Rate Bonds (FRBs) continued as part of the endeavour to provide a diversified pool of instruments to investors and in a scenario of firming yields, they facilitated the hedging of interest rate risk. The proposed re-introduction of the Capital Indexed Bonds (CIBs) in 2005-06 would help to widen the investor base and provide the holders with an inflation risk free return on their investment.
VI.2 This section reviews the Reserve Bank’s debt management operations in response to the complexities in market processes, technological requirements for efficient functioning and the ongoing changes in the macroeconomic environment. The review highlights the distinct improvement in the Central Government’s fiscal position, reflected in the build-up of surplus cash balances with the Reserve Bank on an enduring basis despite a sharp decline in gross and net borrowings. The overview of States’ debt management indicates the emergence of financial discipline, reflecting the impact of institutional measures undertaken in the recent past.
CENTRAL GOVERNMENT
Ways and Means Advances
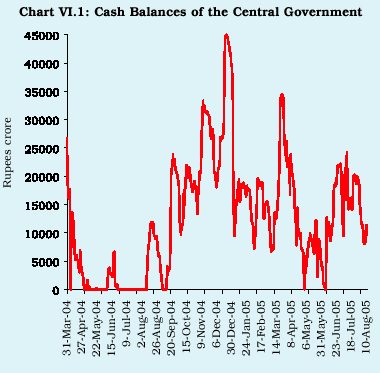
VI.3 The Ways and Means Advances (WMA) limits of the Central Government remained unchanged at Rs.10,000 crore for the first half (April-September) of 2004-05 and Rs.6,000 crore for the second half (October-March). The interest rate on WMA continued to be at the Bank Rate and on overdraft at two percentage points above the Bank Rate. A noteworthy development was that the Central Government did not resort to overdraft in 2004-05 for the first time since the operationalisation of WMA Scheme in April 1997 (Table 6.1).
Table 6.1: Overdraft Position of Central Government
| |
|
|
|
| |
|
|
|
|
|
|
|
Month |
|
2004-05 |
|
|
2003-04 |
|
| |
|
|
|
|
|
|
| |
Range of Overdraft |
No. of |
No. of |
Range of Overdraft |
No. of |
No. of |
| |
(Rupees crore) |
Days |
Occasions |
(Rupees crore) |
Days |
Occasions |
| |
|
|
|
|
|
|
|
1 |
2 |
3 |
4 |
5 |
6 |
7 |
| |
|
|
|
|
|
|
|
April |
– |
– |
– |
1,642-9,656 |
15 |
2 |
|
May |
– |
– |
– |
900-5,867 |
9 |
3 |
|
June |
– |
– |
– |
875-8,349 |
5 |
1 |
|
July |
– |
– |
– |
383-5,288 |
14 |
4 |
|
August |
– |
– |
– |
– |
– |
– |
|
September |
– |
– |
– |
– |
– |
– |
|
October |
– |
– |
– |
– |
– |
– |
|
November |
– |
– |
– |
– |
– |
– |
|
December |
– |
– |
– |
– |
– |
– |
|
January |
– |
– |
– |
– |
– |
– |
|
February |
– |
– |
– |
– |
– |
– |
|
March |
– |
– |
– |
– |
– |
– |
|
Total |
– |
– |
– |
0-9,656 |
43 |
10 |
VI.4 The Centre maintained surplus cash balances in its current
account with the Reserve Bank during most part of the year, mainly due to substantial
inflows on account of prepayment of high cost debt by the States under the debt
swap scheme (DSS) and other receipts. Investment of the Central Government’s
surplus cash balances in dated securities was discontinued temporarily from
April 8, 2004 in order to shore up the existing stock of securities for the
conduct of monetary policy. With the introduction of the Market Stabilisation
Scheme (MSS) to absorb liquidity, investment of surplus balances was partially
restored for investments up to Rs.10,000 crore from June 12, 2004. This limit
was increased to Rs.20,000 crore, effective October 14, 2004. As at end-March
2005, the Central Government’s surplus cash balances in the form of investment
balance (Rs.20,000 crore) and cash balance (Rs.6,202 crore) amounted to Rs.26,202
crore, almost the same as at end-March 2004 (Rs.26,669 crore) (Chart VI.1).
During the fiscal year, the Central Government took recourse to WMA on several
occasions till September 9, 2004 but maintained surpluses thereafter.
Treasury Bills
VI.5 The notified amounts of 91-day and 364-day Treasury Bills
(TBs) were increased from Rs.500 crore and Rs.1,000 crore to Rs.2,000 crore
each in 2004-05, the increase being entirely on account of issuances under the
MSS with a view to absorbing sur plus liquidity from the system. Scheduled issuances
of the MSS portion of 91-day and 364-day TBs during the period from November
10, 2004 to December 1, 2004 and that of 364-day TBs auction of December 22,
2004 were cancelled on account of temporary tightness in liquidity conditions.
The weighted average yields of 91-day and 364-day TBs increased by 26 basis
points and 48 basis points,
respectively, during 2004-05 (Table 6.2 and Appendix Table I.44).
VI.6 Reflecting movements in inflation rates, the primary market
yields of both 91-day and 364-day TBs increased by 108 and 135 basis points,
respectively, during the year to 5.32 per cent and 5.66 per cent (Chart VI.2).
VI.7 The average implicit yields for both 91-day and 364-day
TBs remained stable up to July 2004 but increased sharply to reach intra-year
peaks of 5.47 per cent and 5.71 per cent in November 2004. The yields, which
were hovering at sub-reverse repo rate levels during April-July 2004, thus rose
above the reverse repo rate during August 2004. With easing of headline inflation,
the implicit yield declined gradually thereafter. The yield spread between the
91-day and 364-day TBs widened from six basis points in April
Table 6.2: Treasury Bills - A Profile
| |
| |
|
|
|
|
|
|
(Rupees crore) |
| |
|
|
|
|
|
|
|
|
|
Type of |
Weighted Average |
Gross Amount |
Net Amount |
Outstanding |
|
Treasury Bill |
Cut-off Yield |
|
|
|
|
Amount |
| |
(per cent) |
|
|
|
|
|
|
| |
|
|
|
|
|
|
|
|
| |
2004-05 |
2003-04 |
2004-05* |
2003-04 |
2004-05* |
2003-04 |
2004-05* |
2003-04 |
| |
|
|
|
|
|
|
|
|
|
1 |
2 |
3 |
4 |
5 |
6 |
7 |
8 |
9 |
| |
|
|
|
|
|
|
|
|
|
91-day |
4.89 |
4.63 |
1,00,592 |
36,786 |
20,653 |
(-) 2,488 |
27,792 |
7,139 |
| |
|
|
(67,955) |
|
(19,500) |
|
(19,500) |
|
|
364-day |
5.15 |
4.67 |
47,132 |
26,136 |
20,997 |
9 |
47,132 |
26,136 |
| |
|
|
(20,981) |
|
(20,981) |
|
(20,981) |
|
| |
|
|
|
|
|
|
|
|
|
* Includes issuances under the MSS.
Note: Figures in parentheses pertain to issuances under the MSS.
|
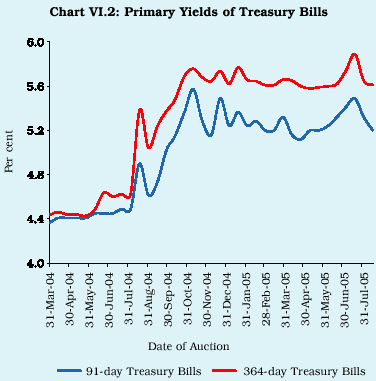
2004 to 39 basis points in March 2005. The bid-cover ratio
in the auctions was generally more than two during 2004-05, reflecting favourable
liquidity conditions and market appetite for shor t term securities (Table 6.3).
VI.8 It was decided in consultation with the Central Government
to re-introduce, effective April 6, 2005, fortnightly auctions of 182-day TBs
to be conducted on each Wednesday preceding a non-reporting Friday.
Table 6.3: Treasury Bills – Primary Market @
| |
| |
|
|
|
|
|
Month |
Average Implicit |
Bid-Cover Ratio* |
| |
Yield at Minimum |
|
|
| |
Cut-off Price (Per cent) |
|
|
| |
91-day |
364-day |
91-day |
364-day |
| |
|
|
|
|
|
1 |
2 |
3 |
4 |
5 |
| |
|
|
|
|
|
Apr-04 |
4.38 |
4.44 |
2.15 |
2.47 |
|
May-04 |
4.39 |
4.33 |
2.93 |
2.46 |
|
Jun-04 |
4.44 |
4.55 |
2.61 |
1.28 |
|
Jul-04 |
4.46 |
4.60 |
2.39 |
2.06 |
|
Aug-04 |
4.76 |
5.00 |
1.81 |
3.36 |
|
Sep-04 |
4.72 |
5.14 |
2.51 |
2.83 |
|
Oct-04 |
5.15 |
5.46 |
1.82 |
2.75 |
|
Nov-04 |
5.47 |
5.71 |
2.80 |
2.64 |
|
Dec-04 |
5.30 |
5.69 |
2.69 |
2.81 |
|
Jan-05 |
5.31 |
5.69 |
2.19 |
2.06 |
|
Feb-05 |
5.25 |
5.65 |
2.99 |
2.81 |
|
Mar-05 |
5.24 |
5.63 |
2.31 |
2.74 |
|
Apr-05 |
5.17 |
5.62 |
4.03 |
2.54 |
|
May-05 |
5.19 |
5.58 |
3.30 |
2.29 |
|
June-05 |
5.29 |
5.61 |
1.54 |
1.81 |
|
July-05 |
5.46 |
5.81 |
1.21 |
1.68 |
|
@: As per dates of auction.
* : Ratio of competitive Bids Received (BR) to Notified
Amount (NA). |
The notified amount of 182-day TBs was fixed at Rs.1,500 crore,
including Rs.1,000 crore under the MSS. The notified amounts of both 91-day
and 364-day TBs were kept unchanged at Rs.2,000 crore, including Rs.1,500 crore
and Rs.1,000 crore, respectively, under the MSS.
Dated Securities
VI.9 Comfortable liquidity conditions and lower than budgeted
market borrowings facilitated a smooth completion of the market borrowing programme
of the Central Government. The Central Government raised a gross amount (excluding
issuances under the MSS) of Rs.1,06,501 crore (a net amount of Rs.46,050 crore)
through the issuance of dated securities and 364-day TBs during the year, significantly
lower than Rs.1,47,636 crore (net Rs.88,816 crore) raised during the previous
year (excluding Rs.14,434 crore issued under the debt buy back scheme). This
was on account of a number of factors. First, the Central Government had privately
placed securities amounting to Rs.16,500 crore with the Reserve Bank to prepay
relatively high cost external debt during 2003-04; however, no prepayment was
effected in 2004-05. Second, the higher amount of market borrowings in 2003-04
resulted in a sharp increase in surplus cash balances to Rs.26,669 crore as
at end-March 2004 from Rs.8,905 crore as at end-March 2003; during 2004-05,
on the other hand, such cash balances exhibited a marginal decline. Third, investments
in 14-day Intermediate TBs emerged as a major source of financing in 2004-05
as compared with 2003-04. Finally, the DSS lowered the Centre’s market borrowing
requirement both in 2003-04 and in 2004-05. However, while the impact of the
DSS was offset by prepayment of external debt and build-up of surplus cash balances
during 2003-04, there was no such offsetting factor in 2004-05, resulting in
lower market borrowings.
VI.10 During 2004-05, the Central Government raised a total
amount of Rs.80,350 crore through dated securities; of this, Rs.80,000 crore
was raised through 19 auctions (comprising 13 reissues and six new issues) and
Rs.350 crore by way of private placement (new issue) (Appendix Tables I.41 and
I.43). The Centre had raised Rs.1,00,000 crore through 22 auctions (6 new issues
and 16 reissues) and Rs.21,500 crore through private placement in 2003-04. Two
issuances of Floating Rate Bonds (FRBs) devolved partially on the Reserve Bank
and Primary Dealers (PDs) amounting to Rs.847 crore and Rs.985 crore, respectively.
This was in contrast to the previous year, when there was no devolvement on
the Reserve Bank and PDs. During 2004-05, securities amounting to Rs.350 crore
were privately placed with the Reserve Bank as against Rs.21,500 crore (including
Rs.16,500 crore on account of prepayment of external debt) in the previous year.
The Reserve Bank continued to pursue the policy of elongation of the maturity
profile of Government debt while keeping in view investor response. Of the 20
primary issuances under the market borrowing programme during 2004-05, eight
securities issued were with residual maturity of more than 20 years. The seven
new issues included five issues of FRBs.
VI.11 According to the issuance calendar for the first half
(April-September) of 2004-05, dated securities for face value of Rs.59,000 crore
were to be issued through auctions. As against this, auctions of dated securities
amounting to Rs.54,000 crore were conducted; the auction of Rs.5,000 crore scheduled
in April 2004 was cancelled. On September 20, 2004, an indicative calendar for
issue of dated securities for the second half (October -March) of 2004-05 for
Rs.44,000 crore was issued; of this, Rs.26,000 crore were auctioned, while the
balance scheduled auctions for Rs.18,000 crore were cancelled. The weighted
average yield of the dated securities issued during 2004-05 worked out to 6.11
per cent as compared with 5.71 per cent during the previous year. The weighted
average maturity of the dated securities issued during 2004-05 worked out to
14.13 years as compared with 14.94 years during 2003-04 (Chart VI.3).
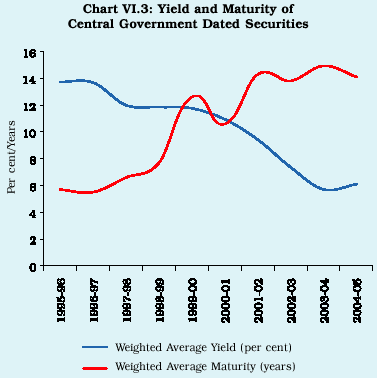
VI.12 The weighted average coupon on the outstanding stock
of government securities continued to decline during 2004-05. On the other hand,
the weighted average maturity of the outstanding securities, which had been
rising since 1999-2000, fell marginally to 9.63 years as on March 31, 2005 (Table
6.4).
VI.13 Securities over 10-year maturity constituted the largest
share in the outstanding stock of securities as well as in new issuances (Table
6.5). Out of the 121 outstanding marketable securities amounting to
Table 6.4: Central Government's Market Loans - A Profile*
| |
|
| |
|
|
|
|
|
(Yield in per cent/Maturity in years) |
| |
|
|
|
|
|
|
|
|
|
Year |
YTMs at Primary Issues (%) |
Weighted |
Range of |
Weighted |
Weighted |
Weighted |
| |
|
|
|
Average |
Maturities |
Average |
Average |
Average |
| |
Under 5 |
5-10 |
Over 10 |
Yield |
of |
Maturity |
Maturity of |
Yield of |
| |
years |
years |
years |
|
New Loans |
|
outstanding |
outstanding |
| |
|
|
|
|
|
|
stock |
stock |
| |
|
|
|
|
|
|
|
|
|
1 |
2 |
3 |
4 |
5 |
6 |
7 |
8 |
9 |
| |
|
|
|
|
|
|
|
|
|
1997-98 |
10.85-12.14 |
11.15-13.05 |
– |
12.01 |
3-10 |
6.60 |
6.50 |
.. |
|
1998-99 |
11.40-11.68 |
11.10-12.25 |
12.25-12.60 |
11.86 |
2-20 |
7.70 |
6.30 |
.. |
|
1999-00 |
– |
10.73-11.99 |
10.77-12.45 |
11.77 |
5-19 |
12.60 |
7.10 |
.. |
|
2000-01 |
9.47-10.95 |
9.88-11.69 |
10.47-11.70 |
10.95 |
2-20 |
10.60 |
7.50 |
.. |
|
2001-02 |
– |
6.98-9.81 |
7.18-11.00 |
9.44 |
5-25 |
14.30 |
8.20 |
10.84 |
|
2002-03 |
– |
6.65-8.14 |
6.84-8.62 |
7.34 |
7-30 |
13.80 |
8.90 |
10.44 |
|
2003-04 |
4.69 |
4.62-5.73 |
5.18-6.35 |
5.71 |
4-30 |
14.94 |
9.80 |
9.30 |
|
2004-05 |
5.90 |
5.53-7.20 |
4.49-8.24 |
6.11 |
5-30 |
14.13 |
9.63 |
8.79 |
|
2005-06 @ |
– |
6.80-7.06 |
6.91-7.98 |
7.28 |
5.29 |
13.76 |
9.57 |
8.75 |
| |
|
|
|
|
|
|
|
|
|
* : Excludes issuances under MSS. YTM: Yield to Maturity .. : Not available. –: No Issues.
@ : Up to August 12, 2005. |
Table 6.5: Maturity Profile of Central Government Securities
| |
|
|
|
|
|
(Per cent) |
| |
Outstanding Stock |
Issued during the Year |
| |
|
|
|
|
|
|
|
Year |
Under 5 |
5-10 |
Over 10 |
Under 5 |
5-10 |
Over 10 |
|
(End-March) |
Years |
Years |
Years |
Years |
Years |
Years |
| |
|
|
|
|
|
|
|
1 |
2 |
3 |
4 |
5 |
6 |
7 |
|
1997-98 |
41 |
41 |
18 |
18 |
82 |
0 |
|
1998-99 |
41 |
42 |
16 |
18 |
68 |
14 |
|
1999-00 |
37 |
39 |
24 |
0 |
35 |
65 |
|
2000-01 |
27 |
47 |
26 |
6 |
41 |
53 |
|
2001-02 |
31 |
36 |
33 |
2 |
24 |
74 |
|
2002-03 |
26 |
35 |
39 |
0 |
36 |
64 |
|
2003-04 |
24 |
32 |
44 |
5 |
15 |
80 |
|
2004-05 |
27 |
30 |
43 |
11 |
11 |
78 |
Rs.8,95,348 crore as at end-March 2005, 44 securities with minimum outstanding amount of Rs.10,000 crore or more accounted for 67 per cent of the total outstanding amount as compared with 63 per cent at end-March 2004. 29 securities with outstanding amount between Rs,5,000-Rs.10,000 crore accounted for 22 per cent of the total outstanding amount at end-March 2005.
VI.14 The stock of Central Government securities held by the Reserve Bank fell by Rs.7,071 crore during 2004-05 (Table 6.6).
VI.15 The repayment schedule of outstanding market loans of the Central Government as on March 31, 2005 indicates bunching of repayments between 2009-10 and 2015-16 (Table 6.7).
Table 6.6: Reserve Bank's Stock of Central Government Securities
| |
| |
|
|
| |
|
|
(Rupees crore) |
| |
|
|
|
|
Year |
Outstanding |
Special Securities |
Total |
|
(End-March) |
Dated |
Issued in |
Out- |
| |
Securities* |
Conversion of |
standing* |
| |
|
Ad-hoc |
|
| |
|
Treasury Bills |
|
| |
|
|
|
|
1 |
2 |
3 |
4 |
| |
|
|
|
|
1996-97 |
6,666 |
1,21,818 |
1,28,484 |
|
1997-98 |
31,977 |
1,01,818 |
1,33,795 |
|
1998-99 |
42,212 |
1,01,818 |
1,44,030 |
|
1999-00 |
35,190 |
1,01,818 |
1,37,008 |
|
2000-01 |
41,732 |
1,01,818 |
1,43,550 |
|
2001-02 |
40,927 |
1,01,818 |
1,42,745 |
|
2002-03 |
55,438 |
61,818 |
1,17,256 |
|
2003-04 |
77,397 |
0 |
77,397 |
|
2004-05 |
80,770 |
0 |
80,770 |
|
* Inclusive of securities sold under the LAF. |
Table 6.7: Repayment Schedule of Centre's Outstanding Market Loans
|
(As on March 31, 2005)
|
| |
|
|
Year
|
Rs. crore
|
| |
|
|
1
|
2
|
|
2005-06
|
55,631 *
|
|
2006-07
|
44,079 **
|
|
2007-08
|
45,876
|
|
2008-09
|
44,028
|
|
2009-10
|
52,589
|
|
2010-11
|
56,586
|
|
2011-12
|
55,581
|
|
2012-13
|
57,074
|
|
2013-14
|
59,009
|
|
2014-15
|
42,018
|
|
2015-16
|
65,244
|
|
2016-17
|
48,130
|
|
2017-18
|
50,774
|
|
2018-19
|
37,478
|
|
2019-20
|
28,000
|
|
2020-21
|
11,000
|
|
2021-22
|
13,213
|
|
2022-23
|
32,000
|
|
2023-24
|
21,000
|
|
2025-26
|
16,688
|
|
2026-27
|
15,000
|
|
2027-28
|
15,000
|
|
2028-29
|
11,000
|
|
2032-33
|
14,000
|
|
2034-35
|
4,350
|
|
Total
|
8,95,348
|
|
* : Including repayment of Rs.20,000
crore under the MSS.
** : Including repayment of Rs.5,000
crore under the MSS.
|
VI.16 The share of securities with coupon at 10 per cent and above continued to fall in keeping with the declining trend of the last five years (Table 6.8).
Table 6.8: Interest Rate Profile of Outstanding Central Government Securities
| |
| |
| |
(As on March 31, 2005) |
|
| |
|
|
|
Interest Rate |
Outstanding Amount |
Share in |
|
(Per cent) |
(Rupees crore) |
(Per cent) |
| |
|
|
|
1 |
2 |
3 |
| |
|
|
|
4.00-4.99 |
42,500 |
4.75 |
|
5.00-5.99 |
96,818 |
10.81 |
|
6.00-6.99 |
1,51,772 |
16.95 |
|
7.00-7.99 |
1,34,540 |
15.03 |
|
8.00-8.99 |
37,638 |
4.20 |
|
9.00.-9.99 |
56,424 |
6.30 |
|
10.00-10.99 |
83,537 |
9.33 |
|
11.00-11.99 |
1,65,646 |
18.50 |
|
12.00-12.99 |
94,249 |
10.53 |
|
13.00-14.00 |
32,222 |
3.60 |
|
Total |
8,95,348 |
100.0 |
VI.17 For 2005-06, the Union Budget has placed net market borrowings (excluding MSS) of the Central Government at Rs.1,10,295 crore (inclusive of net issuances of 182-day TBs). Including repayments of Rs.68,272 crore (Rs.35,631 crore of dated securities, Rs.26,141 crore of 364-day TBs and Rs.6,500 crore of 182-day TBs), the gross market borrowing is estimated at Rs.1,78,467 crore (Rs.1,39,467 crore through dated securities and Rs.26,000 crore through 364-day TBs and 13,000 crore through 182-day TBs). Thus, the budgeted gross borrowings are significantly higher than the actual amount raised in 2004-05. An indicative issuance calendar for issue of dated securities for the first half of the year 2005-06 was issued in consultation with the Government for an aggregate amount of Rs.83,000 crore (Table 6.9). As in the past, the Reser ve Bank will have flexibility to var y issuances of Government securities keeping in view the emerging requirements of the Government. During 2005-06 so far (up to August 19, 2005), gross market borrowing (excluding issuances under the MSS) raised by the Central Government through dated securities, 182-day and 364-day TBs amounted to Rs.89,796 crore (net Rs.54,514 crore) as compared with Rs.55,030 crore (net Rs.18,224 crore) during the corresponding period of the previous year. All issuances were by way of fixed coupon securities as against a share of 59 per cent during the corresponding period of the previous year, reflecting the favourable market appetite for such securities. There has been no devolvement/private placement during the year so far. To facilitate consolidation and impart liquidity to the Government securities market, all the securities were reissuances of securities issued earlier.
VI.18 Instrument diversification has been a key component of the Reserve Bank’s initiatives for the development of the Government securities market. As a part of this effort, a capital indexed bond (CIB) was issued for the first time on December 29, 1997. Subsequently, there was no further issuance of CIB mainly due to lack of response of market participants for the instrument. Taking into account the past exper ience as well as internationally popular structure of CIBs, a modified structure of CIB is proposed to be re-introduced (Box VI.1).
Table 6.9: Issuance Calendar and Actual Borrowings during 2005-06 (April 1, 2005 to September 30, 2005)
|
Borrowings as per Issuance Auction Calendar |
Actual Borrowings* |
|
| |
|
|
|
|
|
|
|
Period of auction |
Amount |
Maturity Period |
Date of Auction |
Amount |
Tenor of the |
| |
(Rupees crore) |
of the Security |
|
(Rupees |
crore) |
Security (Years) |
| |
|
|
|
|
|
|
|
1 |
2 |
3 |
4 |
|
5 |
6 |
| |
|
|
|
|
|
|
|
April 4-20, 2005 |
5,000 |
a) 10 to 14 year security |
April 5, 2005 |
|
5,000 |
6.98 |
| |
3,000 |
b) 20- year and above |
April 5, 2005 |
|
3,000 |
27.39 |
|
April 19 -10,2005 |
5,000 |
a) 10 to 14 year security |
April 19, 2005 |
|
5,000 |
11.74 |
| |
2,000 |
b) 20- year and above |
April 19, 2005 |
|
2,000 |
27.39 |
|
May 2-9, 2005 |
6,000 |
a) 5 to 9 year security |
May 3, 2005 |
|
6,000 |
5.03 |
| |
4,000 |
b) 20- year and above |
May 3, 2005 |
|
2,000 |
29.27 |
|
May 16-24, 2005 |
4,000 |
a) 15 to 19 year security |
May 24, 2005 |
|
4,000 |
16.05 |
|
June 1-8, 2005 |
6,000 |
a) 5-9 year security |
June 6, 2005 |
|
6,000 |
8.86 |
| |
4,000 |
b) 15-19 year and above |
June 6, 2005 |
|
4,000 |
15.98 |
|
June 16-24, 2005 |
8,000 |
a) 10-14 year security |
June 23, 2005 |
|
5,000 |
10.81 |
|
July 1-8, 2005 |
6,000 |
a) 5- 9 year security |
July 5, 2005 |
|
6,000 |
8.16 |
| |
4,000 |
b) 15-19 year security |
July 5, 2005 |
|
4,000 |
15.90 |
|
July 12-18, 2005 |
5,000 |
(a) 15-19 year security |
July 18, 2005 |
|
5,000 |
15.86 |
|
August 5-12, 2005 |
5,000 |
(a) 10-14 year security |
August 11, 2005 |
|
5,000 |
11.43 |
| |
3,000 |
(b) 20 year and above |
August 11, 2005 |
|
3,000 |
28.99 |
|
August 16--23, 2005 |
5,000 |
(a) 5-9 year security |
August 18, 2005 |
|
5,000 |
8.66 |
| |
3,000 |
(b) 20 year and above |
August 18, 2005 |
|
3,000 |
28.98 |
|
September 2-10, 2005 |
5,000 |
(a) 10-14 year security |
|
|
|
|
| |
3,000 |
(b) 20 year and above |
|
|
|
|
|
Total |
83,000 |
|
|
73,000 |
|
| |
|
|
|
|
|
|
|
* Up to August 18, 2005 |
Box VI.1
Capital Indexed Bonds
Capital Indexed Bonds (CIBs) minimise the inflation risk to the investors and issuers by adjusting both the principal and coupon payments to the changes in inflation. The CIBs are a preferred investment vehicle for investors sensitive to inflation risk. From the issuer’s perspective, the CIB helps in reducing cost of borrowing as it eliminates the ‘inflation risk’ premium.
Co-existence of CIBs and nominal bonds provides useful information on ‘inflationary expectations’ or ‘break even inflation rate’ to both the policy makers and the market participants. The ‘break-even inflation rate’ is defined as the rate of return that equates the real yield of a CIB with the rate of return of a nominal bond of the same tenor if both are held till maturity.
The two most important issues relating to the design of a CIB are: (i) the selection of an inflation index and (ii) the indexation process in the design to deal with indexation lag. Ideally, the CIBs should be linked to an inflation index which is a perfect measure of inflation for all sections of society and is available at high frequency without any lag. In reality, there are several measures of inflation applicable to particular sections of society, but none of them meet the ideal conditions. Indexation lag arises from (a) publication lag and (b) institutional lag. The publication lag arises on account of some delay with which the inflation data are published; the institutional lag, on the other hand, may arise due to arrangements for trading and settlement of bonds between coupon payment dates. For a bond offering semi-annual coupon payments, the indexation lag on account of institutional factor would be six months. As the length of indexation lag has direct relationship with real value certainty or level of inflation protection, it is always desirable to minimise indexation lag.
Internationally, there are two broad designs of indexed bonds - the UK model and the Canadian model. While the UK model takes aggregated length of indexation lag as it is, the Canadian model brings down the length of indexation lag by eliminating institutional lag. Under the Canadian design, the inflation indexed principal can be derived on a daily basis by linear interpolation between the inflation index number applicable for the first day of the month in which the settlement falls and the inflation index number applicable to the first day of month immediately following the settlement date. The uplifted principal over the base thus arrived is used to calculate accrued interest on the CIBs for any particular date with indexation lag limited to the publication lag. Considering the inherent superiority of the Canadian model, many Treasuries the world over have used it to design their inflation indexed securities. Prominent among them are the United States, France, Sweden, South Africa, and New Zealand.
References
1. Sack, B. and Robert Elsasser (2004), ';Treasury Inflation-Indexed Debt: A Review of the U.S Experience';, Federal Reserve Bank of New York Economic Policy Review, May: 47-63.
2. Wilcox, David W. (1998), ‘Policy Watch: The Introduction of Indexed Government Debt in the United States’, Journal of Economic Perspectives 12,No.1 (Winter): 219-27.
VI.19 The Internal Technical Group on Central Government Securities Market had recommended, inter alia, introduction of ‘When Issued Market’ and limited short selling in Government securities. These recommendations would be considered in consultation with the Central Government (Box VI.2).
Box VI.2
When Issued Market
';When, as and if issued'; [also known as ';when-issued'; (WI)] markets in Gover nment securities function somewhat like trading in a futures market in that positions may be taken and covered many times before the actual settlement date. Such trading takes place between the time a new issue is announced and the time it is actually issued. WI trading has certain advantages like facilitating the distribution process for Government securities by stretching the actual distribution period for each issue and allowing the market more time to absorb large issues without disruption. It helps price discovery by reducing uncertainties surrounding auctions by enabling bidders to gauge market demand and price the securities being offered.
International experience suggests that the estimated aggregate size of outstanding positions in the WI market typically exceeds the quantity of securities to be sold at that auction. Those positions can be taken more cheaply and potentially in greater size (due to the lack of a delivery requirement) during the WI trading than in subsequent trading. Participants normally reduce the size of outstanding positions in the WI market as the issue date approaches. There is, however, the risk of participants overestimating their ability to cover short positions prior to settlement.
II. STATE GOVERNMENTS
Ways and Means Advances
VI.20 During 2004-05, the average utilisation of special WMA, normal WMA and overdrafts by the State Governments was lower than the previous year (Chart VI.4). The improvement in the overall cash position of the States was also reflected in the spurt in investments in 14-day Intermediate Treasury Bills (Table 6.10).
VI.21 State Gover nments, excepting Kerala, Arunachal Pradesh, Mizoram, Nagaland, Tripura and Uttaranchal resorted to WMA for a fewer number of days as compared with 2003-04 (Table 6.11). The recourse to overdrafts by the State Governments also showed improvement over the previous year. As many as 13 States did not avail overdrafts in 2004-05.
VI.22 Effective April 1, 2005 the aggregate normal WMA of the State Governments, which is based on the recommendations of the Ramachandran Committee, was revised upwards by 9.8 per cent. The increase is due to the higher average revenue receipts of the States in the preceding three years. The WMA limit for non-special category States was revised upwards by 9.4 per cent for the year 2005-06. In the case of special category States, there was an increase of 13.5 per cent (Table 6.12). The Advisory Committee on Ways and Means Advances to the State Governments (Ramachandran Committee; January 2003) had recommended that the formula and the limits of WMA to State Governments may be reviewed in totality after receipt of the recommendations of the Twelfth Finance Commission (TFC). Accordingly, an Advisor y Committee on Ways and Means Advances to the State Governments was constituted in May 2005.
Table 6.10: WMA/Overdrafts and Investment of State Governments*
| |
|
|
|
| |
|
|
|
|
|
|
|
(Rupees crore) |
| |
|
|
|
|
|
|
|
|
|
Month |
Normal WMA |
Special WMA |
Overdraft |
Investment in 14-day |
| |
|
|
|
|
|
|
Intermediate |
| |
|
|
|
|
|
|
Treasury Bills |
| |
|
|
|
|
|
|
|
|
| |
2004-05 |
2003-04 |
2004-05 |
2003-04 |
2004-05 |
2003-04 |
2004-05 |
2003-04 |
| |
|
|
|
|
|
|
|
|
|
1 |
2 |
3 |
4 |
5 |
6 |
7 |
8 |
9 |
| |
|
|
|
|
|
|
|
|
|
April |
1,118 |
989 |
1,908 |
2,145 |
1,075 |
1,088 |
5,585 |
3,894 |
|
May |
1,044 |
941 |
2,177 |
1,816 |
560 |
445 |
5,917 |
4,987 |
|
June |
1,049 |
937 |
1,724 |
1,179 |
506 |
204 |
7,959 |
6,232 |
|
July |
863 |
1,138 |
1,196 |
2,160 |
425 |
612 |
7,693 |
4,095 |
|
August |
890 |
968 |
1,472 |
2,183 |
247 |
658 |
8,348 |
5,193 |
|
September |
856 |
959 |
1,258 |
1,681 |
14 |
532 |
9,887 |
5,190 |
|
October |
951 |
1,150 |
2,556 |
2,464 |
547 |
946 |
9,606 |
3,690 |
|
November |
933 |
1,246 |
2,545 |
3,829 |
465 |
1,053 |
12,011 |
3,497 |
|
December |
601 |
1,216 |
827 |
4,513 |
152 |
1,185 |
14,722 |
2,820 |
|
January |
695 |
1,055 |
1,530 |
3,417 |
216 |
1,203 |
12,632 |
3,716 |
|
February |
438 |
1,023 |
1,110 |
3,274 |
107 |
698 |
15,039 |
4,208 |
|
March |
115 |
811 |
631 |
2,068 |
188 |
703 |
17,337 |
4,234 |
|
Average |
796 |
1,036 |
1,578 |
2,379 |
375 |
777 |
10,561 |
4,313 |
| |
|
|
|
|
|
|
|
|
|
* : Average of Friday outstandings. |
Table 6.11 State-wise Availment of WMA/Overdraft
| |
|
|
|
|
|
| |
|
|
|
|
|
|
|
(Rupees crore) |
|
State |
|
WMA |
|
|
Overdraft |
|
|
| |
|
2004-05 |
2003-04 |
|
2004-05 |
|
2003-04 |
| |
|
Number of |
Number of |
Number of |
Number of |
Number of |
Number of |
| |
|
days |
days |
Occasions |
days |
Occasions |
days |
| |
|
|
|
|
|
|
|
|
|
1 |
|
2 |
3 |
4 |
|
5 |
6 |
7 |
| |
|
|
|
|
|
|
|
|
|
Non-Special Category States |
|
|
|
|
|
|
|
|
1. |
Andhra Pradesh |
0 |
173 |
0 |
|
0 |
6 |
30 |
|
2. |
Bihar |
5 |
92 |
0 |
|
0 |
0 |
0 |
|
3. |
Goa |
212 |
270 |
3 |
|
13 |
9 |
66 |
|
4. |
Gujarat |
116 |
203 |
0 |
|
0 |
13 |
47 |
|
5. |
Haryana |
0 |
24 |
0 |
|
0 |
4 |
21 |
|
6. |
Karnataka |
7 |
196 |
0 |
|
0 |
1 |
1 |
|
7. |
Kerala |
348 |
328 |
19 |
161 |
28 |
196 |
|
8. |
Madhya Pradesh |
110 |
261 |
0 |
|
0 |
22 |
176 |
|
9. |
Maharashtra |
68 |
207 |
5 |
|
22 |
17 |
154 |
|
10. |
Orissa |
91 |
315 |
0 |
|
0 |
21 |
189 |
|
11. |
Punjab |
268 |
291 |
9 |
115 |
11 |
53 |
|
12. |
Rajasthan |
21 |
303 |
0 |
|
0 |
21 |
151 |
|
13. |
Tamil Nadu |
7 |
38 |
0 |
|
0 |
13 |
73 |
|
14. |
Uttar Pradesh |
294 |
321 |
13 |
|
98 |
14 |
79 |
|
15. |
West Bengal |
268 |
362 |
15 |
115 |
28 |
260 |
|
16. |
Chhattisgarh |
0 |
0 |
0 |
|
0 |
0 |
0 |
|
17. |
Jharkhand |
0 |
31 |
0 |
|
0 |
0 |
0 |
|
Special Category States |
|
|
|
|
|
|
|
|
1. |
Arunachal Pradesh |
35 |
0 |
3 |
|
6 |
0 |
0 |
|
2. |
Assam |
225 |
337 |
13 |
126 |
24 |
315 |
|
3. |
Himachal Pradesh |
159 |
327 |
4 |
|
27 |
27 |
181 |
|
4. |
Manipur |
149 |
268 |
2 |
118 |
19 |
350 |
|
5. |
Meghalaya |
0 |
31 |
0 |
|
0 |
1 |
1 |
|
6. |
Mizoram |
147 |
131 |
1 |
|
1 |
4 |
24 |
|
7. |
Nagaland |
103 |
12 |
3 |
|
18 |
19 |
143 |
|
8. |
Tripura |
31 |
25 |
0 |
|
0 |
0 |
0 |
|
9. |
Uttaranchal |
95 |
78 |
2 |
|
16 |
9 |
41 |
Market Borrowings
VI.23 The net market borrowings allocated to the States for 2004-05 amounted to Rs.36,935 crore, including additional allocation of Rs.18,805 crore under the DSS. Taking into account repayments of Rs.5,123 crore, the gross allocation amounted to Rs.42,058 crore in 2004-05. As against this, gross market borrowings during 2004-05 by the State Governments were lower at Rs.39,101 crore. An amount of Rs.16,943 crore was raised under the DSS during 2004-05. The gross borrowing also included an additional amount of Rs.1,387 crore for prepayment of loans from the NABARD under the RIDF Scheme (Table 6.13).
VI.24 Of the total borrowings by States during 2004-05, 98 per cent was through sale of securities on a tap basis (Table 6.14).
VI.25 Borrowings raised by way of auctions aggregated Rs.885 crore accounting for two per cent of total borrowings (Table 6.15).
VI.26 The weighted average yield of State Government securities increased during 2004-05 while the weighted average maturity declined to 10.01 years in 2004-05 from 11.01 years in 2003-04. While the cut-off yield in the auctions ranged between 7.10-7.25 per cent, the coupon of the tap issuances ranged between 5.60 and 7.36 per cent
Table 6.12: Normal WMA Limits of States
| |
|
|
|
|
|
|
|
|
|
|
|
|
(Rupees crore) |
| |
|
|
|
|
|
|
|
|
State |
|
WMA Limits |
WMA Limits |
WMA Limits |
WMA Limits |
WMA Limits |
WMA Limits |
| |
|
1999 (effective |
2001 (effective |
2002 (effective |
2003 (effective |
2004 (effective |
2005 (effective |
| |
|
March 1, 1999)$ |
February 1, 2001) |
April 1, 2002) |
March 3, 2003)* |
April 1, 2004) |
April 1, 2005) |
| |
|
|
|
|
|
|
|
|
1 |
|
2 |
3 |
4 |
5 |
6 |
7 |
| |
|
|
|
|
|
|
|
|
Non-Special Category States |
|
|
|
|
|
|
1. |
Andhra Pradesh |
288 |
463 |
520 |
620 |
700 |
770 |
|
2. |
Bihar |
195 |
220 |
245 |
305 |
340 |
380 |
|
3. |
Chhattisgarh |
82 |
91 |
100 |
130 |
155 |
175 |
|
4. |
Goa |
24 |
25 |
50 |
50 |
65 |
65 |
|
5. |
Gujarat |
243 |
393 |
445 |
485 |
520 |
575 |
|
6. |
Jharkhand |
51 |
57 |
75 |
105 |
175 |
225 |
|
7. |
Haryana |
99 |
167 |
180 |
205 |
245 |
280 |
|
8. |
Karnataka |
228 |
331 |
375 |
460 |
505 |
570 |
|
9. |
Kerala |
144 |
215 |
225 |
270 |
315 |
345 |
|
10. |
Madhya Pradesh |
221 |
244 |
275 |
345 |
395 |
420 |
|
11. |
Maharashtra |
483 |
685 |
760 |
905 |
1,000 |
1,050 |
|
12. |
Orissa |
141 |
159 |
185 |
215 |
250 |
270 |
|
13. |
Punjab |
141 |
200 |
235 |
240 |
325 |
360 |
|
14. |
Rajasthan |
202 |
288 |
310 |
365 |
405 |
440 |
|
15. |
Tamil Nadu |
281 |
402 |
415 |
570 |
615 |
670 |
|
16. |
Uttar Pradesh |
531 |
559 |
630 |
755 |
835 |
920 |
|
17. |
West Bengal |
235 |
295 |
360 |
420 |
480 |
495 |
| |
Sub Total |
3,589 |
4,794 |
5,385 |
6,445 |
7,325 |
8,010 |
| |
|
|
|
|
|
|
|
|
Special Category States |
|
|
|
|
|
|
|
1. |
Arunachal Pradesh |
28 |
35 |
50 |
50 |
50 |
50 |
|
2. |
Assam |
114 |
161 |
180 |
210 |
250 |
295 |
|
3. |
Himachal Pradesh |
59 |
92 |
115 |
135 |
140 |
145 |
|
4. |
Manipur |
25 |
38 |
50 |
50 |
50 |
55 |
|
5. |
Meghalaya |
25 |
30 |
50 |
50 |
50 |
55 |
|
6. |
Mizoram |
25 |
28 |
50 |
50 |
50 |
50 |
|
7. |
Nagaland |
26 |
40 |
50 |
55 |
60 |
65 |
|
8. |
Tripura |
31 |
46 |
55 |
60 |
70 |
80 |
|
9. |
Uttaranchal |
19 |
19 |
50 |
65 |
95 |
130 |
| |
Sub Total |
352 |
489 |
650 |
725 |
815 |
925 |
| |
Total |
3,941 |
5,283 |
6,035 |
7,170 |
8,140 |
8,935 |
|
$:Report of the Informal Advisory Committee on WMA to State Governments, November 1998 (Chairman: Shri B. P. R. Vithal).
* :Advisory Committee on WMA to State Governments, January 2003 (Chairman: Shri C. Ramachandran). |
(Table 6.16). The investor response to market borrowings by some States was rather lukewarm in 2004-05, reflecting both demand and supply side factors. The response to tap issues held in the year 2004-05 was not encouraging (the tap issues closed with shortfalls except on two occasions), though there was surfeit of liquidity in the system. The spread in the cut-off yields in the auctions also widened. In this context, the need for improving the secondary market liquidity in State Government securities has received increasing attention.
VI.27 At end-March 2005, 60 per cent of the total outstanding debt of State Governments was in the maturity bucket of 6-10 years as compared with 54 per cent as at end-March 2004 (Table 6.17).
VI.28 The maturity profile of outstanding State Government Securities and Power Bonds issued by
Table 6.13: Market Borrowings of State Governments in 2004-05
| |
|
|
|
|
| |
|
|
|
|
|
(Rupees crore) |
| |
|
|
|
|
|
|
|
|
State |
Gross |
Repayment |
Net |
Gross |
Gross |
Gross |
| |
|
Allocation |
|
Allocation |
Amount |
Amount |
Borrowings |
| |
|
|
|
(=2 - 3) |
Raised |
Raised |
(=5 + 6) |
| |
|
|
|
|
by Auction |
by Tap |
|
| |
|
|
|
|
|
|
|
|
1 |
|
2 |
3 |
4 |
5 |
6 |
7 |
| |
|
|
|
|
|
|
|
|
1. |
Andhra Pradesh |
3,312 |
438 |
2,874 |
– |
3,312 |
3,312 |
|
2. |
Arunachal Pradesh |
22 |
5 |
17 |
– |
22 |
22 |
|
3. |
Assam |
794 |
162 |
633 |
– |
794 |
794 |
|
4. |
Bihar |
1,890 |
330 |
1,560 |
– |
1,890 |
1,890 |
|
5. |
Chhattisgarh |
523 |
93 |
430 |
– |
392 |
392 |
|
6. |
Goa |
133 |
15 |
118 |
– |
133 |
133 |
|
7. |
Gujarat |
2,020 |
209 |
1,811 |
– |
2,020 |
2,020 |
|
8. |
Haryana |
1,039 |
109 |
930 |
– |
1,039 |
1,039 |
|
9. |
Himachal Pradesh |
886 |
34 |
851 |
– |
886 |
886 |
|
10. |
Jammu & Kashmir |
474 |
58 |
416 |
– |
474 |
474 |
|
11. |
Jharkhand |
560 |
112 |
448 |
– |
560 |
560 |
|
12. |
Karnataka |
2,299 |
182 |
2,117 |
– |
2,299 |
2,299 |
|
13. |
Kerala |
1,672 |
296 |
1,376 |
356 |
1,316 |
1,672 |
|
14. |
Madhya Pradesh |
1,730 |
256 |
1,474 |
– |
1,730 |
1,730 |
|
15. |
Maharashtra |
4,275 |
386 |
3,889 |
– |
4,275 |
4,275 |
|
16. |
Manipur |
83 |
14 |
69 |
– |
83 |
83 |
|
17. |
Meghalaya |
142 |
18 |
125 |
– |
142 |
142 |
|
18. |
Mizoram |
89 |
10 |
79 |
– |
89 |
89 |
|
19. |
Nagaland |
164 |
25 |
139 |
– |
164 |
164 |
|
20. |
Orissa |
1,199 |
299 |
900 |
– |
1,199 |
1,199 |
|
21. |
Punjab |
1,830 |
171 |
1,659 |
– |
1,831 |
1,831 |
|
22. |
Rajasthan |
2,391 |
314 |
2,077 |
– |
2,391 |
2,391 |
|
23. |
Sikkim |
48 |
12 |
36 |
– |
48 |
48 |
|
24. |
Tamil Nadu |
2,599 |
350 |
2,249 |
270 |
2,329 |
2,599 |
|
25. |
Tripura |
251 |
18 |
233 |
– |
251 |
251 |
|
26. |
Uttar Pradesh |
6,887 |
748 |
6,139 |
– |
4,060 |
4,060 |
|
27. |
Uttaranchal |
309 |
40 |
269 |
– |
309 |
309 |
|
28. |
West Bengal |
4,439 |
421 |
4,017 |
259 |
4,180 |
4,439 |
| |
Total |
42,058 |
5,123 |
36,935 |
885 |
38,217 |
39,101 |
State Governments suggests that the repayment burden for State Governments would be very high during the period 2012-13 to 2014-15, reflecting high amount of borrowings during 2002-03 to 2004-05 under the DSS (Table 6.18).
VI.29 The interest rate profile of the outstanding stock of the State Government securities shows that 63 per cent of borrowings was contracted at interest rates ranging from 5.00 per cent to 9.99 per cent. The share of total outstanding stock with interest rate above 10 per cent declined to 37 per cent from 47 per cent in the previous year (Table 6.19).
Working Group to Frame the Model Fiscal Responsibility Legislation at State Level
VI.30 In the twelfth Conference of State Finance Secretaries held on August 1, 2003, it was decided that the Reserve Bank would provide technical assistance in the preparation of a model fiscal responsibility legislation for the State Governments.
Table 6.14: Market Borrowings Raised through Tap Issuance
| |
|
|
|
|
| |
|
|
|
|
|
|
|
(Rupees crore) |
| |
|
|
|
|
|
|
|
|
|
|
State |
|
|
|
Tap Issue |
|
|
|
|
| |
|
|
|
|
|
|
|
|
|
| |
|
Apr. 11, |
May. 26-27, |
Jul. 28-29, |
Nov.2-3, |
Dec. 7-8, |
Jan.10-11, |
Feb .22-23, |
Mar. 14-15, |
| |
|
2004, |
2004, |
2004, |
2004, |
2004, |
2005, |
2005 |
2005 |
| |
|
5.60%# |
5.70%# |
6.35%* |
7.36%# |
7.32% * |
7.02%# |
7.17** |
7.20** |
| |
|
|
|
|
|
|
|
|
|
|
1 |
|
2 |
3 |
4 |
5 |
6 |
7 |
8 |
9 |
|
1. |
Andhra Pradesh |
732 |
591 |
532 |
735 |
321 |
354 |
47 |
0 |
|
2. |
Arunachal Pradesh |
9 |
0 |
0 |
9 |
5 |
0 |
0 |
0 |
|
3. |
Assam |
220 |
110 |
50 |
137 |
174 |
69 |
34 |
0 |
|
4. |
Bihar |
359 |
265 |
152 |
266 |
309 |
213 |
327 |
0 |
|
5. |
Chhattisgarh |
154 |
107 |
0 |
0 |
132 |
0 |
0 |
0 |
|
6. |
Goa |
67 |
0 |
0 |
39 |
26 |
0 |
0 |
0 |
|
7. |
Gujarat |
319 |
740 |
509 |
283 |
169 |
0 |
0 |
0 |
|
8. |
Haryana |
205 |
271 |
212 |
166 |
99 |
86 |
0 |
0 |
|
9. |
Himachal Pradesh |
208 |
174 |
155 |
158 |
85 |
90 |
16 |
0 |
|
10. |
Jammu & Kashmir |
54 |
107 |
65 |
42 |
36 |
45 |
125 |
0 |
|
11. |
Jharkhand |
125 |
130 |
98 |
75 |
117 |
16 |
0 |
0 |
|
12. |
Karnataka |
550 |
435 |
392 |
365 |
296 |
261 |
0 |
0 |
|
13. |
Kerala |
330 |
396 |
221 |
0 |
0 |
42 |
327 |
0 |
|
14. |
Madhya Pradesh |
350 |
247 |
401 |
342 |
290 |
100 |
0 |
0 |
|
15. |
Maharashtra |
611 |
1,145 |
701 |
427 |
348 |
137 |
520 |
386 |
|
16. |
Manipur |
34 |
0 |
0 |
44 |
0 |
2 |
3 |
0 |
|
17. |
Meghalaya |
41 |
0 |
0 |
47 |
0 |
3 |
52 |
0 |
|
18. |
Mizoram |
16 |
0 |
0 |
17 |
10 |
0 |
0 |
47 |
|
19. |
Nagaland |
62 |
0 |
43 |
34 |
21 |
2 |
2 |
0 |
|
20. |
Orissa |
313 |
175 |
133 |
169 |
218 |
0 |
191 |
0 |
|
21. |
Punjab |
211 |
512 |
596 |
0 |
0 |
293 |
219 |
0 |
|
22. |
Rajasthan |
513 |
495 |
393 |
505 |
217 |
268 |
0 |
0 |
|
23. |
Sikkim |
6 |
0 |
0 |
11 |
6 |
0 |
25 |
0 |
|
24. |
Tamil Nadu |
581 |
723 |
443 |
450 |
0 |
133 |
0 |
0 |
|
25. |
Tripura |
42 |
0 |
0 |
40 |
22 |
2 |
146 |
0 |
|
26. |
Uttar Pradesh |
775 |
735 |
514 |
367 |
1,144 |
492 |
32 |
0 |
|
27. |
Uttaranchal |
209 |
0 |
0 |
67 |
33 |
0 |
0 |
0 |
|
28. |
West Bengal |
406 |
1,113 |
681 |
289 |
183 |
542 |
966 |
0 |
| |
Total |
7,500 |
8,471 |
9,288 |
5,084 |
4,261 |
3,148 |
3,031 |
433 |
| |
|
|
|
|
|
|
|
|
|
|
*: Tenor : 9 years. **: Tenor :12 years. #: Tenor : 10 years. |
Accordingly, a Group was constituted in October 2003 with select Finance Secretaries of State Gover nments and a representative of the Government of India, Ministr y of Finance, as members. The Report of the Group was submitted on Januar y 22, 2005. As decided in the 14th
Table 6.15: Market Borrowings Raised in Auctions
| |
|
|
|
|
|
| |
|
|
|
|
|
|
(Amount in Rs. Crore/rate in per cent) |
| |
|
|
|
|
|
|
|
|
|
|
|
Sr. |
State |
Date of |
Notified |
Market |
No. of |
Amount |
Amount |
Weighted |
Cut-off |
Spread |
|
No. |
|
Auction |
Amount |
Rate* |
Bids |
Offered |
Raised |
Average |
Rate (%) |
(Col. 5 - |
| |
|
|
|
|
Received |
|
|
Yield (%) |
|
Col. 10) |
| |
|
|
|
|
|
|
|
|
|
|
| |
|
|
|
|
|
|
|
|
|
|
|
1 |
2 |
3 |
4 |
5 |
6 |
7 |
8 |
9 |
10 |
11 |
|
1 |
Kerala |
24.08.04 |
356 |
6.32 |
24 |
485.35 |
355.66 |
7.16 |
7.25 |
0.93 |
|
2 |
Tamil Nadu |
24.08.04 |
450 |
6.32 |
38 |
757.85 |
270.00 |
7.05 |
7.10 |
0.78 |
|
3 |
West Bengal |
24.08.04 |
380 |
6.32 |
31 |
599.0 |
259.00 |
7.08 |
7.15 |
0.83 |
|
* : Yield on Central Government 10-year dated security. |
Table 6.16: Weighted Average Yield of State Government Securities
| |
| |
| |
(per cent per annum) |
|
Year |
Range |
Weighted Average |
|
1 |
2 |
3 |
|
1995-96 |
14.00 |
14.00 |
|
1996-97 |
13.75-13.85 |
13.83 |
|
1997-98 |
12.30-13.05 |
12.82 |
|
1998-99 |
12.15-12.50 |
12.35 |
|
1999-00 |
11.00-12.25 |
11.89 |
|
2000-01 |
10.50-12.00 |
10.99 |
|
2001-02 |
7.80-10.53 |
9.20 |
|
2002-03 |
6.60-8.00 |
7.49 |
|
2003-04 |
5.78-6.40 |
6.13 |
|
2004-05 |
5.60-7.36 |
6.44 |
|
2005-06 (up to Aug. 12, 05) |
7.32-7.77 |
7.66 |
Conference of State Finance Secretaries held on August 13, 2004 the Report of the Group has been placed on the Reserve Bank’s website.
Table 6.17: Maturity Profile of Outstanding State Government Securities (At end-March 2005)
| |
Percentage to total amount outstanding |
Total |
| |
|
|
|
|
Amount |
|
State |
0-5 |
6-10 |
Above 10 |
|
| |
|
|
|
|
Outstanding |
| |
|
years |
years |
years |
|
| |
|
|
|
|
(Rs. crore) |
| |
|
|
|
|
|
|
1 |
|
2 |
3 |
4 |
5 |
| |
|
|
|
|
|
|
1. |
Andhra Pradesh |
29.7 |
64.9 |
5.4 |
19,964 |
|
2. |
Arunachal Pradesh |
15.0 |
48.1 |
36.9 |
279 |
|
3. |
Assam |
30.7 |
59.1 |
10.3 |
5,129 |
|
4. |
Bihar |
32.2 |
55.4 |
12.3 |
11,803 |
|
5. |
Chhattisgarh |
– |
72.1 |
27.9 |
1,744 |
|
6. |
Goa |
27.1 |
59.2 |
13.6 |
961 |
|
7. |
Gujarat |
22.4 |
65.3 |
12.3 |
12,657 |
|
8. |
Himachal Pradesh |
15.2 |
72.8 |
12.0 |
3,690 |
|
9. |
Harayana |
26.3 |
62.1 |
11.6 |
4,755 |
|
10. |
Jammu & Kashmir |
21.4 |
66.5 |
12.1 |
2,693 |
|
11. |
Jharkhand |
– |
86.9 |
13.1 |
1,971 |
|
12. |
Karnataka |
23.8 |
62.8 |
13.4 |
11,762 |
|
13. |
Kerala |
33.0 |
56.1 |
11.0 |
9597 |
|
14. |
Maharashtra |
21.3 |
57.8 |
20.9 |
17,544 |
|
15. |
Madhya Pradesh |
32.3 |
54.4 |
13.3 |
10,341 |
|
16. |
Manipur |
27.8 |
47.3 |
24.9 |
598 |
|
17. |
Meghalya |
33.3 |
46.7 |
20.0 |
825 |
|
18. |
Mizoram |
24.9 |
51.7 |
23.3 |
501 |
|
19. |
Nagaland |
32.5 |
54.9 |
12.6 |
1,237 |
|
20. |
Orissa |
34.0 |
50.0 |
16.1 |
9,581 |
|
21. |
Punjab |
23.4 |
62.0 |
14.6 |
7,718 |
|
22. |
Rajasthan |
29.0 |
60.7 |
10.3 |
14,358 |
|
23. |
Sikkim |
50.0 |
28.9 |
21.1 |
332 |
|
24. |
Tripura |
26.8 |
44.1 |
29.1 |
1,025 |
|
25. |
Tamil Nadu |
26.8 |
64.3 |
8.9 |
13,786 |
|
26. |
Uttaranchal |
– |
78.6 |
21.4 |
2,812 |
|
27. |
Uttar Pradesh |
34.9 |
52.7 |
12.4 |
27,051 |
|
28. |
West Bengal |
21.5 |
58.7 |
19.8 |
18,728 |
| |
Total |
27.0 |
59.6 |
13.4 |
2,13,443 |
Table 6.18: Maturity Profile of Outstanding State Government Securities and Power Bonds (At end-March 2005)
| |
|
|
|
(Rupees crore) |
|
Year |
State Loans |
Power |
Bonds |
Total |
| |
|
|
|
Outstanding |
| |
|
|
|
|
|
1 |
2 |
|
3 |
4 |
|
2005-06 |
6,274 |
|
0 |
6,274 |
|
2006-07 |
6,551 |
|
1,494 |
8,045 |
|
2007-08 |
11,555 |
|
2,989 |
14,544 |
|
2008-09 |
14,400 |
|
2,989 |
17,389 |
|
2009-10 |
16,511 |
|
2,989 |
19,500 |
|
2010-11 |
15,870 |
|
2,989 |
18,859 |
|
2011-12 |
22,032 |
|
2,989 |
25,021 |
|
2012-13 |
30,628 |
|
2,989 |
33,617 |
|
2013-14 |
32,078 |
|
2,989 |
35,067 |
|
2014-15 |
33,385 |
|
2,989 |
36,373 |
|
2015-16 |
13,462 |
|
2,989 |
16,451 |
|
2016-17 |
10,697 |
|
1,494 |
12,191 |
|
Total |
2,13,443 |
|
29,886 |
2,43,329 |
Conference of State Finance Secretaries
VI.31 During 2004-05, the 14th and 15th conferences were held on August 13, 2004 and January 24, 2005 respectively. In the 14th Conference, issues relating to market and other borrowings of State Governments, policy for identifying durable surplus for investment, improving secondar y market liquidity of State Government Securities and draft Report of the Working Group on the Model Fiscal Responsibility Legislation at State Level were discussed. It was also decided in the Conference to form two Working Groups with representatives from select State Governments for (i) improving secondary market liquidity of State Development Loans and (ii) devising a methodology of compilation of data on various types of debt liabilities of the States.
Table 6.19: Interest Rate Profile of Outstanding State Government Securities (At end-March 2005)
|
Range of Interest Rate |
Outstanding Amount |
Percentage to |
|
(per cent) |
(Rupees crore) |
Total |
| |
|
|
|
|
1 |
|
2 |
3 |
|
1. |
5.00-5.99 |
34,612 |
16.22 |
|
2. |
6.00-6.99 |
58,563 |
27.44 |
|
3. |
7.00-7.99 |
27,872 |
13.06 |
|
4. |
8.00-8.99 |
8,004 |
3.75 |
|
5. |
9.00-9.99 |
5,412 |
2.54 |
|
6. |
10.00-10.99 |
14,563 |
6.82 |
|
7. |
11.00-11.99 |
17,062 |
7.99 |
|
8. |
12.00-12.99 |
25,362 |
11.88 |
|
9. |
13.00-13.99 |
15,720 |
7.37 |
|
10. 14.00 |
6,274 |
2.94 |
| |
Total |
2,13,443 |
100 |
VI.32 In the 15th Conference held on January 24, 2005 the deliberations focused on issues such as market borrowings of State Gover nments, presentation on the Working Group on State Government Liabilities and review of the working of the State Finance Secretaries’ Conferences. An interface with the Indian Banks’ Association was also organised to deliberate upon the issues relating to default and restructuring/unilateral alteration in the financial terms of SLR State Government guaranteed bonds issued by State Government entities.
VI.33 The 16th Conference of State Finance Secretaries was organised on April 8, 2005 to deliberate exclusively on the recommendations of the Twelfth Finance Commission (TFC) and operational issues emanating therefrom. Dr. C. Rangarajan, Chairman, TFC and Chairman, Economic Advisory Council to the Prime Minister, delivered the inaugural address.
Technical Advisory Committee
VI.34 During 2004-05, three meetings of the Technical Advisory Committee (TAC) on Money, Foreign Exchange and Government Securities Markets were held. In the meeting held on May 31, 2004 issues such as liquidity aspects of State Government securities, eligibility of corporates in the repo market, permission to banks to trade in exchange traded derivatives and operational issues of Delivery versus Payment (DvP) III were discussed. In the meeting held on September 17, 2004, the future course of action on OTC derivatives, permission to banks to trade in exchange traded derivatives and issues for further development in the commercial paper market were discussed. It was also decided to constitute two Sub-Groups. The Group under the chairmanship of Shri D. N. Ghosh was set up to recommend the steps to be taken in order to allow banks to trade in Interest Rate Futures (IRFs) and to harmonise regulatory norms between Over the Counter (OTC)/exchange traded derivatives and also between rupee denominated/cross currency derivatives involving rupee in one leg. A Working Group on Liquidity of State Government Securities was set up to examine the modalities of improving the secondary market liquidity of State Development Loans. In the 21st meeting of the TAC held on January 18, 2005 recommendations of the Sub-Group on Primar y Dealers System in India - Issues and Prospects were discussed. A review of benchmark in regard to prudential limits in call/ notice money market and of the system of liquidity support to gilt mutual funds was also undertaken. In the 22nd meeting of the TAC held on April 12, 2005 draft reports of the Technical Groups on Money Market, Central Government Securities Market, and Forex Markets were discussed. These reports have been placed on the Bank’s website.
Outlook
VI.35 The market borrowing programme of the Central Government during 2005-06 is budgeted to be much higher than in the previous year. Furthermore, the interest rate cycle is turning up internationally. The Reserve Bank expects to conduct debt management within the monetary projections set out in the Annual Policy Statement for 2005-06 consistent with the objectives of minimisation of cost and rollover risk. The reintroduction of capital indexed bonds is expected to widen the choice for investors while lowering the cost of borrowings to the Government in the long run. The initiatives by the Reser ve Bank towards fur ther deepening and widening the Government securities market with innovative instruments and new participants would pave the way for healthy and smooth conduct of debt management and borrowing requirements. The steps taken towards improving the liquidity of State Government loans are expected to ease hurdles encountered by State Governments in their access to the market. State Governments’ efforts towards ensuring sustainability of debt position will be an abiding concern of the Reserve Bank in the conduct of public debt management operations in 2005-06.
|