by Pallavi Pant, Monalisa Poali, Abhyuday Harsh, Brijesh P and Sona Chinngaihlian^ Globally, non-banking financial institutions (NBFIs) have expanded significantly in scale and operational complexity, becoming increasingly interwoven with other components of the financial ecosystem. Similarly, in India, non-banking financial companies (NBFCs) play an important role in credit intermediation. The NBFC sector continues to demonstrate resilience, marked by robust profitability, and a consistent improvement in asset quality. Text mining analysis of annual reports of select NBFCs reveals an emphasis on orientation towards Artificial Intelligence (AI), particularly in customer and financial applications, governance and digital infrastructure, and data analytics. Introduction NBFCs act as vital financial intermediaries in India, by providing credit to the generally underserved sectors. Registered under the RBI Act, 19341, they are regulated by the Reserve Bank and supplement the traditional banking system by supporting financial inclusion and economic growth. NBFCs including housing finance companies (HFCs) accounted for 12.7 per cent of India's total financial sector assets at end-March 2025, serving as the second-largest segment, after scheduled commercial banks. Over the years, NBFCs have strengthened their balance sheets primarily through improvement in asset quality. The credit growth of NBFCs is mainly driven by loans to retail sector and industry, with a high reliance on banks for funding, which has increased their interconnectedness with the banking system, prompting ongoing monitoring to manage the systemic risks, if any. They are also at the forefront of the digital transformation of the lending space, leveraging technology to offer tailor-made credit offerings to customers. This article presents the performance of India’s NBFC sector at end-December 2025. Section II situates India’s non-banking sector in the global context. Section III provides an overview of the Indian financial system while section IV examines NBFCs’ balance sheet indicators. Section V details the rising orientation towards artificial intelligence and digital technologies by NBFCs. The last section summarises and concludes. II. NBFIs: A Global Perspective Globally, the NBFI2 sector is the largest segment, accounting for around 51 per cent of total financial assets at end-December 2024. The sector is heterogenous and diverse with wide range of activities (Table 1). As per the latest report3 of the Financial Stability Board (FSB), the global NBFI sector expanded by 9.4 per cent (y-o-y) at end-December 2024, which is nearly twice the pace of the banking sector growth. Even though NBFI assets size fell substantially during the global financial crisis, they have grown steadily thereafter. | Table 1: Financial System Structure in Select Countries (End-December 2024) | | Countries | Banks | Central Banks | Public Financial Institutions | NBFIs | NBFIs | | Insurance Corporations | Pension Funds | Financial Auxiliaries | OFIs | | Per cent of total financial assets of domestic entities | | France | 61.7 | 6.6 | 0.0 | 31.6 | 13.2 | 1.3 | 3.2 | 13.9 | | UK | 49.1 | 2.9 | 0.0 | 48.1 | 8.2 | 8.9 | 1.0 | 30.0 | | Japan | 45.9 | 14.7 | 6.4 | 33.0 | 9.8 | 3.4 | 0.4 | 19.4 | | US | 22.6 | 4.0 | 8.6 | 64.8 | 9.4 | 19.2 | 0.0 | 36.2 | | Advanced Economies (AEs) | 32.4 | 5.6 | 4.1 | 58.0 | 8.4 | 10.9 | 0.9 | 37.8 | | China | 62.3 | 7.1 | 5.7 | 25.0 | 5.8 | 0.4 | 0.0 | 18.8 | | India | 48.4 | 12.4 | 3.2 | 36.1 | 11.8 | 2.1 | 0.0 | 22.2 | | Brazil | 39.0 | 11.1 | 2.3 | 47.6 | 0.7 | 7.0 | 1.8 | 38.1 | | South Africa | 29.3 | 4.5 | 16.3 | 50.0 | 17.4 | 12.4 | 0.0 | 20.2 | | Emerging Market Economies (EMEs) | 58.6 | 8.4 | 5.5 | 27.5 | 5.9 | 1.6 | 0.2 | 19.8 | | All | 38.1 | 6.2 | 4.4 | 51.3 | 7.8 | 8.9 | 0.7 | 33.9 | Notes: 1. ‘OFIs’ refer to other financial intermediaries.
2. ‘All’ pertains to 29 individual jurisdictions (18 AEs and 11 EMEs) for which more granular information for non-bank financial sectors is available.
Source: Financial Stability Board (FSB). | NBFIs are dominant players in advanced economies (AEs), particularly in the United States, where these entities comprise 64.8 per cent of the total assets of the financial system. Their dominance in AEs stems from the heavy reliance of the corporate sector on NBFIs to mobilise funds through capital markets, investment funds and institutional wealth. In EMEs, the share of NBFIs in the total assets of the financial system has been lower than AEs. However, their growing role in EMEs is discernible from the rising share of NBFI assets as per cent of GDP (Chart 1). Credit Dynamics4 Banks’ share in total credit to the private non-financial sector has steadily declined while that of non-banks’ has risen in AEs, indicating a structural shift towards non-bank sources in credit intermediation. In contrast, the credit flow in EMEs remains predominantly bank-led (Chart 2). III. Indian Financial System Even though the NBFI sector lags banking sector in terms of asset size, it is steadily gaining traction. Between end-March 2020 and end-March 2025, the share of NBFIs gradually increased from 41.8 per cent to 47.7 per cent, highlighting their expanding role in the Indian financial system (Table 2). NBFCs (including HFCs), the predominant segment within NBFIs, along with AIFIs focus primarily on credit intermediation5. Other NBFIs like Mutual Funds, Insurance, Pension, InvITs, and REITs etc., offer financial products related to equity and corporate bond markets, among others. The share of NBFCs in total assets declined post-2023 reflecting the merger of one large HFC with a bank. The share of asset reconstruction companies has increased during the last five years, driven by stressed asset resolution. Within NBFIs, mutual funds institutions have gained share, reflecting the shift in household/ institutional savings towards market-linked instruments driven by better returns. The share of pension funds under National Pension Scheme has grown steadily, underscoring the imperatives for social safety net. Assets managed by EPFO have also risen gradually. The share of insurance sector in total financial assets has been on a downward trend, signifying faster growth in other NBFI segments. 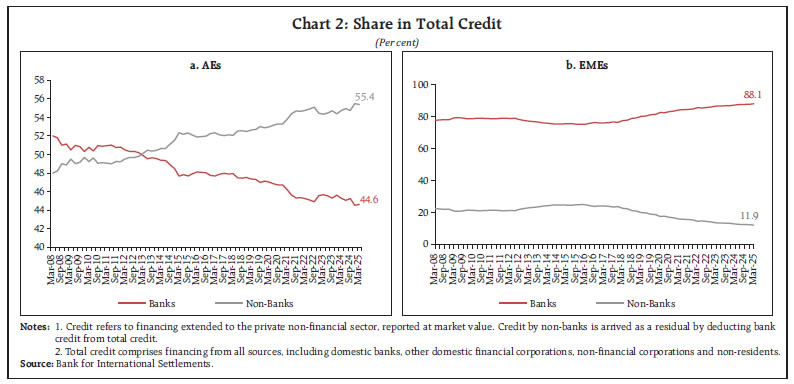
| Table 2: Structure of Indian Financial System (End-March) | | Items | Share
(As per cent of Total Assets) | | 2020 | 2021 | 2022 | 2023 | 2024 | 2025 | | 1. Banks (1.1 to 1.3) | 58.2 | 55.6 | 54.7 | 53.8 | 53.4 | 52.3 | | 1.1. SCBs | 51.2 | 48.9 | 48.3 | 47.8 | 47.8 | 47.0 | | 1.2. Co-operative banks | 5.4 | 5.0 | 4.8 | 4.5 | 4.2 | 3.9 | | 1.3. Others | 1.7 | 1.6 | 1.6 | 1.5 | 1.4 | 1.4 | | 2. NBFIs (2.1 to 2.9) | 41.8 | 44.4 | 45.3 | 46.2 | 46.6 | 47.7 | | 2.1. NBFCs (including HFCs) | 13.9 | 14.0 | 13.8 | 14.5 | 13.1 | 12.7 | | 2.2. AIFIs | 2.7 | 2.7 | 2.8 | 2.9 | 3.1 | 3.0 | | 2.3. Asset Reconstruction Companies (ARCs) | 1.2 | 1.4 | 1.4 | 1.6 | 1.7 | 2.4 | | 2.4. Insurance companies | 12.1 | 12.3 | 12.1 | 11.8 | 11.5 | 11.2 | | 2.5. Pension under NPS | 1.2 | 1.4 | 1.6 | 1.8 | 2.0 | 2.2 | | 2.6. EPFO (EPF and EPS) | 4.0 | 3.9 | 4.2 | 4.2 | 4.2 | 4.3 | | 2.7. Mutual funds (including ETFs) | 6.3 | 7.9 | 8.4 | 7.7 | 9.1 | 9.9 | | 2.8. Alternative Investment Funds | 0.4 | 0.5 | 0.6 | 0.7 | 0.7 | 0.8 | | 2.9. Real Estate Investment Trusts (REITs) and Infrastructure Investment Trust (InvITs) | 0.0 | 0.4 | 0.5 | 0.9 | 1.3 | 1.3 | | Total (1+2) | 100.0 | 100.0 | 100.0 | 100.0 | 100.0 | 100.0 | Notes: 1. SCBs include public sector banks, private sector banks, foreign banks, small finance banks, and payments banks.
2. Co-operative banks include urban co-operative banks and rural credit co-operatives. Asset size of rural credit co-operatives is extrapolated for end-March 2025, based on trend. Others include regional rural banks and local area banks.
3. NBFIs can be broadly categorised as lending institutions (NBFCs including HFCs and AIFIs), companies involved in asset resolution, insurance and investment vehicles (pension & mutual funds, REITs, InvITs and alternative investment funds).
4. NBFCs include all NBFCs regulated by RBI, including HFCs.
5. AIFIs refer to five All India Financial Institutions namely, NABARD, EXIM Bank, SIDBI, NHB and NaBFID.
6. Pension under NPS is under National Pension System and Atal Pension Yojana.
7. For lending institutions (banks, NBFCs and AIFIs), balance sheet size has been taken as size of total assets. For ARCs, it is the book value of assets acquired.
8. For 2.4 to 2.9, assets under management have been taken as the size of total assets.
9. Financial system includes banks and non-banks, excluding the central bank. Due to this, share of NBFIs might not match with the data in table 1, which includes the central bank.
Sources: RBI; SEBI; AMFI; IRDAI; Ministry of Labour & Employment; PFRDA; and authors' calculations. | Alternate Investment Funds are privately pooled investment vehicles which collect funds from sophisticated investors for investing, e.g., venture capital funds, small and medium-sized enterprises (SMEs) funds, social venture funds and infrastructure funds. As per cent of total assets of the financial system, they constitute less than one per cent at end-March 2025. REITs/ InvITs are investment vehicles that offer regular income to investors. These have become new sources of finance for the real estate and infrastructure segments. Their share has shown a moderate increase in recent years. IV. Performance of the NBFC Sector6 IV.1 Balance Sheet The NBFC sector in terms of total assets/ liabilities continued to register double-digit growth (y-o-y) at end-December 2025. On the liabilities side, both NBFC-UL and ML experienced an acceleration in total borrowings. On the assets side, this growth was driven by rapid expansion in loans and advances (Table 3). | Table 3: Abridged Balance Sheet of NBFCs (End-December) | | (₹ crore) | | Items | 2024 | 2025 | | 1 | 2 | 3 | 4 | 5 | 6 | 7 | | Particulars | NBFC-ML | NBFC-UL | NBFC | NBFC-ML | NBFC-UL | NBFC | | Share Capital | 1,33,569 | 2,955 | 1,36,524 | 1,39,131 | 5,505 | 1,44,636 | | | (2.2) | (-35.1) | (0.9) | (4.2) | (86.3) | (5.9) | | Reserves and Surplus | 8,87,609 | 2,58,191 | 11,45,800 | 9,38,994 | 3,39,424 | 12,78,418 | | | (28.3) | (22.8) | (27.0) | (5.8) | (31.5) | (11.6) | | Public Deposits | 20,909 | 1,02,439 | 1,23,348 | 22,532 | 1,19,201 | 1,41,733 | | | (1.2) | (19.4) | (15.9) | (7.8) | (16.4) | (14.9) | | Total Borrowings | 27,75,012 | 9,62,934 | 37,37,946 | 33,80,326 | 12,28,000 | 46,08,327 | | | (16.6) | (20.8) | (17.7) | (21.8) | (27.5) | (23.3) | | Other Liabilities | 3,22,577 | 59,554 | 3,82,131 | 3,47,168 | 76,930 | 4,24,098 | | | (14.0) | (10.3) | (13.4) | (7.6) | (29.2) | (11.0) | | Total Liabilities/ Assets | 41,39,676 | 13,86,074 | 55,25,750 | 48,28,152 | 17,69,060 | 65,97,211 | | | (18.1) | (20.4) | (18.6) | (16.6) | (27.6) | (19.4) | | Loans and Advances | 31,29,656 | 11,98,843 | 43,28,499 | 38,54,490 | 15,14,584 | 53,69,075 | | | (16.3) | (17.4) | (16.6) | (23.2) | (26.3) | (24.0) | | Investments | 6,45,273 | 91,528 | 7,36,801 | 5,97,620 | 1,34,309 | 7,31,929 | | | (43.8) | (49.7) | (44.5) | (-7.4) | (46.7) | (-0.7) | | Cash and Bank Balances | 1,26,022 | 57,624 | 1,83,646 | 1,60,701 | 65,720 | 2,26,422 | | | (2.2) | (48.4) | (13.3) | (27.5) | (14.1) | (23.3) | | Other Assets | 2,38,725 | 38,079 | 2,76,803 | 2,15,340 | 54,446 | 2,69,786 | | | (-2.0) | (26.3) | (1.1) | (-9.8) | (43.0) | (-2.5) | Notes: 1. NBFC-UL and NBFC-ML refers to NBFCs in upper and middle layer respectively.
2. Data are provisional.
3. Figures in parentheses are y-o-y growth in per cent.
Sources: Supervisory returns, RBI; and authors’ calculations. | Assets Loans and advances are the largest component on the assets side of balance sheet followed by investments. While loans and advances grew at a fast pace of 24 per cent at end-December 2025, investments decelerated reflecting an asset allocation shift towards core lending business. Secured lending, which constitutes about three-fourths of the total loans and advances, has been the primary driver of credit growth. Unsecured lending rose significantly at end-December 2025 on account of base effect (Chart 3). Liabilities NBFCs finance their operations by borrowing from banks and markets (debentures and commercial papers), which together accounted for a share of 77.2 per cent of the total borrowings of NBFCs at end-December 2025 (Chart 4). The share of bank borrowings showed a moderate rise in 2025 following the restoration of risk weights on bank lending to NBFCs to the levels prior to the increase in November 2023 and softening in bank lending rates7. Deposit-taking NBFCs (NBFC-D), which are few, have public deposits as an additional source of funds. Their deposits recorded a growth of 14.9 per cent at end-December 2025, reflecting attractive rates offered by NBFC-D. IV.2 Sectoral Credit of NBFCs Credit deployment trends show that retail and industry sectors are the drivers of overall credit growth of NBFCs. Within services, trade and commercial real estate recorded double digit growth. Retail loans continue to expand at a rapid pace given NBFCs' expertise in this segment. Vehicle loans, the largest segment in retail loans, experienced some deceleration, while gold loans continued to expand at a higher pace, contributing 10.5 per cent of the total incremental NBFC credit between December 2024 and December 2025. This can be attributed to higher eligible loan values supported by elevated gold prices. Credit to micro finance/ SHG loans declined in end-December 2025 reflecting regulatory guardrails and shifts by lenders toward secured lending options (Table 4). IV.3 Financial and Prudential Indicators Profitability as indicated by return on assets (RoA) and return on equity (RoE) remained at healthy levels across the layers at end-December 2025, albeit with a marginal moderation in RoA from the previous year, driven by NBFC-UL. RoE of NBFC-UL declined from the levels a year ago (Chart 5). This may be attributed to compression of interest margins. Asset quality of the NBFC sector has continued to improve in recent years as reflected in consistent decline in NPA ratios. At end-December 2025, GNPA and NNPA ratios further improved to 2.7 per cent and 0.9 per cent, respectively (Chart 6). | Table 4: Sectoral Credit Deployment by NBFCs | | (₹ crore) | | Items | End-December | Percentage variation y-o-y | | 2022 | 2023 | 2024 | 2025 | 2024 | 2025 | | 1 | 2 | 3 | 4 | 5 | 6 | 7 | | 1. Agriculture & Allied Activities | 55,479 | 61,573 | 79,501 | 91,135 | 29.1 | 14.6 | | | (1.7) | (1.7) | (1.8) | (1.7) | | | | 2. Industry | 16,22,182 | 18,63,691 | 20,11,732 | 24,35,610 | 7.9 | 21.1 | | | (51.1) | (50.2) | (46.5) | (45.4) | | | | 3. Services, | 4,28,481 | 5,17,683 | 6,24,586 | 8,28,345 | 20.7 | 32.6 | | Of which | (13.5) | (13.9) | (14.4) | (15.4) | | | | 3.1 Transport Operators | 1,15,039 | 1,28,230 | 1,56,643 | 1,71,406 | 22.2 | 9.4 | | | (3.6) | (3.5) | (3.6) | (3.2) | | | | 3.2 Trade | 61,183 | 81,632 | 1,07,540 | 1,26,447 | 31.7 | 17.6 | | | (1.9) | (2.2) | (2.5) | (2.4) | | | | 3.3 Commercial Real Estate | 81,584 | 82,640 | 85,647 | 1,12,529 | 3.6 | 31.4 | | | (2.6) | (2.2) | (2.0) | (2.1) | | | | 4. Retail Loans, | 9,61,937 | 11,93,837 | 15,34,971 | 19,25,831 | 28.6 | 25.5 | | Of which | (30.3) | (32.2) | (35.5) | (35.9) | | | | 4.1 Vehicle/Auto Loans | 3,67,460 | 4,28,484 | 5,37,645 | 6,42,617 | 25.5 | 19.5 | | | (11.6) | (11.5) | (12.4) | (12.0) | | | | 4.2 Advances to Individuals against Gold | 1,19,661 | 1,43,106 | 1,84,456 | 2,94,129 | 28.9 | 59.5 | | | (3.8) | (3.9) | (4.3) | (5.5) | | | | 4.3 Micro finance loan/ SHG Loan | 94,679 | 1,31,755 | 1,32,704 | 1,21,145 | 0.7 | -8.7 | | | (3.0) | (3.5) | (3.1) | (2.3) | | | | 5. Others | 1,07,293 | 75,131 | 77,710 | 88,153 | 3.4 | 13.4 | | | (3.4) | (2.0) | (1.8) | (1.6) | | | | Gross Advances (1 to 5) | 31,75,372 | 37,11,914 | 43,28,499 | 53,69,074 | 16.6 | 24.0 | Notes: 1. Data are provisional.
2. Figures in parenthesis are percentage share to gross advances.
Sources: RBI supervisory returns; and authors’ calculation. |
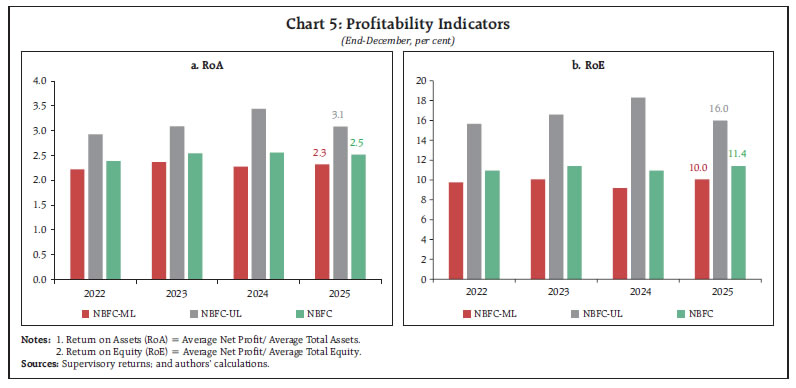
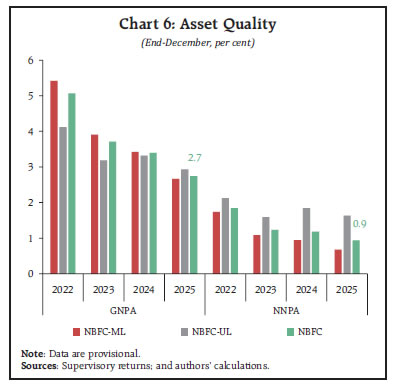 NBFCs continue to remain well capitalised with capital to risk weighted assets ratio (CRAR) at 25.2 per cent in December 2025, well above the regulatory prescription of 15 per cent (Chart 7). V. Orientation of NBFCs towards AI and Digital Technologies With the increasing scale, interconnectedness and digitalisation of the NBFC sector, AI is emerging as a frontier technology with cross-cutting applications across lending, risk management and operational functions. Recent reports8 suggest that investment in digital technologies and partnerships with fintech firms are enabling NBFCs to improve operational efficiency and deepen formal credit penetration, particularly for small businesses and underserved borrowers in the economy. Further AI presents new ways to address developmental challenges for an emerging economy like India. Recognising this and to encourage the responsible and ethical adoption of AI in the financial sector, the FREE-AI (Framework for Responsible and Ethical Enablement of Artificial Intelligence) Committee9 was constituted by the Reserve Bank of India. The report has offered seven sutras10 that represent the core principles to guide AI adoption in the financial sector. 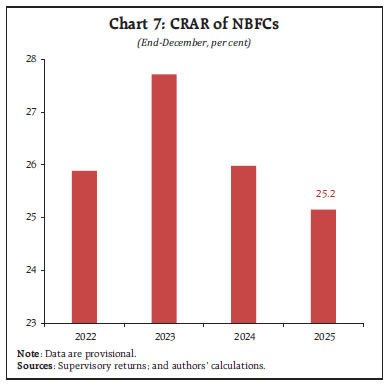 In this context and in line with existing literature (Hong et al.,2023; Goel et al., 2024), this section attempts to assess the extent of orientation of NBFCs towards AI and digital technologies, by employing a dictionary-based text mining approach using annual report disclosures from a sample of 2611 major NBFCs (including HFCs) covering the period from 2020-21 to 2024-25. For this purpose, the annual reports have been converted into machine-readable text and subjected to Natural Language Processing based pre-processing procedures12, thereby transforming unstructured textual information into a standardised format suitable for analysis (Baier , Berninger, & Kiesel, 2020). This approach, however, has limitations and lacks the contextual verification of Large Language Models13. Hence, the results may be interpreted as indicative of emerging orientation towards AI and not definitive evidence of full-scale and wider operational deployment. To map relevant words from the annual reports, an NBFC-specific AI and Technology dictionary has been constructed, incorporating terms related to AI, machine learning, automation, digitalisation, data analytics, cloud computing, cybersecurity, fintech innovations, digital platforms, and other technology-enabled applications (Annex Table 1). The selection of keywords was informed by existing AI glossaries, technology-related literature, annual reports, and financial sector-specific terminology, with further refinement to ensure relevance to NBFCs’ operations, digital transformation initiatives, and technology-enabled financial intermediation. The processed text corpus from NBFC annual reports was then mapped against the dictionary to identify and quantify the occurrence of AI and technology related keywords within each annual report. To ensure comparability across firms over time, an AI orientation score was computed by normalising the frequency of identified keywords by the total word count of the respective annual report, thereby controlling for variations in report length and providing a standardised measure of disclosure intensity that is comparable across companies and over time. The thematic analysis suggests that orientation towards AI and technology in the sector is concentrated towards customer and financial applications, governance and digital infrastructure, and data analytics (Chart 8). The average AI orientation score14 of the NBFC sector exhibited a broad upward trajectory during the period of study except for some moderation in 2021-22. The RBI Working Group on Digital Lending15 highlighted concerns relating to data privacy, technology standards and transparency of algorithmic lending models. This may have prompted NBFCs to place greater emphasis on governance and compliance alongside technology usage. The sharp rise observed post 2021-22, however, reflects growing strategic focus on AI-driven and technology oriented operational models within the sector (Chart 9). Going forward, AI and technology solutions are expected to become more integrated in work processes of NBFCs. VI. Conclusion In the aftermath of the global financial crisis, NBFIs have emerged as a major credit provider outpacing banks in the advanced economies. In India, too, the growth in NBFC credit has been high in recent years, even though banks continue to be the major credit provider. On the liabilities side, NBFCs’ dependence on banks for funds may be monitored on an on-going basis, keeping in view the systemic concerns, if any, emanating from their interconnectedness. Importantly, the Indian NBFC sector has exhibited robust health in terms of profitability, asset quality and capital position. The preliminary text mining analysis shows that orientation of NBFCs towards AI and digital technologies is currently concentrated towards customer and financial applications, governance and digital infrastructure, and data analytics. References Baier, P., Berninger, M., & Kiesel, F. (2020). Environmental, social and governance reporting in annual reports: A textual analysis. Financial Markets, Institutions & Instruments, John Wiley & Sons. Hong, L., Nikbakht, E., & Zhou, T. (2023). Does product market competition affect the adoption of FinTech by non-financial firms? Finance Research Letters. Goel, S., Raut, D. K., Kumar, M., & Sharma, M. (October 2024). How Indian Banks are Adopting Artificial Intelligence? RBI Bulletin.
Annex | Annex Table 1: Glossary of AI/Technology Related Terms | | Category | Terms Included | | Core AI Technologies | Artificial Intelligence, Machine Learning, Deep Learning, Neural Network, Natural Language Processing, Computer Vision, Large Language Model, Generative AI, Transformer, Reinforcement Learning, Supervised Learning, Unsupervised Learning, Deep Neural Network, Recurrent Neural Network, Convolutional Neural Network, Classification Model, Regression Model, Decision Tree, Random Forest, Clustering, K-Means, Feature Engineering, Generative Models, Foundation Model, Multimodal AI, Knowledge Graph, Vector Database, Autonomous System, Intelligent System, Cognitive Computing, Model Deployment, Model Training, Model Inference, Machine Intelligence, Artificial Neural Network, ChatGPT, AI Agent. | | Data Analytics & Intelligence | Big Data, Data Analytics, Advanced Analytics, Data Science, Data Mining, Data Driven, Real-Time Analytics, Business Intelligence, Decision Intelligence, Decision Support System, Analytics Engine, Digital Intelligence, Predictive Model, Predictive Analytics, Forecasting Model, Forecasting Analytics, Predictive Scoring, Sentiment Analysis, Customer Analytics, Customer Segmentation, Customer Intelligence, Personalization, Customer Insights, Recommendation System, Operational Analytics, Financial Intelligence, Financial Analytics, Credit Analytics, Risk Modeling, Risk Analytics, Credit Risk Modeling, Fraud Analytics, Default Prediction, Behavioral Scoring, Alternative Data, Data Platform. | | Automation & Process Optimisation | Automation, Workflow Automation, Document Processing Automation, Intelligent Automation, Robotic Process Automation, Process Optimization, Intelligent Workflow, Smart Automation, Automated Decision Making, Loan Automation. | | Customer & Financial Applications | Chatbot, Virtual Assistant, Conversational AI, Voice Assistant, Credit Scoring, Loan Underwriting, Digital Lending, Instant Loan Approval, Credit Engine, Smart Underwriting, Intelligent Lending, Anomaly Detection, Fraud Prevention, Customer Risk Profiling, Robo Advisory, Algorithmic Trading, Portfolio Optimization, Automated Investment, AI-Powered Banking, Smart Banking, Digital Banking, WealthTech, FinTech. | | Governance & Digital Infrastructure | Responsible AI, Explainable AI, Ethical AI, Model Governance, AI Governance, Cloud Computing, Cloud Platform, Digital Platform, API Integration, Innovation Lab, Advanced Technology, Technology Platform, Digital Ecosystem, Digital Transformation. | Note: The categorisation of terms has been undertaken to facilitate thematic analysis. The terms are broadly categorised based on their meaning and usage in the relevant context.
Source: Authors’ compilation. |
|