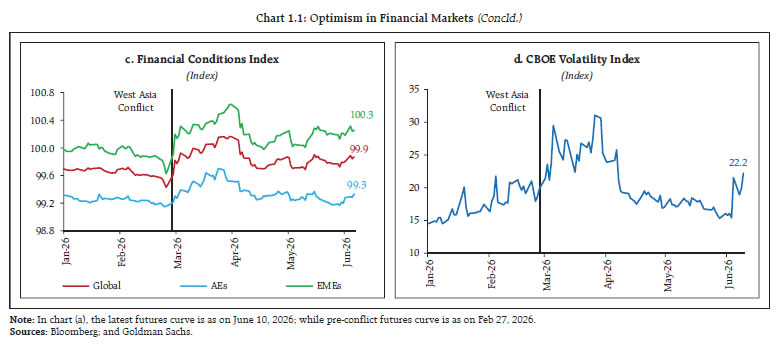
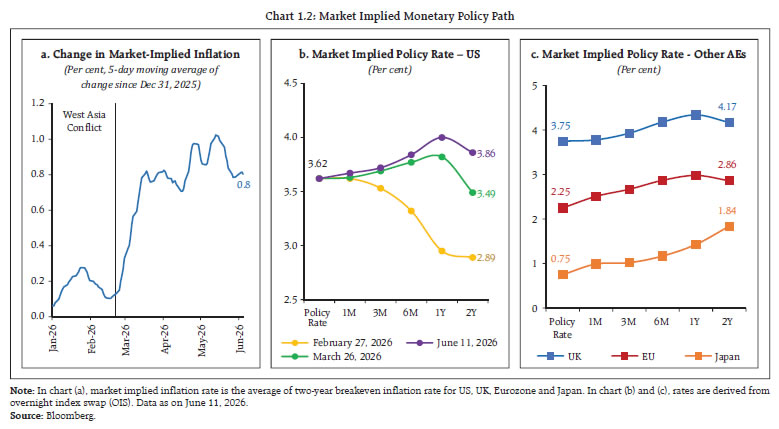
Global financial conditions tightened following the outbreak of the West Asia conflict. Though financial markets have recovered, supported by optimism around artificial intelligence, salient vulnerabilities such as bond market fragilities, elevated asset valuations and the expanding role of non-bank financial intermediaries could amplify fresh shocks and pose risks to global financial stability. In contrast, domestic financial stability risks remain contained despite ongoing global uncertainty. The strength of the domestic banking system, underpinned by strong capital and liquidity buffers and sustained credit growth, continues to support economic activity. Nonetheless, recurring external shocks could tighten financial conditions with potential implications for macroeconomic outlook and domestic financial stability. Global and Domestic Backdrop 1.1 This edition of the Financial Stability Report (FSR) evaluates financial stability risks, global and domestic, against the backdrop of the West Asia conflict. The conflict poses significant challenges to both the global and the domestic economy through a steep rise in energy and other commodity prices and disruption to global supply chains. Although the interim peace deal has mitigated uncertainty surrounding the outlook considerably, the exact impact will be contingent on the extent and pace of supply chain normalisation. 1.2 The global financial system has displayed resilience despite successive shocks in the recent past. The financial markets, which elicited strong initial reactions at the onset of the war, have since become more sanguine. A combination of lower-than- anticipated rise in oil futures price, strong corporate earnings, the artificial intelligence (AI) driven boom, and supportive financial conditions has underpinned market optimism and kept volatility contained (Chart 1.1 a, b, c and d). 1.3 Global financial stability risks, however, remain elevated. The rebuilding of inventories by countries could keep energy prices relatively elevated even as supply chain normalisation gains pace. An increase in market-implied inflation in advanced economies points to rising inflation risk. Consequently, market is pivoting from expectations of rate cuts to a future monetary policy path that is pricing either an extended pause or rate hikes (Chart 1.2 a, b and c). This could tighten global financial conditions. Alongside, vulnerabilities emanating from rising public debt, bond market fragilities, elevated asset valuations and concentrated exposures due to substantial investments in AI have become more pronounced. The growing footprint of leveraged and price-sensitive non-bank financial intermediaries (NBFIs) remains a major source of amplification channel. Thus, fresh shocks could trigger vulnerabilities and amplify them, leading to financial stability risks. 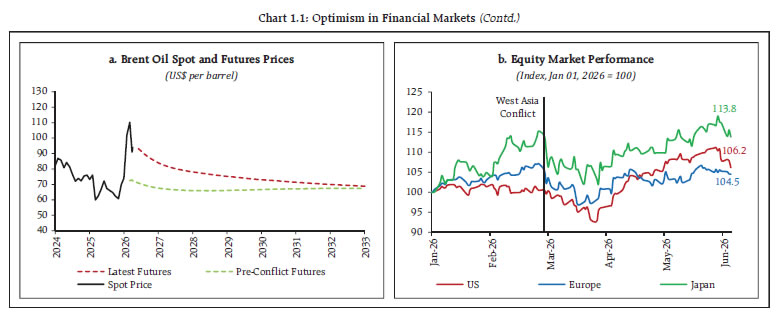
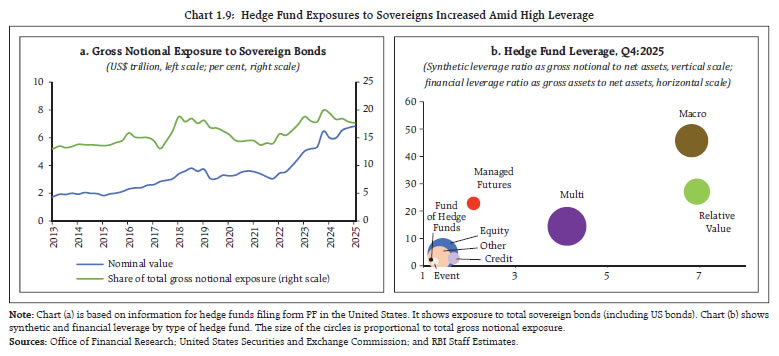
 1.4 India’s sound macroeconomic fundamentals provide ample buffers to deal with external shocks. However, the Indian economy remains exposed to energy price shocks and supply-chain disruptions given its high dependence on imported oil and other key commodities. The current account deficit (CAD) remained within manageable limit in 2025- 26, though overall balance of payments (BoP) stayed in deficit for the second year in a row mainly due to weak capital inflows (Chart 1.3). 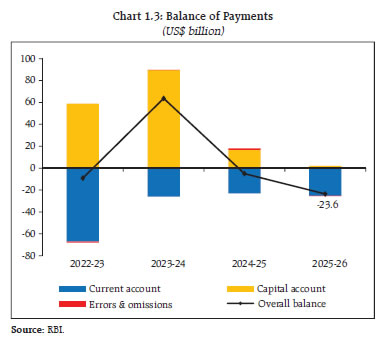 1.5 The West Asia conflict and consequent increase in global uncertainty also impacted emerging market economies (EMEs) like India through the financial channel. The exchange rate came under sustained depreciation pressure due to weakening of capital inflows and higher hedging demand from importers and investors. Notwithstanding sustained fiscal consolidation, government bond yields, especially at the longer end, came under pressure mainly reflecting geopolitical tensions and rising energy prices. However, the pressure on exchange rate and bond yields has eased post the measures taken by the Reserve Bank and the Government to attract capital flows, helping overall financial conditions to ease (Chart 1.4 a, b, c and d). 1.6 Notably, sound macroeconomic fundamentals and a healthy financial system helped the Indian economy to withstand spillovers from the West Asia crisis (Chart 1.5 a and b). Globally, India is still the fastest growing major economy supported by domestic demand, even as inflation remains within target. The balance sheet of banks and non-banks remain robust with adequate capital and liquidity buffers, limiting the risk of financial shocks spilling over to the real economy. Moreover, despite an uptick in the financial system stress indicator (FSSI), the stress in the domestic financial system remains relatively low compared to previous crisis episodes (Chart 1.5 c). I.1 Global Macrofinancial Vulnerabilities 1.7 The global financial system is confronting the shock from the West Asia conflict at a time when there is an increased likelihood of multiple vulnerabilities getting triggered simultaneously. While this shock can create inflationary pressures and tighten financial conditions, shift in market sentiments could precipitate financial market instability through several channels that could amplify the shock. Against this backdrop, this section analyses three key global amplification channels, viz., bond market fragilities, elevated asset valuations and concentrated exposures, and risks posed by NBFIs that could create potential financial stability risks. I.1.1 Bond Market Fragilities 1.8 Sovereign debt, already at elevated levels, continues to increase at a time when the global economy is facing growth headwinds and increasing debt servicing costs. Beyond existing debt burdens, government deficits could widen as higher yields raise interest costs and efforts to mitigate the impact of elevated energy prices increase borrowing needs (Chart 1.6 a and b). 1.9 Following the West Asia conflict, government bond yields have surged to their highest levels in 20 years in some of the advanced economies (AEs) (Chart 1.7 a and b). The rise in sovereign bond yields is being driven by multiple factors, including inflationary pressures from higher energy prices linked to the West Asia conflict, central bank rate hike expectations, sustained fiscal deficits necessitating greater bond issuance, higher term and inflation premia demanded by investors amid rising geopolitical uncertainty, and quantitative tightening by central banks. 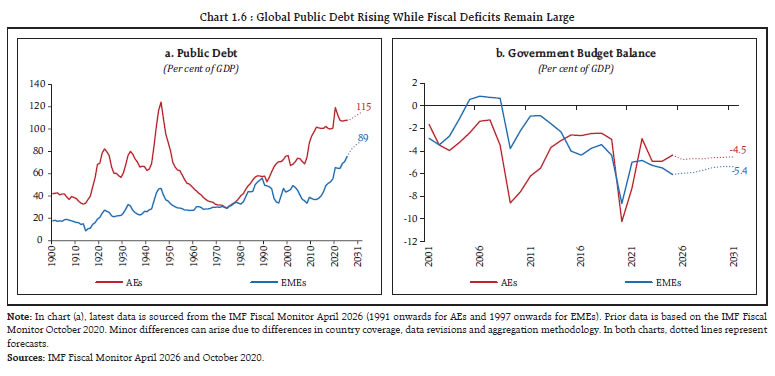 1.10 Amid rising global debt levels, rollover risks are increasing as governments have substantially shortened the maturity profile of their debt in the recent period, thereby increasing refinancing requirements (Chart 1.8 a). Over the past three years, G4 sovereigns1 have shortened the average maturity of debt issuance, ranging between 0.1 and 2.6 years, amid rising term premiums, while price-sensitive investors, such as investment funds, foreign investors, and households, now hold at least half of the debt.2 According to the Organisation for Economic Co-operation and Development (OECD), the refinancing needs of OECD countries reached a record high of US$ 13.5 trillion in 2025 – accounting for around 80 per cent of total borrowing and are expected to rise further.3 Nonetheless, investor appetite for dollar-denominated debt issued by fiscally disciplined countries remains strong, as reflected in the narrowing spreads over US treasuries (Chart 1.8 b and c). 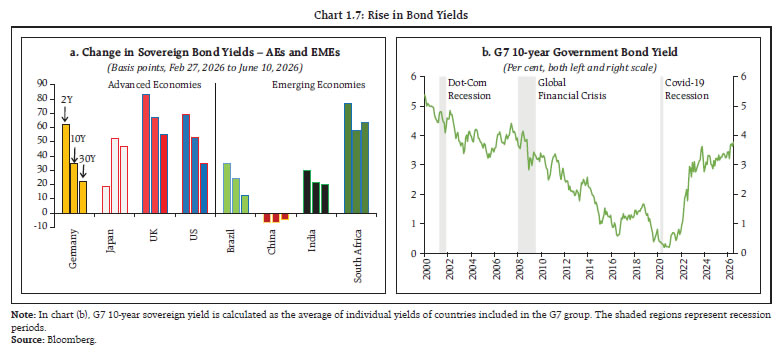 1.11 At a time when questions are being raised about the safe asset status of government bonds by market participants, the convenience yield4 on sovereign bonds is declining and volatility in bond markets is rising. Fragilities in bond markets could transmit faster to banks’ balance sheets given the sovereign-bank nexus. Moreover, the footprint of price-sensitive leveraged investors (including hedge funds) in sovereign bond markets is growing (Chart 1.9 a).5 Large and leveraged hedge funds are involved in sovereign bond arbitrage trades, such as cash-futures basis and swap spread trades, using high leverage (Chart 1.9 b). Therefore, in periods of market stress, these funds could rapidly unwind their positions and increase the risk of fire sales and broader market spillovers. 1.1.2 Elevated Asset Valuations and Concentrated Exposures 1.12 Asset valuations in most AEs remain high, while spreads continue to be compressed (Chart 1.10 a). Though the outbreak of the West Asia conflict triggered strong initial reactions and corrections, equity markets in AEs and those driving the AI momentum have mostly recovered. Emerging market economies (EMEs), however, saw sharper corrections with energy importers witnessing larger adjustment in prices (Chart 1.10 b and c). Optimism about long-term prospects of AI and strong corporate earnings expectations have underpinned high equity market valuations, especially in Korea and Taiwan (Chart 1.10 d). 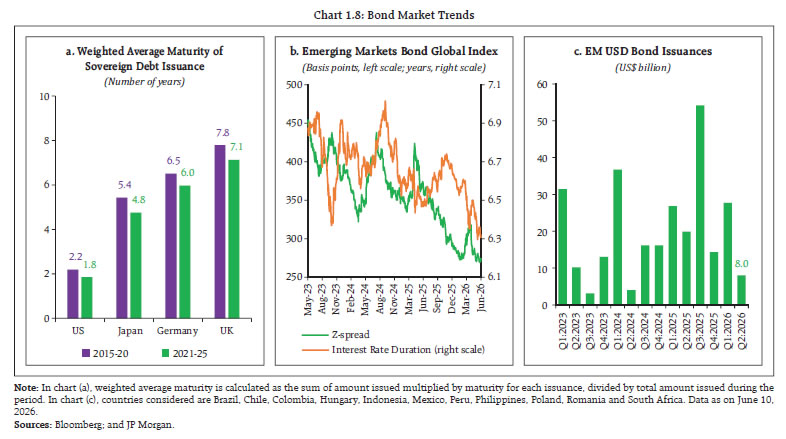
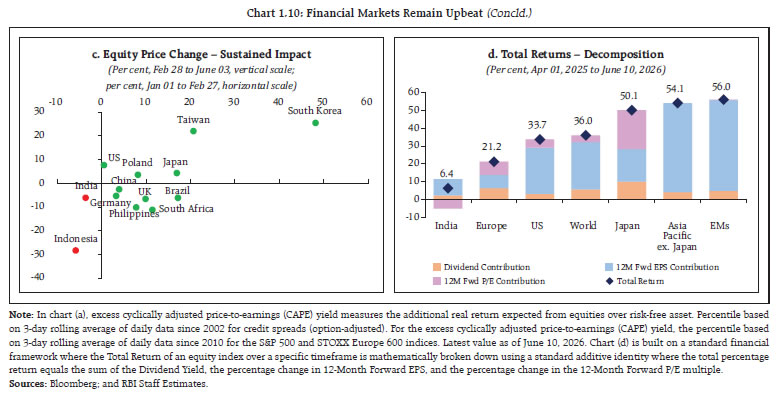
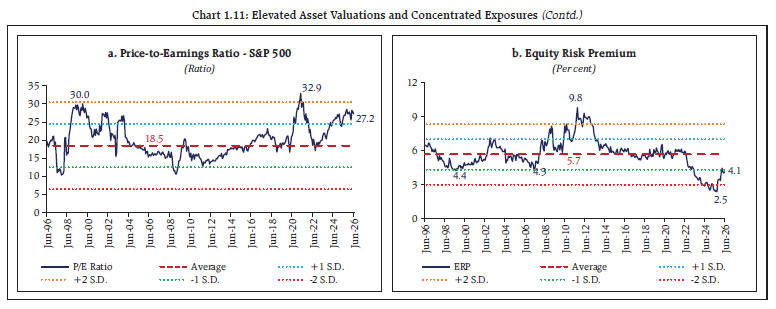
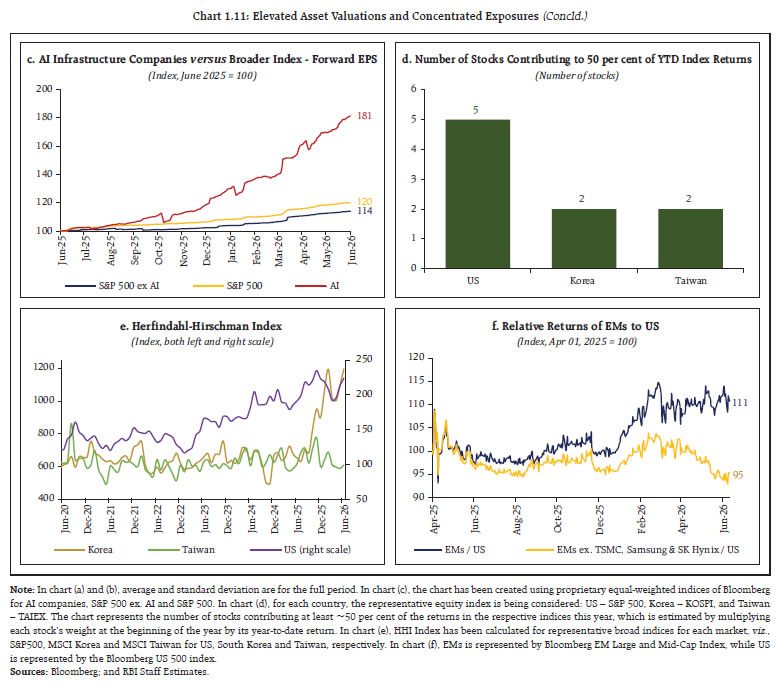
 1.13 Measures of equity valuations in the US across multiple metrics remained at the upper end of historical range (Chart 1.11 a and b). Meanwhile, the rest of the world’s exposure to US equity markets has grown markedly with gross foreign holdings of US equities rising to US $21 trillion in March 2026 from US $7.5 trillion in March 2020.6 Concentration remains elevated with a small group of firms involved in AI-related technologies increasingly driving stock market performance in economies that are leading AI adoption or participating in its supply chain (Chart 1.11 c, d and e). The recent outperformance of some emerging markets has also been largely driven by AI-linked companies rather than broad-based strength (Chart 1.11 f). Both remain sources of financial fragility as sell-offs in these firms could cause broader market declines in the US, and cause spillovers to other markets through wealth effects. 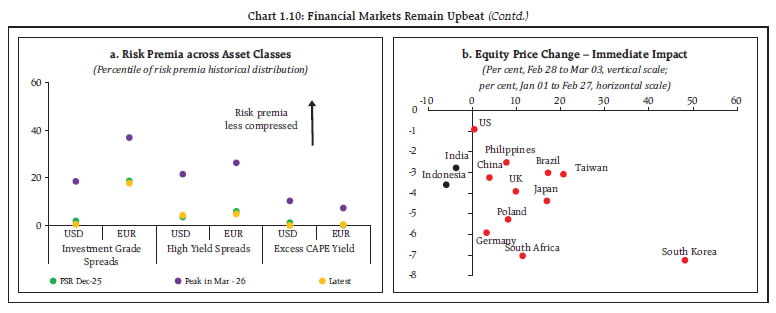
 1.14 AI-related investments are now permeating other segments of capital markets, including bond markets. As hyperscalers ramp up capital expenditure on AI buildout amid declining free cash flows, they have significantly increased debt issuances over the past two years to fund these investments (Chart 1.12). Debt financing is expected to rise significantly as spending expands further. Thus, an AI-driven asset price correction could pose systemic risks through this channel, as banks may be indirectly exposed through their exposure to private credit firms and other key financing intermediaries funding the AI boom. 1.15 Some EMEs have also registered a rise in asset valuations. Better economic fundamentals and rating upgrades have attracted substantial cross-border portfolio flows, especially from NBFIs. Large share of these capital flows is carry-trade-driven debt flows aimed at taking advantage of higher yields in EMEs relative to AEs (Chart 1.13 a). Given their procyclical nature, these flows can reverse abruptly during periods of stress, as falling risk appetite triggers investor unwinding. During the West Asia conflict, EMEs witnessed larger capital outflows compared to previous crises (Chart 1.13 b). I.1.3 Risks Posed by NBFIs 1.16 As the NBFI sector continues to expand, growing at double the pace of the banking sector, their rising footprint across asset classes heightens the risk of shock amplification and turning market turmoil into financial instability (Chart 1.14). Highly leveraged and quantitative investment strategies by NBFIs have the potential to cause volatility in funding markets, core bond markets and equity derivative markets. 1.17 Hedge funds undertake cash-futures basis and swap-spread trades by employing leverage both through repo funding and smaller margins (Chart 1.15). This exposes these trades to both funding and liquidity risks—inability to rollover repo borrowing and failure to meet margin calls. Repeatedly, hedge funds have rapidly unwound these trades in periods of stress, causing market turbulence.7
1.18 NBFIs are suppressing volatility in equity option markets through large volume of options trading8, especially in short-dated options such as zero-day-to-expiry (0DTE) options. Since they employ dynamic strategies to hedge their positions, these trades amplify market moves and create instability, especially during stress episodes. Meanwhile, leveraged ETFs are having an outsized impact on equity market movements relative to their exposure, and are amplifying price swings through their mechanical rebalancing process. 1.19 Private credit, another form of non-bank financial intermediation, has expanded notably in recent years. Estimates vary about the size of the private credit market—ranging from US$ 1.5 to US$ 2 trillion—due to differing definitions across jurisdictions and data challenges. The private credit ecosystem comprises a diverse set of interconnected banks and non-bank participants. The interlinkages between these entities are difficult to spot and assess given the opacity in these markets and multiple with varying levels of leverage.9 In recent period, some fault lines have emerged in private credit with defaults and rising redemption requests (Chart 1.16 a and b). While the current stress in private credit may not cause systemic risk, continued monitoring is vital to identify vulnerabilities and limit broader financial system impact. 1.20 The rapid expansion in non-bank financial intermediation is partly a consequence of tighter regulations on banks to preserve the core of the financial system. Alongside, central banks are normalising their balance sheet size by unwinding quantitative easing, a process that could result in limited market support and greater financial market volatility. One proposed approach to reducing balance sheet size is to ease banks’ liquidity coverage ratio (LCR) and net stable funding ratio (NSFR) requirements, thereby lowering demand for central bank reserves.10 Conversely, since NBFIs are lightly regulated, opaque, price-sensitive, and highly levered, and have no access to central bank liquidity facilities, their actions could amplify losses during stress episodes and create instability. Thus, as central banks unwind quantitative easing, safeguarding financial stability may become increasingly challenging amid the growing systemic importance of NBFIs and their increasing linkages with the banking sector. 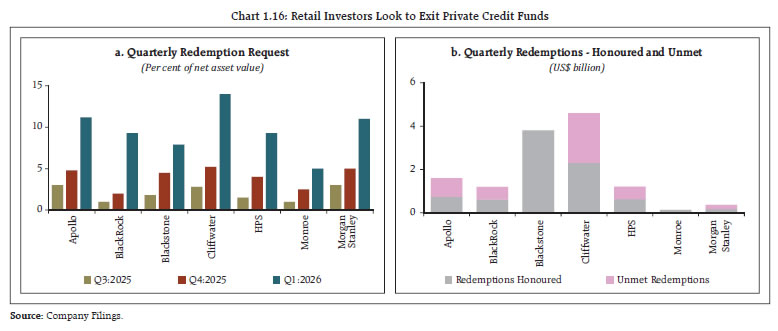 I.2 Domestic Macroeconomic Conditions 1.21 The Indian economy entered the recent bout of global turbulence triggered by the West Asia conflict with stronger macroeconomic fundamentals than in many earlier episodes of external stress. While India’s resilience provides an important buffer against these shocks, some impact is inevitable given the country’s substantial dependence on imported energy. 1.22 Indian economy recorded a strong growth of 7.7 per cent in 2025-26 (average growth of 7.3 per cent in the last three years), supported by strong private consumption and fixed investment. Most of the high-frequency indicators for April–May 2026 point to continued resilience in economic activity, suggesting that growth has remained firm in the first quarter of 2026–27 despite headwinds arising from the West Asia conflict. Nevertheless, elevated oil and other commodity prices and weaker global growth could adversely affect India’s domestic growth in 2026-27. Against this backdrop, the monetary policy committee (MPC) has projected a growth of 6.6 per cent for 2026-27. Several measures undertaken by the Government, including support to MSME and export sectors, are expected to help sustain economic activity, while mitigating the impact of external shocks. In addition, the interim peace deal has laid the foundation for cessation of this conflict and normalisation of supply chains, which could provide tailwinds to growth. 1.23 Inflation has remained contained and below the 4 per cent target, although it has inched up in the recent months. Headline inflation rose from 3.5 per cent in April 2026 to 3.9 per cent in May 2026, reflecting, inter alia, an increase in pass-through of oil prices. However, a combination of conflict-driven supply shock and projected weak monsoon due to El Niño could push inflation to the higher end of the tolerance band in Q3:2026-27 and worsen inflation expectations. Accordingly, the MPC revised its inflation projection upwards from 4.6 per cent to 5.1 per cent for 2026-27. 1.24 The West Asia conflict led to a sharp increase in crude oil prices (Chart 1.17 a), which could widen India’s current account deficit (CAD), as has been the experience during past episodes (Chart 1.17 b). Crude oil prices have, however, moderated significantly following the signing of the interim peace deal and should alleviate the pressure on CAD. Gold imports, another key component impacting current account balance, rose significantly in 2025-26, reflecting a steep increase in gold price. Growth in gold imports, however, has decelerated substantially in May 2026 compared to the preceding month (Chart 1.17 c). Petroleum and gold together contribute more than half of the trade deficit (Chart 1.17 d), underscoring trade balance’s vulnerability to external shocks. Nonetheless, India’s CAD has remained modest, averaging less than 1 per cent of GDP over the past three years. 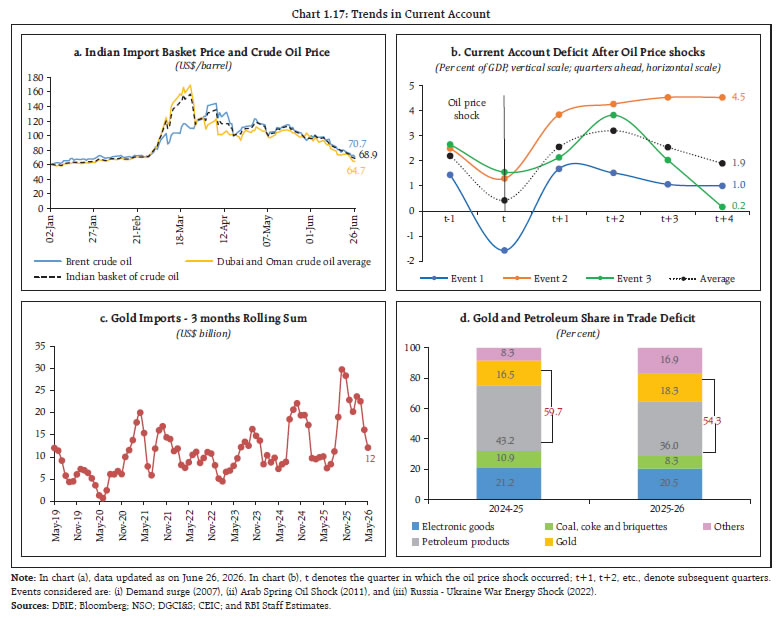 1.25 The capital account has remained under pressure due to moderating inflows. While gross foreign direct investments (FDI) were robust in 2025-26 (US$ 95 billion) on the back of strong growth prospects, net FDI flows were muted due to rising repatriation and higher outbound foreign direct investments (Chart 1.18 a). Net FDI are showing signs of revival with US$ 7.4 billion net flows in April 2026 compared to US$ 1.6 billion in the same month last year. India’s net FDI is sensitive to global financial conditions. Consequently, the recent decline in net FDI may, in part, reflect the tightening of global financial conditions (Chart 1.18 b). Alongside, foreign portfolio flows to India have been under pressure in 2025-26, which intensified after the start of the West Asia conflict due to deteriorating investor sentiments (Chart 1.18 c). Net external commercial borrowing (ECB) inflows also moderated significantly in 2025–26, driven by weaker inflows. The slowdown has continued into 2026-27 so far, with inflows in April 2026 trailing those of April 2025, potentially reflecting elevated hedging costs (Table 1.1). The recent measures announced by the Government and the RBI are expected to bolster capital inflows. Therefore, even if the CAD widens, stronger capital inflows are likely to mitigate the funding constraint (Chart 1.18 d). 1.26 India’s external sector remains resilient across a range of metrics, despite overall BoP deficit in the last two years. Foreign exchange reserves of US$ 672.6 billion, as on June 19, 2026, cover more than 10 months of merchandise imports and 90.6 per cent of outstanding external debt; external debt was relatively low at 20.8 per cent of GDP at end-March 2026; the share of short-term debt on residual maturity basis stood at 47.3 per cent of foreign exchange reserves at end- March 2026; and net international investment position (IIP) recorded a notable improvement (Chart 1.19 a and b). 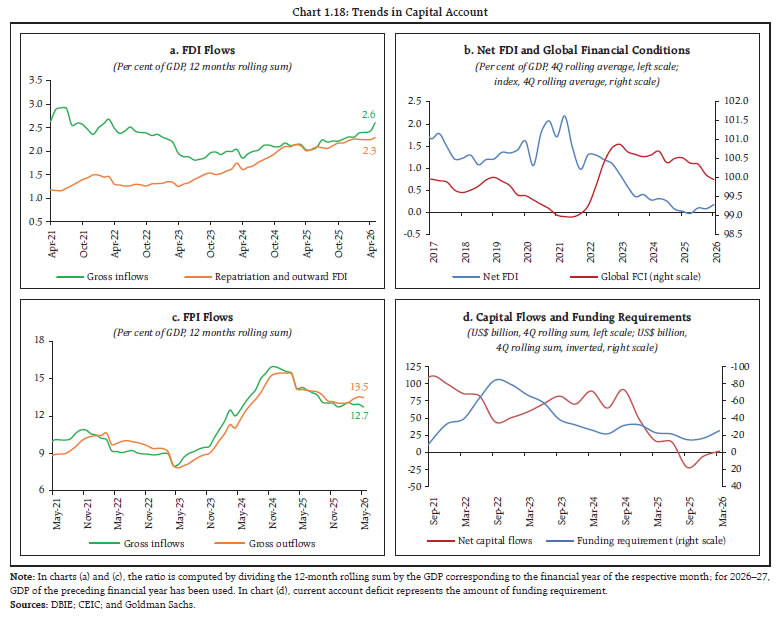
| Table 1.1: External Commercial Borrowing (ECB) Flows | | (In US$ million) | | Item | 2024-25 | 2025-26 | Apr-25 | Apr-26 | | (1) ECB Agreement | 61,184 | 42,969 | 2,917 | 3,765 | | of which, ECB Agreement-Non-FDI | 54,660 | 37,114 | 2,426 | 3,318 | | (2) ECB Inflows | 54,969 | 42,557 | 5,079 | 2,694 | | of which, ECB Inflows-Non-FDI | 48,018 | 35,655 | 4,543 | 2,167 | | (3) ECB Outflows (Principal Repayments) | 29,514 | 24,353 | 1,703 | 2,174 | | of which, ECB Outflows-Non-FDI | 25,904 | 21,491 | 1,289 | 1,942 | | (4) Net ECB Inflows (2-3) | 25,455 | 18,204 | 3,376 | 520 | | (5) Net ECB Inflows (in ₹ crore) | 2,16,249 | 1,60,802 | 28,886 | 4,865 | | Source: RBI. | 1.27 Another key macro variable that could come under some pressure is the fiscal deficit. The higher prices of energy and other commodities could adversely impact the fiscal arithmetic due to limited pass-through of oil price increase, excise duty cuts, and the higher outgo on account of subsidies. Increase in customs duty on imports of gold and silver, on the other hand, will provide a fiscal cushion. Any fiscal slippage could potentially harden government bond yields and exacerbate already elevated debt servicing burdens (Chart 1.20 a and b). However, the expected revival in FPI debt inflows, after the recent measures, alongside the fall in energy prices would increase demand for government bonds and ease pressure on yields.
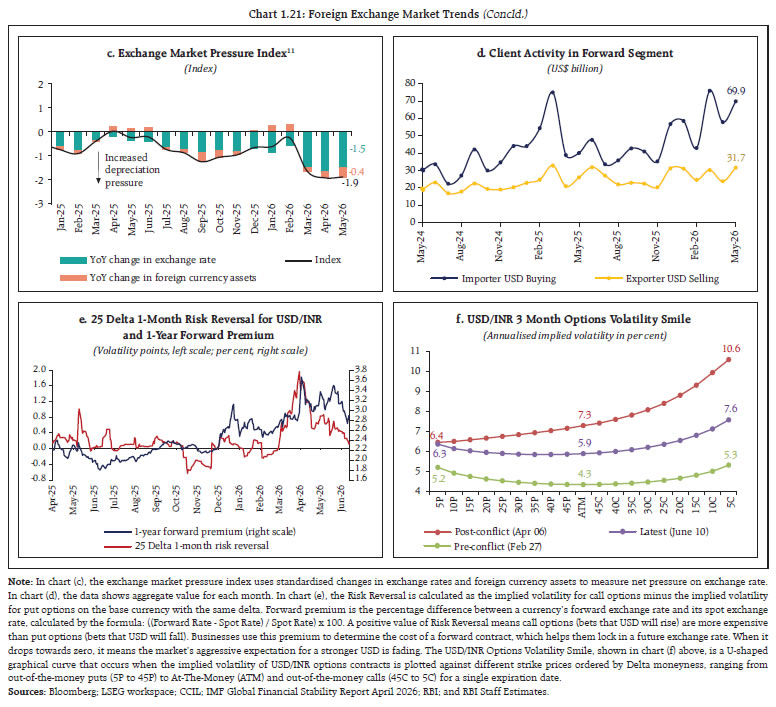
I.2.1 Financial Markets 1.28 The Indian Rupee (INR) has been under sustained depreciation pressure over the last several months due to elevated trade uncertainty, weakening of capital inflows and deteriorating investor sentiments (Chart 1.21 a and b). While the pressure on the INR predates the West Asia conflict, the outbreak of the conflict amplified depreciation pressure and volatility with importer hedging demand sharply outweighing exporter supply (Chart 1.21 c and d). While the bearish sentiment on the INR is showing signs of reversal (Chart 1.21 e), hedging through currency derivatives remains expensive compared to pre-conflict period (Chart 1.21 f). Recent measures undertaken by the Reserve Bank and the Government to attract capital inflows, together with the moderation in crude oil prices, are expected to improve market sentiments toward the Indian Rupee. 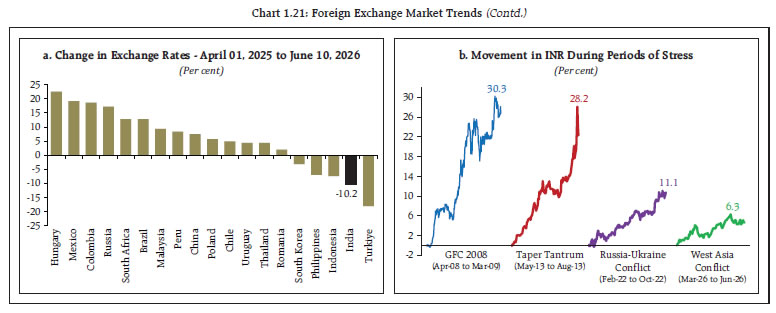
 1.29 In this context, the Reserve Bank also took measures to arrest the excessive volatility caused by onshore-offshore basis trades undertaken by banks. Ordinarily, such arbitrage trades improve market efficiency by reducing price discrepancies between markets. However, these trades transformed into speculative positions betting on the continued depreciation of the INR and created disorderly market conditions. Consistent with the stated policy of arresting excessive volatility and preventing market dysfunction, the RBI took several actions to safeguard exchange rate stability and maintain orderly market conditions, including limiting Net Open Position in Indian Rupees (NOP-INR) in the onshore deliverable market to within US$100 million.12 1.30 Money market continues to function in an orderly manner, supported by adequate banking system liquidity surplus. Transmission of policy repo rate has been robust at the shorter end of the money market, while it has been incomplete at the longer end and in the bond market (Chart 1.22 a). The RBI took several measures to supply durable liquidity, including open market operations (OMOs), FX buy/sell swap auctions and variable rate repo auctions. Despite these measures (Chart 1.22 b), the spread between certificate of deposits (CD) and similar maturity overnight-indexed swap (OIS) - a key metric of stress in money markets - has widened in the recent period (Chart 1.22 c). The OIS rates have exhibited substantial volatility in the last few months reflecting changing liquidity conditions and heightened uncertainty – 3-month OIS rate plunged considerably in June 2026 after surging in May 2026 (Chart 1.22 d). Contrary to seasonal easing trends, the CD rates remained elevated in Q1 of 2026-27 mainly due to rise in funding pressure with credit growth significantly outpacing deposit growth. Recent initiatives to augment capital flows are expected to improve near-term flow dynamics and increase rupee liquidity with banks, which, in turn, may ease pressure on money market rates. 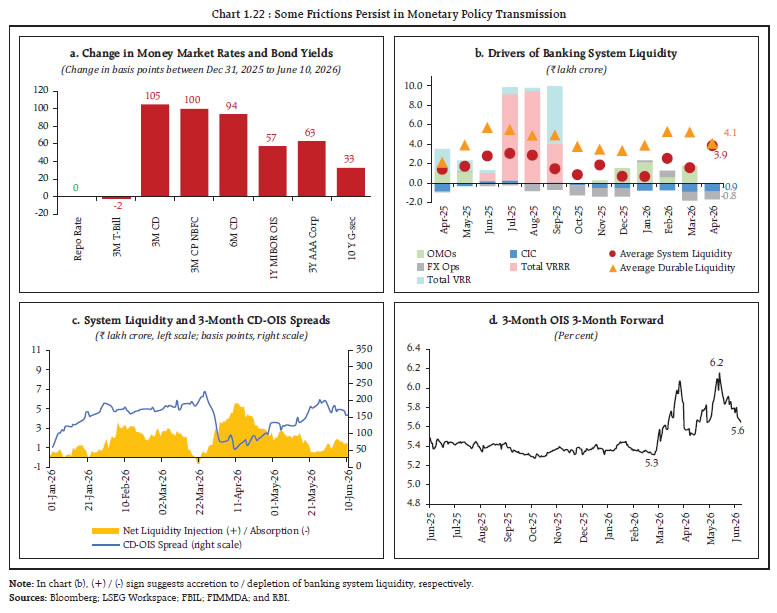 1.31 Since the onset of the West Asia conflict, the sovereign bond yield curve has steepened, especially at the short end (Chart 1.23 a). Consequently, the term spread has widened (Chart 1.23 b). Meanwhile, FPI flows to Indian government bonds remained stable, partly aided by the widening interest-rate differential between the US and India sovereign yields (Chart 1.23 c and d). 1.32 Besides evolving macroeconomic dynamics and external factors, demand–supply dynamics are playing an important role in shaping central government security (G-Sec) yields. The sharp rise in state government securities (SGS) issuances in recent years, coupled with their relatively higher yields, has led banks to increase their holdings of these securities (Chart 1.24 a and b). At the same time, long-term institutional investors such as insurers and pension funds have gradually diversified a larger share of their portfolios towards equities (Chart 1.24 c and d). These developments have financial stability implications. Growing bank exposure to SGS could strengthen linkages between state finances and bank balance sheets, warranting close monitoring of fiscal risks at the sub-national level. In addition, a sustained preference for higher-yielding government securities could, at the margin, influence the allocation of greater bank resources towards statutory liquidity ratio (SLR)- eligible investments, which could constrict credit flow to the private sector. 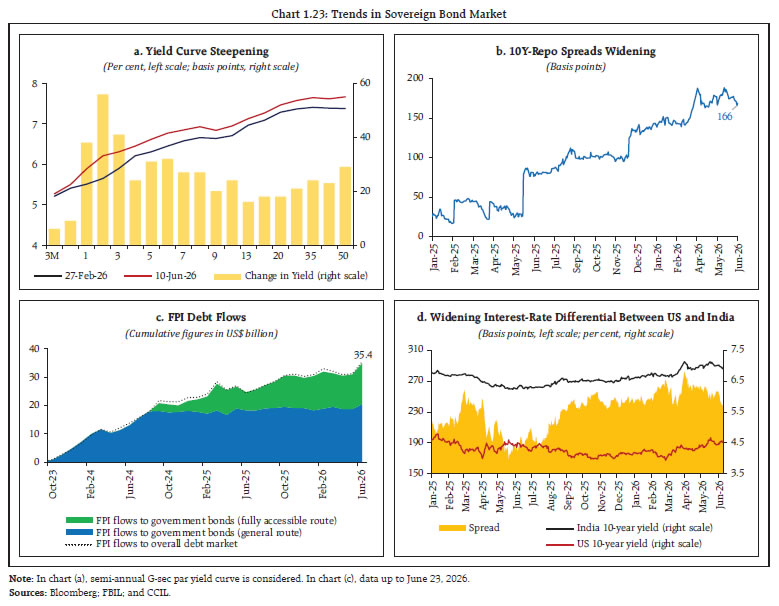 1.33 Total resource mobilisation from the Indian securities market in 2025-26 declined marginally to ₹15.3 lakh crore, down by 2.3 per cent y-o-y, amidst heightened economic uncertainty. The overall decline was largely due to an 8.4 per cent contraction in debt issuances, even as equity issuances remained strong, growing by 4.9 per cent, led by a record 366 IPOs that raised ₹1.9 lakh crore in 2025–26 (Table 1.2).
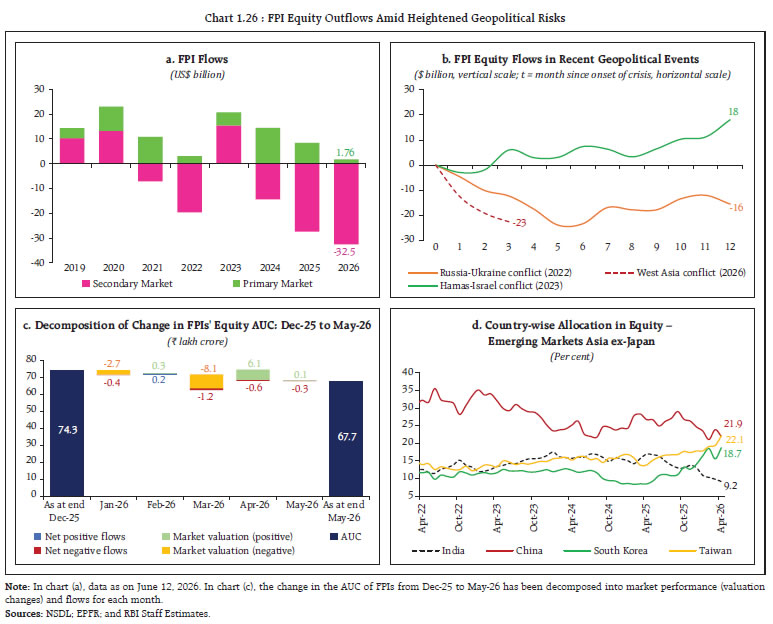
| Table 1.2: Resource Mobilisation in the Indian Securities Market | | (₹ lakh crore) | | Category | 2023-24 | 2024-25 | 2025-26 | | Equity - Public | 0.83 | 2.10 | 2.35 | | Equity - Private | 1.14 | 2.20 | 2.16 | | Debt - Public | 0.19 | 0.08 | 0.11 | | Debt - Private on listed basis | 8.38 | 9.87 | 9.00 | | Real Estate Investment Trusts | 0.06 | 0.05 | 0.09 | | Infrastructure Investment Trusts | 0.33 | 0.27 | 0.21 | | Alternative Investment Funds | 0.86 | 1.11 | 1.39 | | Total | 11.80 | 15.68 | 15.32 | | Source: SEBI | 1.34 The domestic equity market, which trailed its emerging market peers since last year, fell amid concerns about India’s exposure to the supply shock and the attendant softening in corporate earnings growth (Chart 1.25 a). Earnings’ growth differential of India vis-à-vis EMs has dropped below its long-term average (Chart 1.25 b). The relative underperformance of Indian equities has coincided with prolonged and large sell-offs by foreign portfolio investors (FPIs), with their ownership of Indian equities falling to a two-decade low and below that of domestic institutional investors (DIIs) (Chart 1.25 c). 1.35 FPI equity outflows of US$ 30.7 billion in 202613 have exceeded the prior record of US$ 18.9 billion in 2025, marking the highest level observed in the past two-and-a-half decades. (Chart 1.26 a and b). A combination of rich equity valuations, lack of AI trade and relatively lower earnings growth has affected investor sentiment. The assets under custody (AUC) of FPIs in the equity segment moderated to around ₹67.7 lakh crore in May 2026 from around ₹74.3 lakh crore in December 2025. The decline in the AUC, amounting to roughly ₹6.6 lakh crore over the period, was primarily driven by valuation losses of around ₹4.3 lakh crore, while net outflows contributed around ₹2.3 lakh crore to the overall erosion (Chart 1.26 c). Furthermore, FPIs’ portfolio allocation trend indicates a moderation in India’s share within the emerging market funds (Chart 1.26 d) 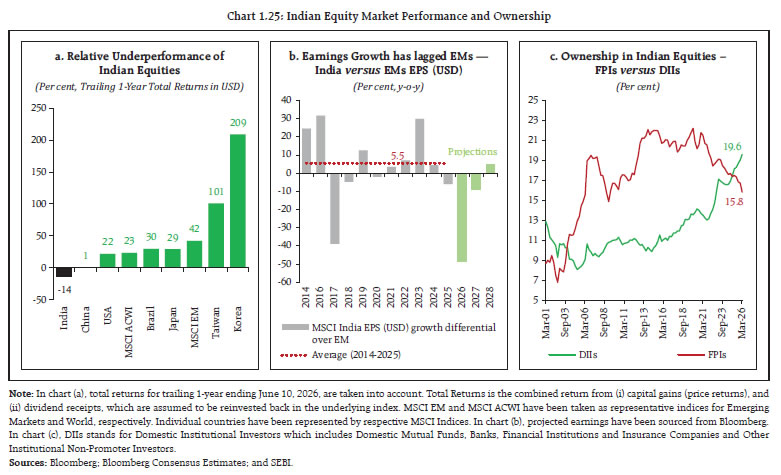
 1.36 Notwithstanding the sharp correction in equity markets, its resilience has improved considerably. Analysis of the worst drawdown over 5-day period across multiple crisis episodes showed that it was the lowest in the current episode (Chart 1.27 a). The rising support from domestic institutional investors – mutual funds, insurers, and pension funds – has strengthened domestic equity market resilience (Chart 1.27 b). 1.37 The recent decline in equity markets has moderated previously elevated valuations, bringing them closer to historical average (Chart 1.28 a and b). Alongside, earning projections for 2026 have been revised downwards, except for the smallcap index (Chart 1.28 c). Indian equities, however, continue to trade at a premium compared to their emerging market peers (Chart 1.28 d).
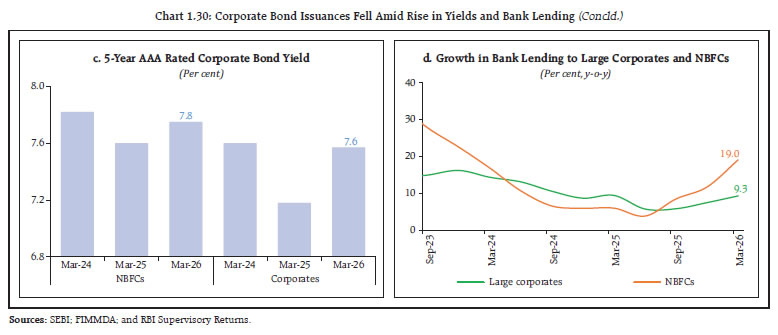
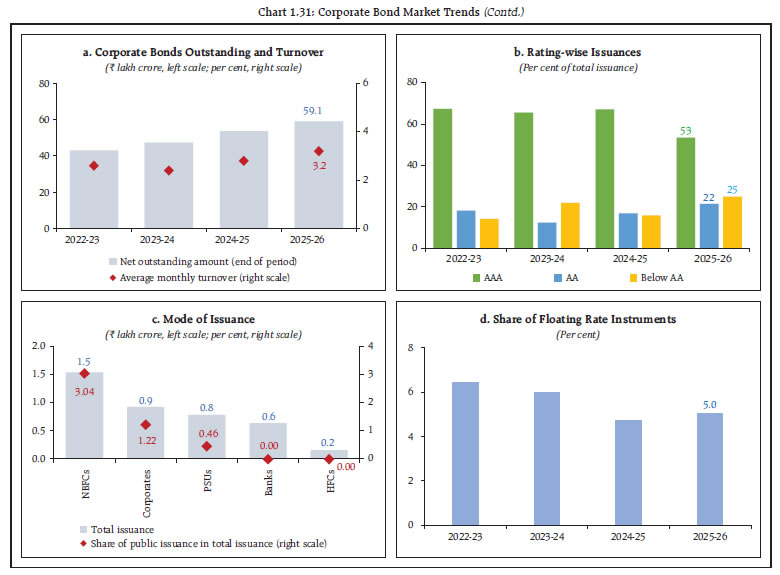
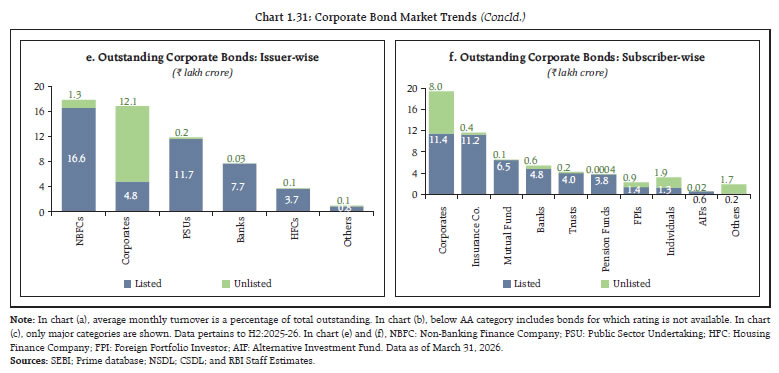
1.38 The recent correction has reduced Nifty 50 returns, reversing earlier gains driven by equity risk premium compression (Chart 1.29 a), as heightened investor risk aversion has pushed risk premia higher (Chart 1.29 b). 1.39 Corporate bond issuances fell in 2025-26, as reflected in issuances through the listed private placement route, compared to the previous year amid general hardening of bond yields. With robust transmission of policy rate to lending rates, large corporates and non-banking financial companies have increasingly accessed bank credit (Chart 1.30 a, b, c and d). 1.40 The outstanding corporate debt expanded to ₹59.1 lakh crore as of end-March 2026; however, despite gains in recent years, average monthly turnover remained subdued at 3.2 per cent in 2025–26 (Chart 1.31 a). There has been a steady decline in the share of AAA-rated borrowers in fresh issuances, reflecting stronger demand for other rating categories. Consequently, the share of below AA-rated issuances rose to 25 per cent in 2025–26 from 14 per cent in 2022-23 (Chart 1.31 b). Private placements continued to be the preferred mode of resource mobilisation, with NBFCs being the only entities showing notable interest in public bond issuances (Chart 1.31 c). The share of floating-rate instruments—primarily linked to money market rates, government securities, and equity benchmarks—has risen (Chart 1.31 d). NBFCs and non-financial corporates continued to be the key fund mobilisers, with corporates, insurance companies and mutual funds serving as the primary investors in listed corporate bonds. In contrast, unlisted bonds were predominantly held by corporates, individuals and others (Chart 1.31 e and f). 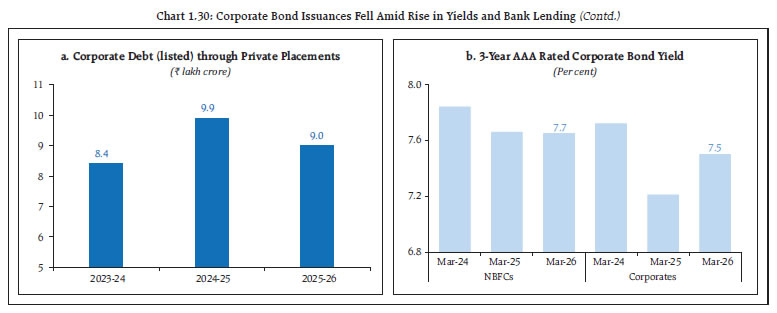
 1.41 Corporate bond spreads have risen across rating categories and tenors, mainly due to increase in credit risk premia reflecting elevated uncertainty (Chart 1.32 a and b). Nonetheless, the credit ratio14 points to an improving credit environment in the corporate segment (Chart 1.32 c).
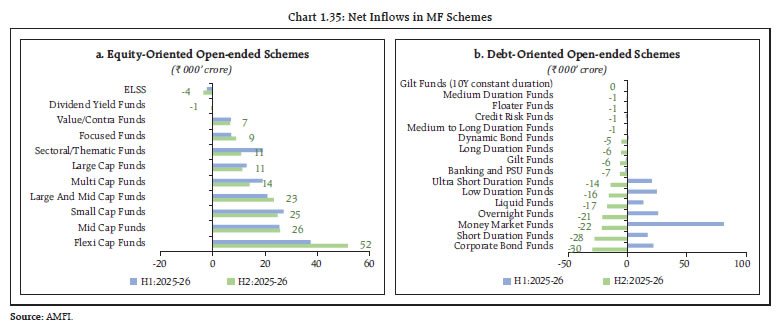
1.42 The assets under management (AUM) of the domestic mutual fund industry increased to ₹81.6 lakh crore, recording a 13.0 per cent y-o-y growth as at end-May 2026. Nonetheless, there has been a significant moderation in the AUM growth (Chart 1.33 a and b). Out of the total AUM, ₹36.2 lakh crore were in equity schemes and ₹45.4 lakh crore in non-equity schemes.15 1.43 Systematic investment plan (SIP) inflows remained stable in 2025-26, with monthly inflows reaching an all-time high of ₹32,086 crore in March 2026 (Chart 1.34). The number of outstanding SIP accounts continued to grow steadily, reflecting sustained retail participation. As of end-May 2026, SIP AUM stood at ₹17.12 lakh crore, accounting for 47.3 per cent of equity-oriented scheme AUM and 20.9 per cent of total domestic mutual fund AUM. 1.44 Net inflows into equity schemes during H2:2025-26 remained broadly stable vis-à-vis H1:2025-26, with a marginal moderation of 0.2 per cent, primarily reflecting lower inflows into sectoral/ thematic funds. Inflows into equity-oriented schemes during the period were majorly driven by flexi-cap, mid-cap and small-cap funds (Chart 1.35 a). In contrast, open-ended debt schemes recorded cumulative net outflows of ₹1.8 lakh crore during H2:2025-26, as against net inflows of ₹2.0 lakh crore in H1:2025-26 (Chart 1.35 b). The shift was driven by redemptions from corporate bond funds, short-duration funds, and money market funds, as well as advance tax-related liquidity pressures at quarter- and year-end in March 2026. 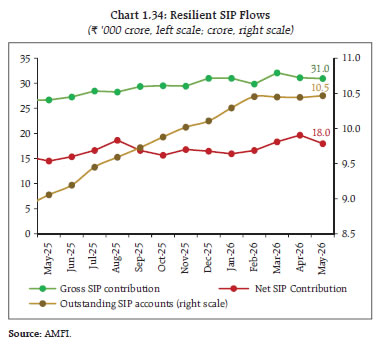
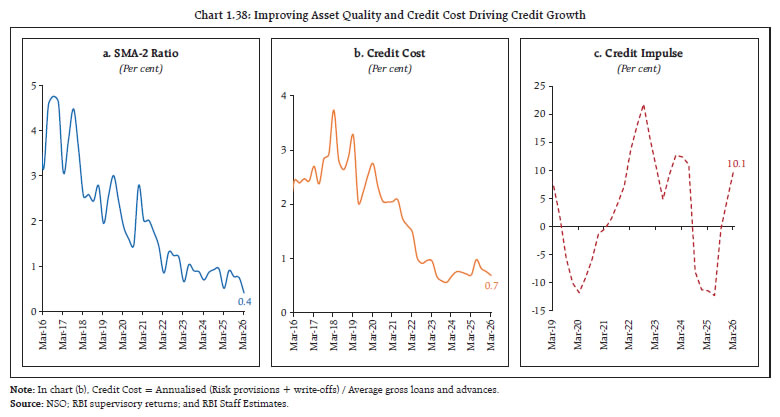
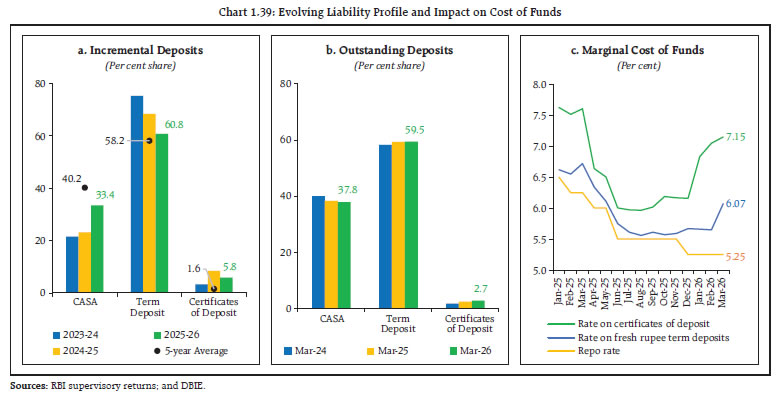
 1.45 Flows to passive funds witnessed a sharp increase during H2:2025-26 with cumulative inflows rising by 109 per cent vis-à-vis H1:2025-26, primarily driven by Gold ETFs. Inflows into Gold ETFs surged by 286 per cent during the period16 (Chart 1.36 a). Consequently, the AUM of Gold ETFs increased sharply to ₹1.7 lakh crore as at end- March 2026, registering a y-o-y growth of around 190 per cent, supported by both valuation gains and sustained fund inflows (Chart 1.36 b). The share of Gold ETFs in overall gold investment demand also increased steadily, reaching 24 per cent of total investment demand in Q1:2026 (Chart 1.36 c). I.2.2 Banking System 1.46 India’s financial system remains bank-centric, and therefore, the resilience of the banking sector is key to ensuring overall financial stability. The banking sector’s health has been constantly improving over the past several years, thereby strengthening financial stability. This is reflected across key metrics, viz., capital and liquidity buffers, profitability, asset quality, and loan-loss provisions (Chart 1.37). Notably, there are no signs of incipient stress as the ratio of SMA-217 accounts and credit costs are declining. The overall strength of banks’ balance sheets is driving credit growth, especially new credit as measured by credit impulse18 (Chart 1.38 a, b and c). 1.47 Even as the banking system’s resilience remains intact, funding is emerging as a key challenge. Banks’ liability profile is shifting from low-cost current and savings account (CASA) to higher-cost term deposits and CDs, pushing up the marginal cost of funds (Chart 1.39 a, b and c). This shift reflects change in investment preferences of savers towards higher-yielding equities and mutual funds, altering the composition of bank deposits that attract higher run-offs.19 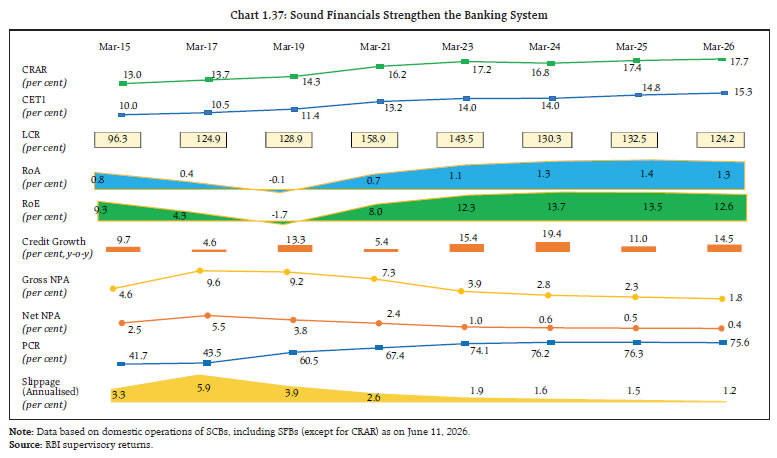
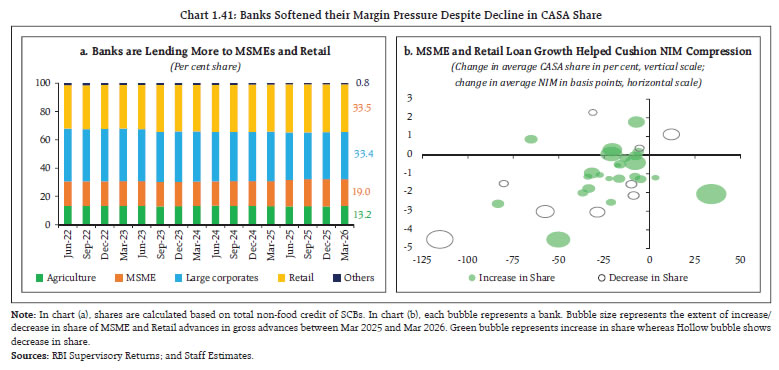
 1.48 Compared to previous cycles, the inverse relationship between CASA deposits’ share and interest rate cycle appears to have weakened (Chart 1.40 a). With the fall in convenience yield on deposits20, banks’ deposit franchise21 is getting affected (Chart 1.40 b). This could weigh on their profitability as competition for household savings intensifies, even as credit demand remains strong (Chart 1.40 c). This is also reflected in banks’ running down their excess SLR investments to fund credit growth, resulting in declining LCR buffers (Chart 1.40 d). The recent measures to boost capital flows, however, are expected to ease funding pressures on banks by improving their access to less-costly Rupee liquidity. 1.49 Banks are expanding credit to higher-yielding segments, such as micro, small, and medium enterprises (MSME) and retail, which is helping to protect their margins (Chart 1.41 a). Banks that meaningfully increased their MSME and retail lending experienced relatively muted pressure on net interest margins, even as CASA shares declined, indicating that higher yields from these segments partly compensated for rising funding costs (Chart 1.41 b). 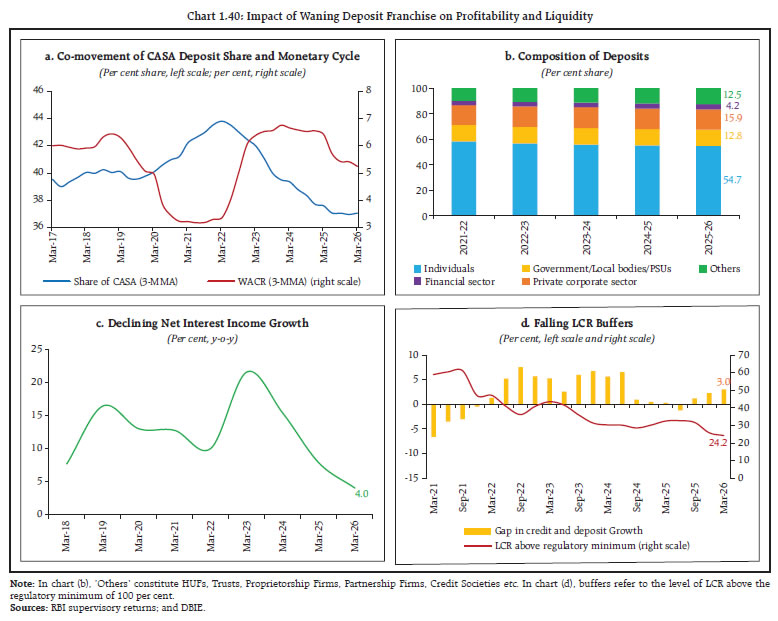
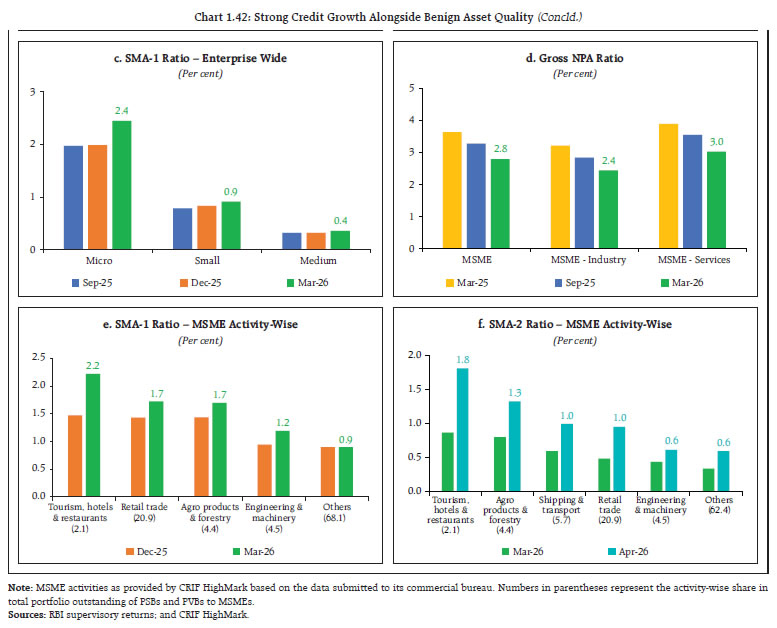
 1.50 Despite above-average loan growth in the MSME and retail sectors, asset quality remains benign (Chart 1.42 a and b). In the MSME segment, while some nascent stress is visible in micro enterprises, the overall gross NPA ratio has shown improvement (Chart 1.42 c and d). This segment, however, remains vulnerable to the impact from the West Asia conflict, although the situation currently appears contained (Chart 1.42 e and f). Similar asset quality trend is seen in the retail segment also with gross NPA ratios in secured and unsecured retail loans at 0.7 per cent and 1.7 per cent, respectively as at end-March 2026. Nonetheless, exposure to these sectors requires close monitoring as risks to asset quality could increase, especially if overall economic conditions weaken due to the West Asia conflict and impact borrower cash flows. 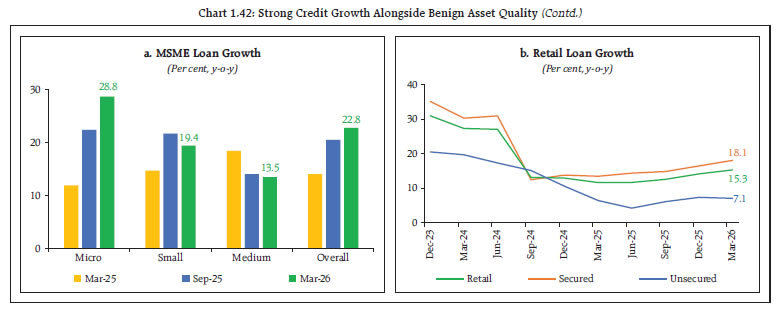
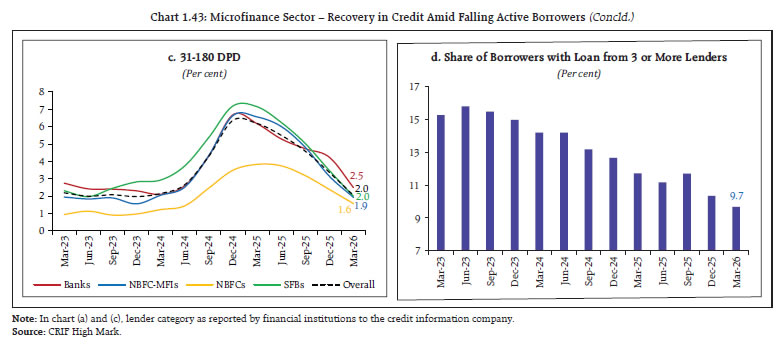
 1.51 Credit to the microfinance sector increased for the first time after seven quarters of decline, but the borrower base continued to shrink, down by 22.7 lakh in the latest quarter (Chart 1.43 a and b). Asset quality showed continued improvement, as the share of 31-180 days past due (dpd) declined for the fifth successive quarter. At the same time, the share of borrowers with loans from three or more lenders fell to 9.7 per cent in March 2026 (Chart 1.43 c and d). 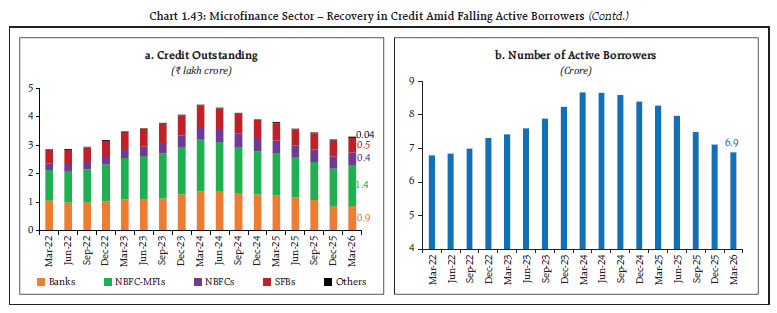
 1.52 Cyber risk is increasingly recognised as a source of financial system vulnerability with the potential to create financial instability. Globally, substantial work is being done to understand systemic threat posed by cyber risk. In this context, a survey was conducted to assess the awareness and preparedness of Indian financial institutions against cyber threats in a challenging landscape. The survey found that while financial institutions have established robust practices in key areas of cyber risk management, AI-enabled cyberattacks emerged as the most important near-term challenge (refer to Box 1.1 on Cyber Risk and Financial Stability). 1.53 Overall risk in the banking sector, as indicated by the Banking Stability Indicator (BSI), has reduced, supported by improvements in all dimensions except liquidity (Chart 1.44 a and b). I.2.3 NBFC Sector 1.54 The NBFC sector22 continued to demonstrate resilience, underpinned by strong capitalisation, solid net interest margins, sustained profitability, and declining levels of asset impairment (Chart 1.45). While overall credit growth moderated, lending to the retail segment remained robust, driven largely by a sharp expansion in gold loan portfolio, that now forms 17.4 per cent of the NBFCs’ retail portfolio. Importantly, credit costs continued to trend downward (Chart 1.46 a, b, c and d).
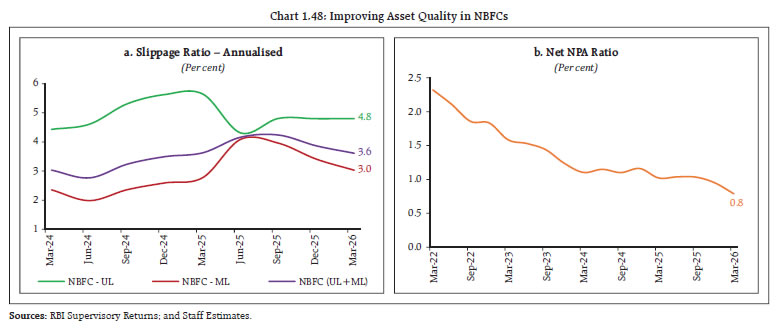
1.55 Increased bank lending to NBFCs has strengthened their liability profile by enhancing stability and reducing costs. Consequently, growth in foreign currency borrowings has eased significantly, even as Rupee depreciation and rising hedging costs made such borrowings less attractive (Chart 1.47 a, b, c and d). 1.56 Asset quality shows signs of improvement, with slippage ratios moderating from earlier peaks, particularly among middle-layer NBFCs (NBFC-ML). However, slippages for upper-layer NBFCs (NBFC-UL) remain relatively elevated, though early signs of stabilisation are visible (Chart 1.48 a). The overall improvement in asset quality is evident from the downward trend in the net NPA ratio, which has reached a low of 0.8 per cent (Chart 1.48 b). 1.57 NBFCs continue to play a critical role in financing MSMEs and microfinance enterprises, supporting financial inclusion and employment. Although NBFCs’ credit growth to MSMEs moderated slightly, it remains robust with improving asset quality (Chart 1.49 a and b). Meanwhile, combined NBFC and NBFC-MFI credit to the microfinance sector—accounting for 56.7 per cent of total credit—expanded by 5.9 per cent in H2:2025–26 (Chart 1.49 c). Asset quality strengthened, with the share of 31–180 dpd declining from 4.4 per cent in September 2025 to 1.8 per cent in March 2026, while credit costs of NBFC-MFIs eased due to lower provisioning and write-offs, though still elevated relative to 4.4 per cent recorded in September 2023. 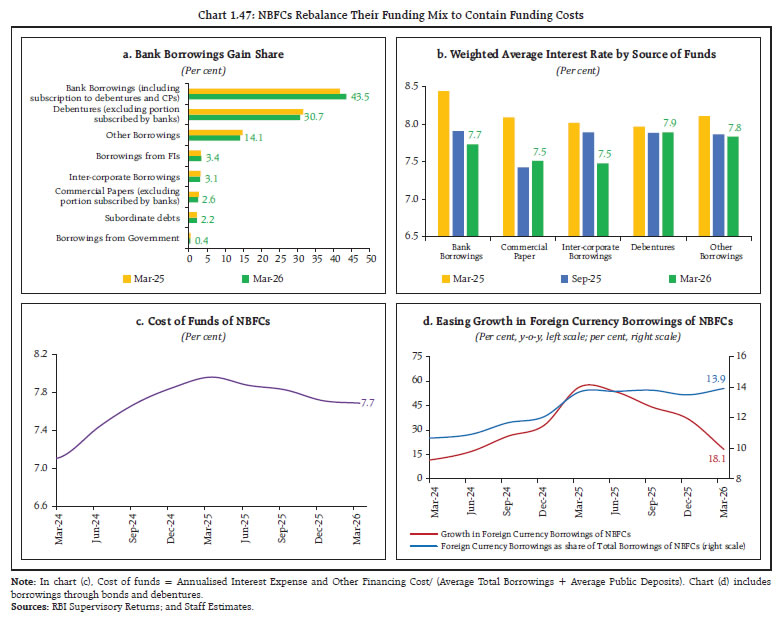
 1.58 Fintech firms23 have strengthened their position in the small-ticket personal loan segment (<₹50,000), with market share increasing to 56.8 per cent by March 2026. This growth has been driven by strong credit expansion of 41.6 per cent, well above the overall segment growth of 20.1 per cent. However, this rapid expansion has been accompanied by rising delinquencies (6.4 per cent), signalling potential asset quality risks (Chart 1.50 a, b and c). Unsecured loans form about 70.5 per cent of their total loan book, and around half of them were extended to borrowers under 35 years of age.24
1.59 Overall risk in the NBFC sector, as indicated by the Non-Banking Stability Indicator (NBSI), saw a moderate increase, reflecting a slight weakening in profitability and liquidity metrics. However, the NBSI remained below its long-term average (Chart 1.51 a and b). I.2.4 Corporate Sector 1.60 Strong balance sheets of the non-financial corporate sector, along with those of financial institutions, have been a key pillar of domestic financial stability. The private non-financial corporate sector maintained robust performance in Q4:2025–26, supported by higher sales growth and stable operating margins (Chart 1.52 a and b).
1.61 Debt serviceability, as measured by the interest coverage ratio (ICR), a key indicator of corporate sector vulnerability, has continued to improve. Supported by a stronger sequential increase in gross profits relative to interest expenses, the ICR rose to 6.5 in Q4:2025-26 (Chart 1.53 a). At the aggregate level, the share of vulnerable firms (ICR < 1) increased during the quarter (Chart 1.53 b), while the debt service ratio remained below the long-term average (Chart 1.53 c). 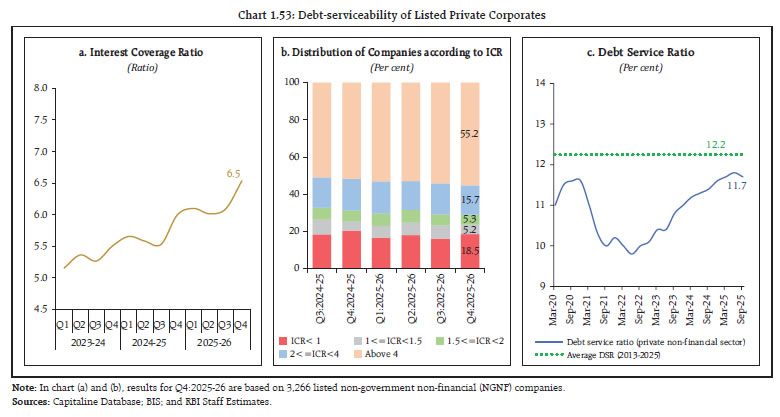
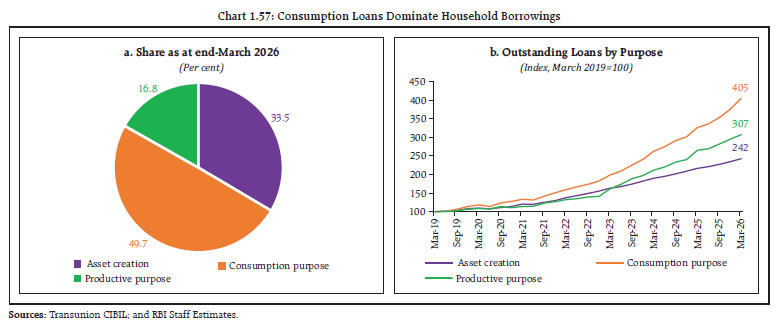
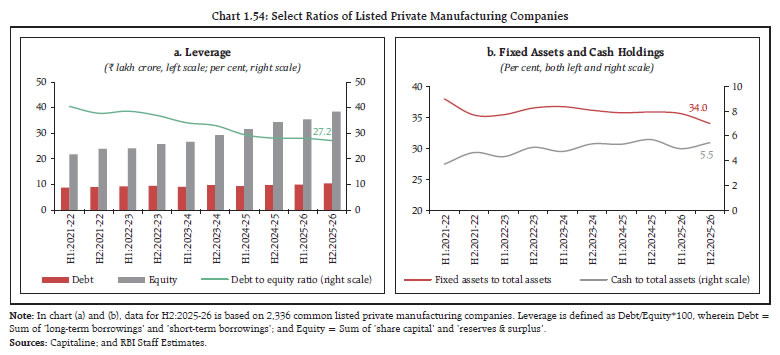 1.62 Balance sheet analysis of listed private manufacturing companies25 indicates that leverage, measured by the debt-to-equity ratio, continued to decline in H2:2025–26 (Chart 1.54 a). Fixed assets growth moderated to 5.2 per cent in H2:2025-26 from 10.3 per cent in H1:2025-26, largely due to weaker growth in non-ferrous metals, chemicals, cement, and automobile industries, which together accounted for 34.1 per cent of total fixed assets. The fixed assets-to-total assets ratio declined, while the share of cash holdings in total assets increased during the period (Chart 1.54 b). 1.63 Private corporate investment remains subdued as reflected in the moderation in the investment to GDP ratio. Capacity utilisation, however, remains elevated and above its long-term average of 74.0 per cent (Chart 1.55 a and b) with robust credit flows from banks and non-banks providing continued support to corporate investment. Nonetheless, firms are navigating an uncertain business environment amid repeated exogenous supply shocks. I.2.5 Household Sector 1.64 Household sector’s debt continues to trend upward, reaching 45.5 per cent of GDP by end- September 2025 (Chart 1.56 a and b). The increase has been driven primarily by non-housing retail loans, which constitute 58.4 per cent of total borrowings as of March 2026 (Chart 1.56 c). Their share has increased steadily over time, consistently outpacing housing loans as well as agriculture and business loans (Chart 1.56 d). 1.65 In terms of broad categories, viz., loans taken for consumption purposes26, asset creation27, and productive purposes28, those availed for consumption purposes account for nearly half of total household borrowings (Chart 1.57 a). Consumption-related loans remained the primary driver of household borrowings, followed by loans for productive purposes, whereas borrowing for asset creation expanded at a relatively slower pace (Chart 1.57 b). 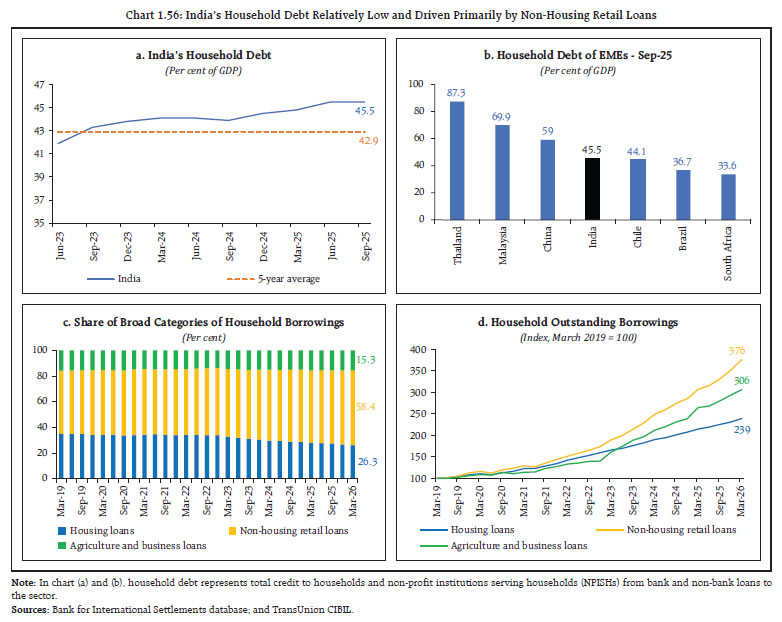
 1.66 There has been a notable shift in banks’ housing loan portfolios over time. Previously, outstanding loans below ₹25 lakh credit limit dominated (60.6 per cent of total housing loan outstanding as of March 2014), reflecting a focus on affordable housing. In recent years, loan distribution has moved toward higher-value segments, with the share of ₹50 lakh and above credit limits now accounting for 44.7 per cent of outstanding loans (Chart 1.58 a and b). Notably, non-performing housing loans remain low for banks and have declined from pre-COVID levels, falling to 0.5 per cent in March 2026 from 1.2 per cent in March 2019.29 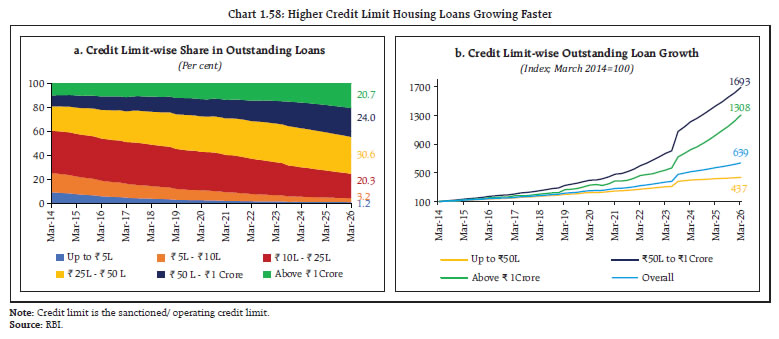
| Table 1.3: Personal Loans - Score Migration for Risk Categories | | (Per cent) | | | Subprime | Near Prime | Prime | Prime Plus | Super Prime | Score Tier Downgrade | Score Tier Upgrade | | Live Borrowers - Score Movement (March 2024 to March 2025) | | | | Risk Tier March 2025 | | | | | Subprime | 79.0 | 13.8 | 5.6 | 1.4 | 0.3 | | 21.0 | | | Near Prime | 22.2 | 31.9 | 33.7 | 11.5 | 0.8 | 22.2 | 45.9 | | Risk Tier March 2024 | Prime | 9.5 | 15.4 | 45.0 | 28.8 | 1.3 | 24.9 | 30.1 | | | Prime Plus | 4.3 | 8.7 | 24.4 | 57.3 | 5.3 | 37.4 | 5.3 | | | Super Prime | 2.1 | 6.9 | 18.4 | 27.4 | 45.2 | 54.8 | | | Live Borrowers - Score Movement (March 2025 to March 2026) | | | | Risk Tier March 2026 | | | | | Subprime | 76.8 | 14.6 | 6.5 | 1.7 | 0.3 | | 23.2 | | | Near Prime | 18.3 | 31.7 | 35.7 | 13.2 | 1.1 | 18.3 | 50.0 | | Risk Tier March 2025 | Prime | 7.3 | 13.9 | 46.9 | 30.6 | 1.4 | 21.2 | 31.9 | | | Prime Plus | 3.3 | 7.4 | 24.7 | 59.3 | 5.3 | 35.4 | 5.3 | | | Super Prime | 1.6 | 5.9 | 17.8 | 27.3 | 47.3 | 52.7 | | | Sources: Transunion CIBIL; and RBI Staff Estimates. | 1.67 Among unsecured retail loans, personal loans dominated consumption-related loans. The risk tier30 migration matrix indicates that a larger share of prime and above borrowers retained their risk categories in 2025-26 compared to 2024-25. While near-prime and prime borrowers saw more upgrades, prime-plus and super-prime borrowers experienced a higher share of downgrades, though they remained mostly within the prime and above categories (Table 1.3). Additionally, an income-level survey of ten SCBs suggests that borrower-side vulnerabilities remain contained with broad-based improvement in asset quality across income brackets and risk categories (refer to Box 1.2 on Borrower Resilience – Income Level Analysis). 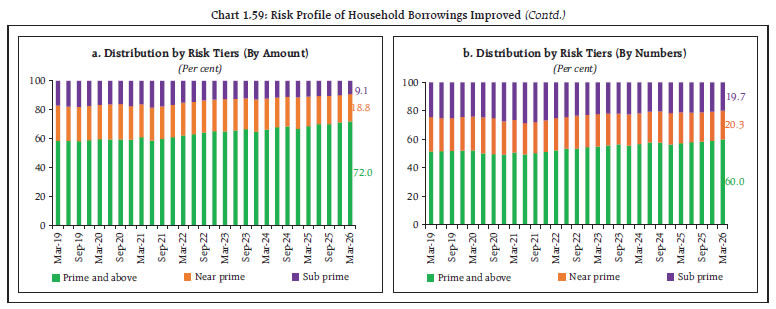
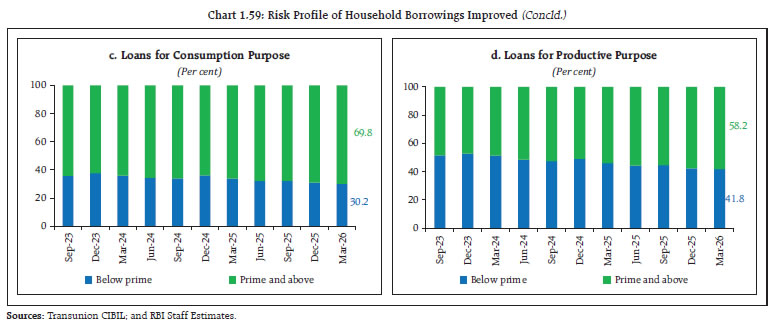 1.68 Overall, despite the rise in household borrowings, borrower profiles have continued to improve. The share of higher-rated borrowers (prime and above) has increased both in terms of outstanding amounts and number of borrowers (Chart 1.59 a and b). This improvement is evident across both consumption and productive loans, with a growing share of prime and above borrowers in total outstanding credit (Chart 1.59 c and d). I.2.6 Consumer Credit Segment 1.69 Consumer segment loans continued to be a key driver of credit growth across banks and NBFCs, expanding at a faster pace than overall advances. Among SCBs, PSBs exhibited stronger growth momentum compared to PVBs (Chart 1.60 a and b). Both enquiry volumes and the growth of credit-active consumers remain robust (Chart 1.60 c and d). 1.70 Asset quality in the consumer lending segment continued to improve across lender categories and loan products, as reflected in the moderation of non-performing loans (Chart 1.61 a and b). Slippages from SMA-2 accounts declined at a faster pace, while loan upgradations continued to increase gradually (Chart 1.61 c). Moreover, the high proportion of prime and above-rated borrowers further strengthens the credit outlook for the segment (Chart 1.61 d).
1.71 Gold loans have emerged as the largest segment within non-housing retail loans, growing at a CAGR of 42.4 per cent since March 2024 - nearly twice the pace of overall non-housing retail loans (CAGR of 23.0 per cent) during the same period (Chart 1.62 a and b). Both banks and NBFCs have significantly expanded their gold loan portfolios in 2025–26, outpacing growth in other retail loan categories, including housing loans. This trend has been supported by a sharp increase in gold prices (Chart 1.62 c and d). 1.72 The recent increase in gold loans is driven primarily by existing borrowers, who are using higher gold prices to secure larger loans and roll over existing debt, as indicated by the gap between fresh originations and loan outstanding (Chart 1.63 a and b). This is particularly visible in NBFC loan originations, which have far exceeded those by public and private sector banks (Chart 1.63 c).
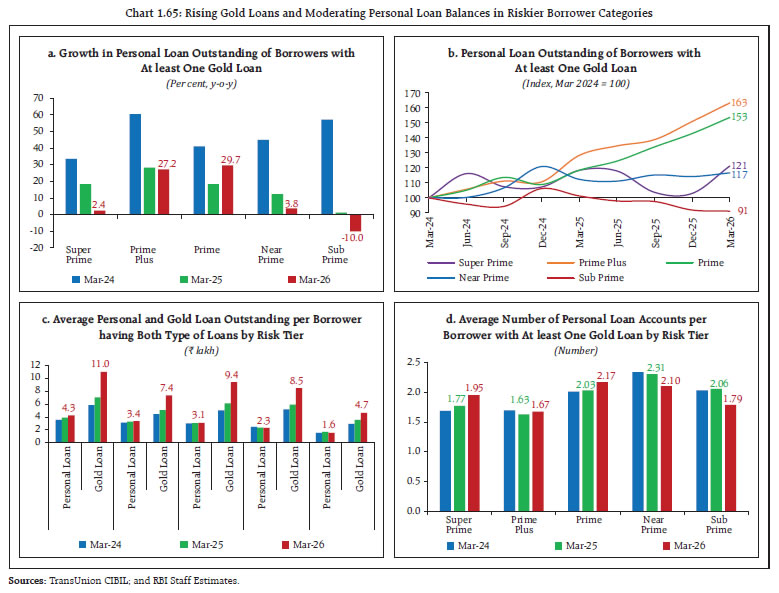
1.73 Gold loans are subject to a loan-to-value (LTV) cap between 75 per cent and 85 per cent based on the amount of gold loan borrowed31. Notably, LTV ratios across banks and NBFCs have declined despite strong growth in gold loans, supported by rising gold prices (Chart 1.64 a and b). This has strengthened collateral buffers and provided lenders with a larger cushion against adverse movements in gold prices. 1.74 The rapid growth in gold loans has coincided with a moderation in the growth of outstanding personal loans for borrowers who have both personal loans and gold loans. This trend is particularly pronounced among sub-prime borrowers, whose outstanding personal loan balances and loan accounts have declined (Chart 1.65 a, b, c and d). 1.75 Overall, while asset impairment risks remain contained and LTV ratios provide a comfortable cushion, the rapid growth in lending against gold collateral amid elevated gold price volatility merits continued vigilance. A prolonged correction in gold prices could weaken collateral protection, increase borrower stress, and result in higher delinquencies. 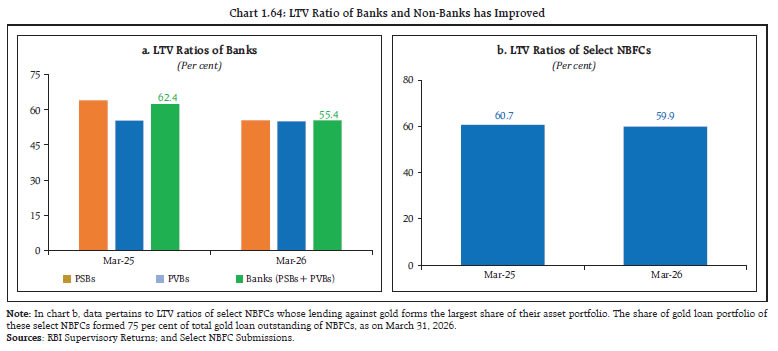
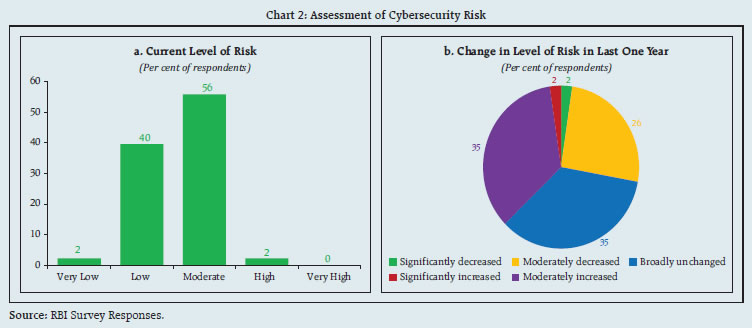
Box 1.1: Cyber Risk and Financial Stability Cyber risk has become a key financial stability concern in an increasingly digital and interconnected financial system. Cyber incidents can disrupt critical financial infrastructure through service outages, data loss, and payment system interruptions, while also eroding public trust in the financial system. The rapid adoption of digital financial services in recent years has expanded the attack surface for malicious actors, contributing to a global rise in cyberattacks since 2020. India remains exposed to these risks, with a relatively high volume of cyberattacks compared to other emerging market economies (Chart 1 a and b). Against this backdrop of increasing digitalisation and rising cyber threats, to evaluate cyber risk preparedness, a survey of major Indian banks and NBFCs was conducted.32 While 79 per cent of respondents reported that over three-fourths of customer transactions are conducted digitally, institutions generally viewed their cyber risk exposure as manageable, with 98 per cent rating current risk levels as very low to moderate (Chart 2 a), suggesting confidence in the adequacy of their existing risk management frameworks. This assessment is consistent with operational outcomes, as institutions reported minimal disruption to critical customer services during 2025–26, and incidents that did occur were largely contained within 24 hours. Nearly one-third of respondents reported a moderate or significant increase in cyber risk compared to a year earlier, highlighting the increasing uncertainty due to a challenging threat environment (Chart 2 b). The evolving cyber threat landscape necessitates continuous investment in technological and cybersecurity capabilities. As per the survey, 81 per cent of respondents reported IT expenditure of less than 5 per cent of revenue during 2025-26. The reported IT expenditure ratios may, however, vary across entities depending on, inter alia, business model, group-level technology arrangements, technology sourcing/ outsourcing model, and timing of major technology investments. Nonetheless, there are signs of strengthening cyber preparedness, as reflected in rising investments in human capital and cybersecurity infrastructure. Between March 2025 and March 2026, around 67 per cent of respondents reported an increase in IT and cybersecurity staffing. Furthermore, the cybersecurity expenditure as a share of IT expenditure has increased for 71 per cent of the respondents in the last three financial years. In this regard, the international benchmarks relating to overall IT budget, including cybersecurity, may serve as an important yardstick. 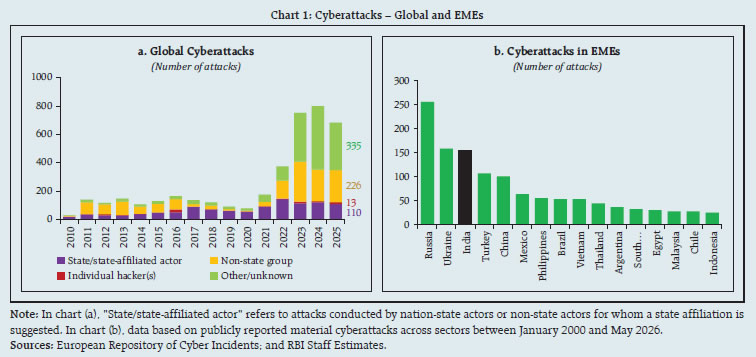
 AI-enabled cyber threats emerged as the leading perceived risk over the next 12 months (Chart 3 a). Rapid advances in AI can increase the sophistication, speed and scale of cyber incidents. Survey responses indicate that AI-enabled threat preparedness is at varying stages of formalisation and implementation within their existing cyber risk management frameworks. Most respondents classified themselves in the ‘Developing’ or ‘Intermediate’ stages, while a smaller share reported in ‘Mature’ stage (Chart 3 b). This may be viewed in the context of AI-enabled cyber threats being an evolving risk area, where continued, risk-based strengthening of preparedness measures would be expected, building on entities’ existing cyber security control frameworks. Accordingly, continued strengthening of threat monitoring, detection, response, employee awareness, incident readiness and resilience capabilities under regulatory guidance would remain important. In this regard, regulatory harmonisation across the financial sector will be crucial. 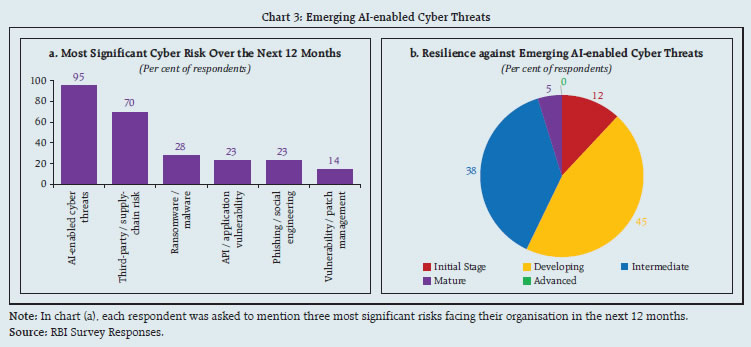 Third-party dependency and supply chain risk was ranked as the second most important cyber risk in the survey. 93 per cent of respondents are partially or substantially dependent on external vendors for cybersecurity-related functions such as security operations center (SOC) monitoring, cloud security, incident response, threat intelligence, vulnerability assessments, etc. (Chart 4 a). Moreover, operational dependence on third-party technology service providers for critical applications is moderate to very high for three-fourths of the respondents (Chart 4 b). The increasing reliance on outsourcing introduces supply chain risk, especially where a limited number of service providers support multiple financial institutions simultaneously. A major cyber incident affecting any such provider could propagate rapidly across regulated entities, amplifying operational disruptions and posing risks to financial stability. Closely linked to third-party risks are challenges related to technology obsolescence and patch management. Survey findings suggest that Indian financial institutions are proactively managing technology life-cycle risks. Across key risk categories, including unsupported or end-oflife systems, systems awaiting major upgrades, and systems unable to receive vendor security patches, 93 per cent of respondents reported either no or low exposure in their critical services and applications. This reflects a strong foundation for operational resilience, although continued vigilance remains essential given the rapid emergence of new vulnerabilities.
Geopolitical tensions can heighten cyber risk concerns and reinforce the need for vigilance against evolving threat activity. Reflecting this concern, 42 per cent of surveyed institutions indicated that geopolitical uncertainty has increased the likelihood of cyberattacks (Chart 5). Overall, the survey finds that financial institutions have established robust practices in key areas of cyber risk management, particularly vulnerability assessment and penetration testing of critical information systems. Processes relating to regulatory reporting and board-level reporting of significant cyber incidents have also matured. However, cybersecurity awareness and training for employees remain areas which require further strengthening given that human behavior is among the most exploited entry points for cyberattacks. Similarly, forensic preparedness also needs improvement to strengthen incident response capabilities, preserve digital evidence, and facilitate regulatory and law enforcement investigations in the event of sophisticated cyberattacks. |
Box 1.2: Borrower Resilience – Income Level Analysis A key objective of macroprudential policy is to build borrower resilience to adverse events. In many countries, borrower-based tools such as loan-to-value (LTV) and/or debt-to-income (DTI) ratios are used to prevent buildup of borrowerside vulnerabilities. Demand for unsecured personal loans has been growing over the years and in the past has warranted regulatory interventions to curb excessive growth in the segment. Although credit growth has moderated following these measures, the unsecured nature of such loans continues to pose a source of borrower vulnerability. Against this backdrop, surveys were conducted to collect granular income-level data on unsecured personal loan (PL) originations and fresh non-performing assets (NPAs) from these segments33. The survey spans nine quarters from Q3:2023-24 to Q3:2025-26, across five income buckets— below ₹5 lakh, ₹5–10 lakh, ₹10–15 lakh, >= ₹15 lakh and income-not-available—and six credit risk tiers34. The survey provided important insights into income cohorts and rating categories that dominate loan originations and loan impairments35. 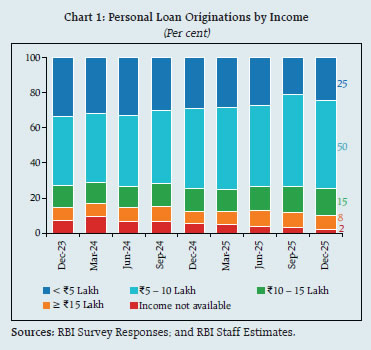 As the charts below show, in terms of income distribution, the ₹5–10 lakh and <₹5 lakh income cohorts, and in terms of risk-tier distribution, prime and prime plus rating categories, dominate loan originations accounting for around three-fourths of loan originations (Charts 1 and 2). Notably, the share of below ₹5 lakh segment is showing a declining trend. Furthermore, decomposition of risk tiers and income levels for Q3:2025-26 shows concentration of exposure in the below ₹10 lakh income cohort and in the prime and prime plus risk tiers (Table 1). Like loan originations, loan impairments are also concentrated in the below ₹10 lakh income cohort (Chart 3). Nonetheless, defaults remain contained and are declining across rating categories with improvement most visible in the Sub-Prime and Near Prime segments (Table 2).
| Table-1: Decomposition of PL Originations - Risk Tier and Income Level for Q3:2025-26 | | (Per cent share) | | | Super Prime | Prime Plus | Prime | Near Prime | Sub-Prime | New to Credit (NTC) | | < ₹5 Lakh | 2 | 10 | 9 | 2 | 0 | 1 | | ₹5–10 Lakh | 5 | 24 | 17 | 4 | 0 | 1 | | ₹10–15 Lakh | 2 | 7 | 5 | 1 | 0 | 0 | | ≥ ₹15 Lakh | 2 | 3 | 3 | 0 | 0 | 0 | | Income Not Available | 0 | 1 | 1 | 0 | 0 | 0 | | Sources: RBI Survey Responses; and RBI Staff Estimates. | An analysis combining income cohorts and risk-tiers indicates that prime-plus borrowers in the ₹5–10 lakh income bucket were the primary contributors to growth in personal loan originations, while sub-prime and new-to-credit (NTC) borrowers recorded relatively lower growth. Asset quality has improved broadly, with fresh NPAs declining across risk-tiers. Consistent with origination trends, prime-plus borrowers in the ₹5–10 lakh income segment also accounted for the largest increase of fresh NPAs (Charts 4 a and b). To study bank-level heterogeneity, violin plots36 were constructed that show the full distribution of y-o-y growth rates reported by all surveyed banks across all income buckets as well as risk tiers. The plot shows overall improvement in origination quality with some divergence among individual banks across risk tiers and income buckets (Charts 5 a and b). | Table 2: One-Year Default Rates across Risk Categories | | (Per cent) | | | Dec-24 | Mar-25 | Jun-25 | Sep-25 | Dec-25 | | Super Prime | 0.16 | 0.12 | 0.14 | 0.12 | 0.11 | | Prime Plus | 0.27 | 0.26 | 0.28 | 0.24 | 0.22 | | Prime | 0.58 | 0.51 | 0.51 | 0.43 | 0.41 | | Near Prime | 0.78 | 0.77 | 0.86 | 0.60 | 0.55 | | Sub-Prime | 1.85 | 2.86 | 3.58 | 2.05 | 1.01 | | NTC | 0.42 | 0.41 | 0.48 | 0.33 | 0.35 | | Overall | 0.51 | 0.49 | 0.56 | 0.41 | 0.35 | Note: The risk tier-wise one-year default rate considered here, is the proportion of personal loan originations in a given period that have defaulted after one year of disbursement.
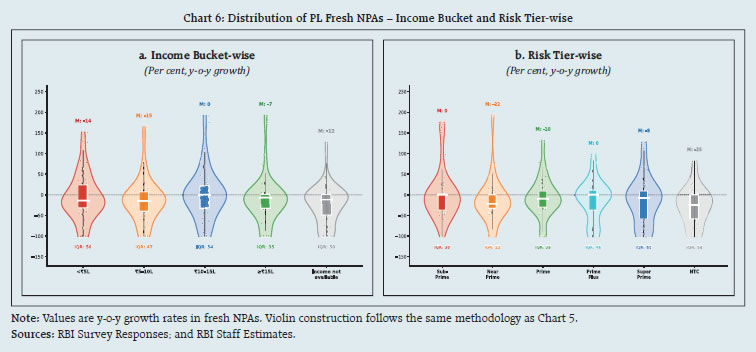
Sources: RBI Survey Responses; and RBI Staff Estimates. | 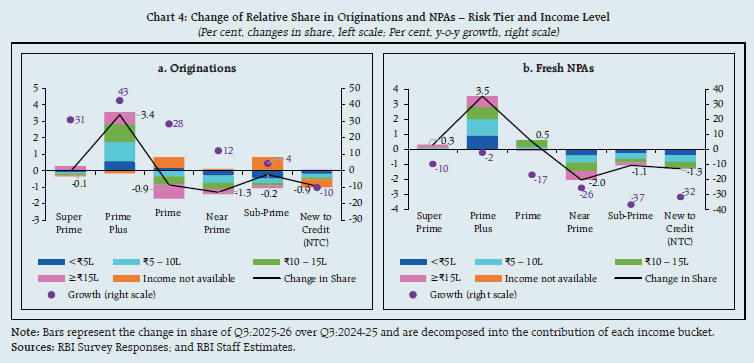 On the other hand, in terms of asset impairment, all income and risk tier buckets show negative medians, confirming that fresh NPA growth is declining. However, the elongated violins in the below ₹5 lakh (IQR37: 56) and ₹5–10 lakh (IQR: 47) segments reveal high bank-to-bank heterogeneity. Overall, even as the aggregate asset quality is improving, there are residual pockets of stress among individual banks across tiers (Charts 6 a and b). 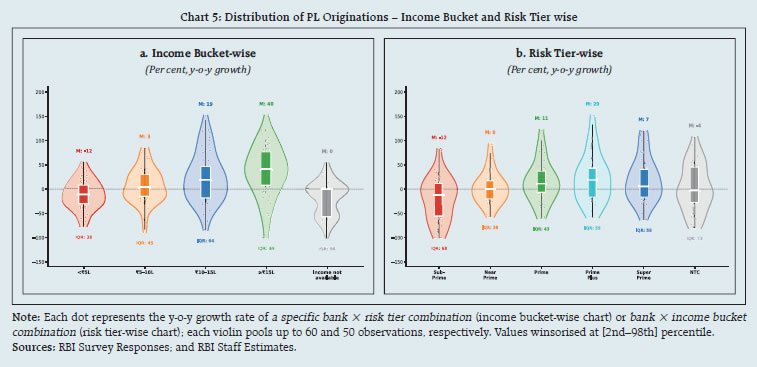
 Overall, banks have reoriented personal loan growth toward borrowers with stronger income profiles and better credit quality, with the ₹5–10 lakh income cohort emerging as the dominant source of originations. In contrast, the below ₹5 lakh segment has witnessed a sharp decline in share. Asset quality has improved broadly, reflected in lower fresh NPA formation across income and risk categories. However, the lower-income segment continues to generate a disproportionately large share of fresh NPAs relative to its contribution to new lending. While the aggregate picture remains positive, performance varies across individual banks and borrower cohorts. |
|