The weakness in the external sector observed in 2011-12 continued during the first quarter of
2012-13, mainly reflecting uncertainty in global economic and financial conditions coupled
with weak domestic macroeconomic conditions. The rupee witnessed renewed pressures and
depreciated against the US dollar in Q1 of 2012-13, in line with the trend registered by major
EDE currencies. Capital flows have remained subdued and volatile. Notwithstanding various
policy measures initiated by the Reserve Bank, significant depreciation of the rupee, softening
commodity prices and moderation in gold imports, improvement in the trade deficit will
continue to hinge upon global macroeconomic conditions and therefore, upside risks remain.
With services exports likely to decelerate during 2012-13, the risks of CAD going above its
sustainable rate, and difficulties in financing it, persist.
Global factors continue to weigh on
India’s exports
III.1 India’s merchandise exports, which had
decelerated in 2011-12, contracted in Q1 of
2012-13 mainly reflecting subdued demand
conditions in key global markets, particularly
the EU and the US (Table III.1). In particular,
exports of engineering goods, petroleum
products, gems and jewellery and readymade
garments have been affected. Evidently the
significant depreciation in the rupee since H2
of 2011-12 could not sufficiently offset the
impact of the slowdown in global demand. In recent years, due to export diversification
efforts, the share of developing economies in
India’s total exports witnessed a gradual
increase. However, as the sluggish economic
conditions in advanced economies (AEs) slowly
spilled over to other emerging and developing
economies (EDEs), diversification did not yield
results similar to those seen in previous years.
Going forward, economic conditions especially
in EU are likely to remain muted for some time.
As a result, growth in global trade volume,
including exports from EDEs, is likely to be
lower in 2012. Indian exports are likely to reflect
this general trend.
Table III.1: India’s Merchandise Trade |
(US$ billion) |
Item |
April-March |
April-June |
2010-11 R |
2011-12 P |
2011-12 R |
2012-13 P |
Value |
Growth
(%) |
Value |
Growth
(%) |
Value |
Growth
(%) |
Value |
Growth
(%) |
1 |
2 |
3 |
4 |
5 |
6 |
7 |
8 |
9 |
Exports |
251.1 |
40.5 |
304.6 |
21.3 |
76.5 |
36.4 |
75.2 |
–1.7 |
Of which: Oil |
41.5 |
47.1 |
55.6 |
34.0 |
15.3 |
76.2 |
12.9 |
–15.6 |
Non-oil |
209.7 |
39.3 |
249.0 |
18.8 |
61.2 |
29.1 |
62.3 |
1.8 |
Imports |
369.8 |
28.2 |
489.4 |
32.4 |
122.7 |
36.3 |
115.3 |
–6.1 |
Of which : Oil |
106.0 |
21.6 |
154.9 |
46.2 |
39.4 |
52.5 |
41.5 |
5.3 |
Non-oil |
263.8 |
31.1 |
334.5 |
26.8 |
83.3 |
29.7 |
73.8 |
–11.5 |
Gold |
40.5 |
41.6 |
56.2 |
38.8 |
16.1 |
109.1 |
8.5 |
–47.5 |
Non-Oil Non-Gold |
223.3 |
29.3 |
278.3 |
24.6 |
67.2 |
18.9 |
65.3 |
–2.9 |
Trade Deficit |
–118.6 |
|
–184.8 |
|
–46.2 |
|
–40.1 |
|
Of which: Oil |
–64.5 |
|
–99.3 |
|
–24.1 |
|
–28.6 |
|
Non-oil |
–54.1 |
|
–85.5 |
|
–22.1 |
|
–11.5 |
|
R: Revised. P: Provisional.
Source: DGCI&S. |
Softening of international commodity
prices narrowed the trade deficit
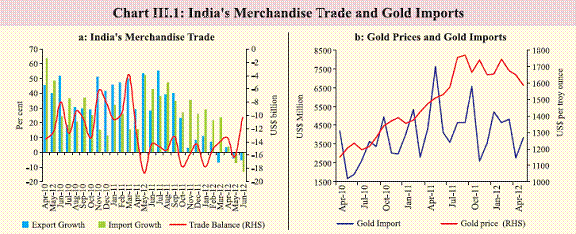
III.2 The weakness in India’s external
position in 2011-12 stemmed partly from the
import-induced surge in the current account
deficit (CAD). Given the inelastic nature of
India’s imports of petroleum, oil and lubricants
(POL) and gold, the rise in international prices
of these commodities led to overall high
imports. This trend, however, reversed in Q1 of
2012-13. The decline in imports in the quarter
was sharper than that in exports (Chart III.1a).
Import moderation was mainly on account of a
modest contraction in POL imports and a
significant contraction in gold and silver
imports. The lower growth in POL reflects the
softening of international crude oil prices, while
the decline in gold and silver imports appears
to reflect the impact of policy measures taken
in January and March 2012 (Chart III.1b).
Growth moderation in non-oil imports in recent
months appears to be on account of confluence
of various factors, viz., domestic slowdown,
global uncertainty, moderation in global
commodity prices and the possible impact of
rupee depreciation in some sectors. As a result,
the trade deficit narrowed somewhat in Q1 of
2012-13 compared with the corresponding
period of the previous year.
 Upside risks to trade deficit persist
III.3 Recent trend of faster deceleration in
imports than exports has given rise to the
possibility that CAD could improve in 2012-13.
However, current assessment suggests that such
improvement could be insufficient to ensure
CAD sustainability. The upside risk to CAD
remain significant. The response of exports to
depreciation of rupee has so far remained muted
due to subdued global demand. Downside risks
to export growth are large in view of worsening
global conditions. Exchange rate sensitivity of
India’s import is also limited.
Slowdown in global IT spending may
dampen growth in software exports
III.4 Despite the challenges in global market
conditions, services exports, in general and
software exports in particular sustained the
growth momentum in 2011-12 (Table III.2). However, net services exports earnings at US$14 billion in Q1 of 2012-13, have declined by about 12 per cent y-o-y, suggesting loss of momentum. Services exports in gross terms expanded by 3 per cent, while imports increased by 19 per cent in this quarter.
Going forward, NASSCOM projection of 11-14
per cent growth in software exports in 2012-13,
suggests deceleration. Current indications,
borne out by dollar revenue guidance of IT
majors, suggest that software export earnings
may even be lower than projected by NASSCOM.
The risk of lower software exports may arise
from reduced spending on technology by US
corporations, continued uncertainty in the euro
area countries and likely euro depreciation. As software exports account for nearly 63 per cent
of net receipts of invisibles, any deceleration in
these exports may aggravate the already high
CAD recorded in recent quarters.
Table III.2: Major Items of India’s Balance of Payments |
(US$ billion) |
| |
2010-11
(PR) |
2011-12
(P) |
2011-12 |
2010-11
Q4 (PR) |
Q1 (PR) |
Q2 (PR) |
Q3 (PR) |
Q4 (P) |
1 |
2 |
3 |
4 |
5 |
6 |
7 |
8 |
1. Goods Exports |
250.6 |
309.8 |
78.8 |
79.6 |
71.5 |
80.0 |
77.4 |
2. Goods Imports |
381.1 |
499.5 |
123.7 |
124.1 |
120.1 |
131.7 |
107.4 |
3. Trade Balance (1–2) |
–130.5 |
–189.7 |
–44.9 |
–44.5 |
–48.6 |
–51.7 |
–30.0 |
4. Services Exports |
131.7 |
140.9 |
33.7 |
32.3 |
37.3 |
37.7 |
35.3 |
5. Services Imports |
83.0 |
76.9 |
17.4 |
18.3 |
21.1 |
20.0 |
20.7 |
6. Net Services (4–5) |
48.7 |
64.0 |
16.3 |
14.0 |
16.2 |
17.7 |
14.6 |
7. Goods & Services Balances (3+6) |
–81.8 |
–125.7 |
–28.6 |
–30.5 |
–32.4 |
–34.0 |
–15.4 |
8. Primary Income (Net) |
–17.3 |
–16.0 |
–3.6 |
–4.0 |
–3.8 |
–4.6 |
–4.5 |
9. Secondary Income (Net) |
53.1 |
63.5 |
14.8 |
15.6 |
16.2 |
16.9 |
13.6 |
10. Net Income (8+9) |
35.8 |
47.5 |
11.2 |
11.6 |
12.4 |
12.3 |
9.1 |
11. Current Account Balance (7+10) |
–46.0 |
–78.2 |
–17.4 |
–18.9 |
–20.2 |
–21.7 |
–6.3 |
12. Capital Account Balance |
0.04 |
–0.1 |
–0.3 |
0.2 |
0.1 |
–0.2 |
–0.02 |
13. Financial Account Balance |
48.9 |
80.7 |
18.7 |
19.0 |
20.6 |
22.4 |
7.1 |
of which: Change in Reserves (increase-/decrease+) |
–13.1 |
12.8 |
–5.4 |
–0.3 |
12.8 |
5.7 |
–2.0 |
14. Errors & Omissions (-) (11+12+13) |
–3.0 |
–2.4 |
–0.9 |
–0.4 |
–0.5 |
–0.6 |
–0.8 |
Memo: As ratio to GDP |
|
|
|
|
|
|
|
15. Trade Balance |
–7.7 |
–10.3 |
–9.8 |
–9.9 |
–10.7 |
–10.6 |
–6.2 |
16. Net Services |
2.9 |
3.5 |
3.6 |
3.1 |
3.5 |
3.6 |
3.0 |
17. Net Income |
2.1 |
2.6 |
2.4 |
2.6 |
2.7 |
2.5 |
1.9 |
18. Current Account Balance |
–2.7 |
–4.2 |
–3.8 |
–4.2 |
–4.4 |
–4.5 |
–1.3 |
19. Capital and Financial Account, Net (Excl. changes in reserves) |
3.7 |
3.7 |
5.2 |
4.4 |
1.7 |
3.4 |
1.9 |
P: Preliminary; PR: Partially Revised
Note: Total of subcomponents may not tally with aggregate due to rounding off. |
Capital flows may remain volatile due to
global uncertainties
III.5 The exacerbation in CAD during 2011-12 led to depletion of reserves notwithstanding
improved capital flows (Table III.3). Since Q1
of 2012-13, concerns about the growth and
financial health of euro area countries have
further intensified. In addition, signs of
weakness in the US and China have also made
investors more cautious and driven up global
financial market volatility. These factors,
combined with weakening domestic
macroeconomic conditions, led to a net FII
outflow of US$ 1.7 billion in Q1 of 2012-13.
Table III.3: Disaggregated Items of Financial Account |
(US$ billion) |
| |
2010-11 (PR) |
2011-12 (P) |
2011-12 |
2010-11
Q4 (PR) |
Q1 (PR) |
Q2 (PR) |
Q3 (PR) |
Q4 (P) |
1 |
2 |
3 |
4 |
5 |
6 |
7 |
8 |
1. Direct Investment (net) |
9.4 |
22.1 |
9.3 |
6.5 |
5.0 |
1.4 |
1.1 |
1.a Direct Investment to India |
25.9 |
33.0 |
12.4 |
9.5 |
6.9 |
4.2 |
5.5 |
1.b Direct Investment by India |
–16.5 |
–10.9 |
–3.1 |
–3.0 |
–1.9 |
–2.9 |
–4.4 |
2. Portfolio Investment |
28.2 |
16.6 |
2.3 |
–1.4 |
1.8 |
13.9 |
–0.01 |
2.a Portfolio Investment in India |
29.4 |
16.8 |
2.5 |
–1.6 |
1.9 |
14.1 |
–0.03 |
2.b Portfolio Investment by India |
–1.2 |
–0.2 |
–0.2 |
0.2 |
–0.04 |
–0.2 |
0.02 |
3. Other investment |
24.4 |
29.2 |
12.6 |
14.2 |
1.0 |
1.4 |
8.1 |
3.a Other equity (ADRs/GDRs) |
2.0 |
0.6 |
0.3 |
0.2 |
0.1 |
0.03 |
0.2 |
3.b Currency and deposits |
3.8 |
12.1 |
1.2 |
3.1 |
3.2 |
4.6 |
2.0 |
Deposit-taking corporations, except the central bank: (NRI Deposits) |
3.2 |
11.9 |
1.2 |
2.8 |
3.3 |
4.7 |
0.9 |
3.c Loans* |
18.6 |
16.8 |
14.9 |
9.5 |
–7.7 |
–0.03 |
1.0 |
3.c.i Loans to India |
18.3 |
15.7 |
14.9 |
8.9 |
–8.1 |
–0.02 |
0.7 |
Deposit-taking corporations, except the central bank |
1.2 |
4.1 |
11.5 |
3.9 |
–8.7 |
–2.6 |
–2.7 |
General government (External Assistance) |
5.0 |
2.5 |
0.4 |
0.3 |
1.4 |
0.3 |
0.8 |
Other sectors (ECBs) |
12.2 |
9.1 |
3.0 |
4.7 |
–0.8 |
2.3 |
2.7 |
3.c.ii Loans by India |
0.3 |
1.0 |
–0.02 |
0.6 |
0.5 |
–0.01 |
0.3 |
General government (External Assistance) |
–0.03 |
–0.2 |
–0.04 |
–0.04 |
–0.04 |
–0.04 |
–0.01 |
Other sectors (ECBs) |
0.3 |
1.2 |
0.02 |
0.6 |
0.5 |
0.03 |
0.3 |
3.d Trade credit and advances |
11.0 |
6.7 |
3.1 |
2.9 |
0.6 |
0.2 |
2.7 |
3.e Other accounts receivable/payable - other |
–11.1 |
–6.9 |
–6.8 |
–1.5 |
4.9 |
–3.3 |
2.2 |
4. Reserve assets (increase-/decrease+) |
–13.1 |
12.8 |
–5.4 |
–0.3 |
12.8 |
5.7 |
–2.0 |
Financial Account (1+2+3+4) |
48.9 |
80.7 |
18.7 |
19.0 |
20.6 |
22.4 |
7.1 |
P: Preliminary; PR: Partially Revised
*: Includes External Assistance, ECBs, non-NRI Banking Capital and short term trade credit.
Note: Total of subcomponents may not tally with aggregate due to rounding off. |
Concerns about the domestic business
environment appear to be weighing on FDI
inflows as well. NRI deposits, however, have
picked up in recent months (Table III.4). Since
concerns about the growth outlook for AEs seem
to have prompted investors to reconsider the
resilience of emerging market growth as well,
the outlook for capital flows to EDEs including
India remains subdued.
Table III.4: Capital Flows in 2011-12 and 2012-13 So Far |
(US$ billion) |
Component |
2011-12 |
2012-13 |
Apr.-
Jun. |
Jul.-
Sep. |
Oct.-
Dec. |
Jan.-
Mar. |
Apr.-
Jun. |
Average of the monthly flows |
1 |
2 |
3 |
4 |
5 |
6 |
FDI in India |
4.1 |
3.1 |
2.3 |
1.5 |
2.2* |
FDI by India |
1.0 |
1.0 |
0.6 |
1.0 |
0.5 |
FIIs (Net) |
0.8 |
–0.5 |
0.6 |
4.7 |
–0.6 |
ADRs/GDRs |
0.1 |
0.1 |
0.03 |
0.01 |
0.01 |
ECB Inflows |
1.0 |
1.6 |
0.9 |
0.8 |
–0.4 |
NRI Deposits (Net) |
0.4 |
0.9 |
1.1 |
1.6 |
2.4* |
*April-May. |
Rupee gains in Q4 of 2011-12 dissipated
in Q1 of 2012-13
III.6 The rupee gained by 4.1 per cent in Q4
of 2011-12, partly reflecting the favourable
impact of policy measures by the Reserve Bank
to improve capital flows and curb speculative
pressure in foreign exchange market. The
intervention in the foreign exchange market also
helped in containing the depreciation. However, the rupee started weakening from the first week
of April 2012 as portfolio capital inflows dried
up. The large trade deficit, domestic policy
uncertainty and growing apprehensions about
the euro area affected the overall investment
sentiment. As a result, the rupee reached a low
of 57.2 on June 27, 2012 and the real effective
exchange rate (i.e., the REER based on 6, 30
and 36 currency baskets) recorded a depreciation
(Table III.5).
Table III.5: Nominal and Real Effective Exchange Rates-Trade Based
(Base: 2004-05=100) |
(Per cent, appreciation+/depreciation-) |
|
Index
July 20, 2012 P |
Year-on-Year Variation (Average) |
2011-12
(March 2012 over January 2012 ) |
2012-13
(July 20, 2012 over March 2012) |
2009-10 P |
2010-11P |
2011-12 |
1 |
2 |
3 |
4 |
5 |
6 |
7 |
36-REER |
91.4 |
–3.2 |
8.0 |
–3.2 |
2.3 |
–7.2 |
36-NEER |
78.6 |
–2.6 |
3.1 |
–6.4 |
1.2 |
–9.7 |
30-REER |
83.5 |
–4.6 |
4.8 |
–2.9 |
2.3 |
–7.2 |
30-NEER |
80.3 |
–2.2 |
1.1 |
–5.4 |
1.0 |
–9.6 |
6-REER |
104.6 |
–0.3 |
13.0 |
–6.8 |
2.5 |
–7.1 |
6-NEER |
76.4 |
–3.7 |
5.7 |
–7.9 |
1.4 |
–9.9 |
`/US$ (Average) |
54.5# |
–3.2 |
4.0 |
–4.9 |
2.0 |
–7.7# |
`/US$ (end-March) |
55.9* |
12.9 |
1.1 |
–12.7 |
–2.9 |
–8.6* |
P: Provisional. NEER: Nominal Effective Exchange Rate. EER: Real Effective Exchange Rate.
*: As on July 26, 2012. #: April-July 26, 2012 over March 2012.
Note: Rise in indices indicates appreciation of the rupee and vice versa. |
Increasing external debt is a concern
III.7 Since equity flows dwindled, various
measures were taken to encourage other capital
flows into the country. These include an increase in FII investment in debt securities (both
government and corporate debt), enhancing
all-in-cost ceiling for ECBs and trade credit and
the deregulation of interest rates on rupeedenominated
NRI deposits, i.e., NRE and NRO
accounts. On account of the greater recourse to
such debt creating flows in financing CAD,
India’s external debt increased significantly
during Q4 of 2011-12 (Table III.6). Further, the
repayment of commercial borrowings of about
US$ 15 billion (including FCCBs of about US$
4.7 billion) is due during 2012-13. Thus, there is a pressing need to improve the equity flows
to finance CAD and maintain the external debt
at a manageable level.
Table III.6: India’s External Debt |
(US $ billion) |
Item |
End-Mar
2011 PR |
End-Jun
2011 PR |
End-Sep
2011 PR |
End-Dec
2011 PR |
End-Mar
2012 QE |
Variation (End-Mar 2012
over End-Dec 2011) |
Amount |
Per cent |
1 |
3 |
4 |
5 |
6 |
7 |
8 |
9 |
1. Multilateral |
48.5 |
49.4 |
49.1 |
49.9 |
50.5 |
0.5 |
1.1 |
2. Bilateral |
25.7 |
26.2 |
27.1 |
27.1 |
26.8 |
–0.3 |
–1.1 |
3. International Monetary Fund |
6.3 |
6.4 |
6.2 |
6.1 |
6.1 |
0.1 |
0.9 |
4. Trade Credit (above 1 year) |
18.6 |
18.7 |
19.5 |
19.8 |
19.9 |
0.1 |
0.6 |
5. External Commercial Borrowings |
88.6 |
92.9 |
96.3 |
98.7 |
104.4 |
5.7 |
5.8 |
6. NRI Deposits |
51.7 |
52.9 |
52.3 |
52.5 |
58.6 |
6.1 |
11.6 |
7. Rupee Debt |
1.6 |
1.6 |
1.4 |
1.3 |
1.3 |
0.0 |
0.0 |
8. Long-term (1 to 7) |
240.9 |
247.9 |
252.0 |
255.4 |
267.6 |
12.3 |
4.8 |
9. Short-term |
65.0 |
68.5 |
71.5 |
76.0 |
78.2 |
2.2 |
2.9 |
Total (8+9) |
305.9 |
316.4 |
323.5 |
331.4 |
345.8 |
14.5 |
4.4 |
PR: Partially Revised. QE: Quick Estimates. |
Sustainability of CAD and its financing
remain concerns
III.8 External sector vulnerability indicators
showed mixed trend in Q4 of 2011-12 (Table
III.7). There has been a marginal improvement
in the ratio of short-term debt to total debt.
While debt GDP ratio and debt service ratio
remained same, other indicators such as ratio of foreign exchange reserves to total debt and
the short-term debt to foreign exchange
reserves, deteriorated as at end-March 2012
compared with end-December 2011. India’s
Net International Investment Position (NIIP)
also weakened (Table III.8).
Table III.7: External Sector Vulnerability Indicators |
(Per cent) |
Indicator |
End-Mar
2010 |
End-Jun
2010 |
End-Mar
2011 |
End-Jun
2011 |
End-Sep
2011 |
End-Dec
2011 |
End-Mar
2012 |
1 |
2 |
3 |
4 |
5 |
6 |
7 |
8 |
1. Ratio of Total Debt to GDP |
18.0 |
- |
17.8 |
15.9 |
17.8 |
20.0 |
20.0 |
2. Ratio of Short-term to Total Debt (Original Maturity) |
20.0 |
20.9 |
21.2 |
21.6 |
22.1 |
22.9 |
22.6 |
3. Ratio of Short-term to Total Debt (Residual Maturity) |
41.2 |
42.5 |
42.2 |
43.3 |
43.4# |
43.5# |
42.6 |
4. Ratio of Concessional Debt to Total Debt |
16.8 |
15.9 |
15.5 |
15.1 |
14.8 |
14.4 |
13.9 |
5. Ratio of Reserves to Total Debt |
106.9 |
98.0 |
99.6 |
99.8 |
96.3 |
89.5 |
85.1 |
6. Ratio of Short-term Debt to Reserves |
18.8 |
21.0 |
21.3 |
21.7 |
23.0 |
25.6 |
26.6 |
7. Reserves Cover of Imports (in months) |
11.1 |
10.7 |
9.6 |
9.2 |
8.5 |
7.7 |
7.1 |
8. Reserves Cover of Imports and Debt Service Payments (in months) |
10.5 |
10.1 |
9.1 |
8.8 |
8.0 |
7.3 |
6.8 |
9. Debt Service Ratio (Debt Service Payments to Current Receipts) |
5.8 |
4.1 |
4.3 |
4.8 |
4.7 |
5.6 |
5.6 |
10. External Debt (US$ billion) |
260.9 |
270.3 |
305.9 |
316.4 |
323.5 |
331.4 |
345.8 |
-: Not available. #: RBI Estimate. |
Table III.8: Overall International Investment Position of India |
(US$ billion) |
Period |
Mar-11
(PR) |
Jun-11
(PR) |
Sep-11
(PR) |
Dec-11
(P) |
Mar-12
(P) |
1 |
2 |
3 |
4 |
5 |
6 |
NIIP |
-203.6 |
-216.5 |
-196.6 |
-204.8 |
-244.8 |
Assets |
439.8 |
450.0 |
453.9 |
431.6 |
437.1 |
Liabilities |
643.4 |
666.5 |
650.5 |
636.5 |
682.0 |
NIIP-GDP Ratio* |
-12.1 |
-11.9 |
-11.0 |
-11.3 |
-13.2 |
PR: Partially Revised P: Preliminary.
* Based on annualised GDP. |
Rising vulnerability to external shocks
III.9 The CAD-GDP ratio was high at 4.5
per cent in Q4 of 2011-12, taking the full year ratio to an all time high of 4.2 per cent. Such
high level of CAD, especially against the
backdrop of volatile global macroeconomic
conditions and volatile capital flows, raise grave
concerns about its sustainability. A recent
analysis shows that with GDP growth of 7 per cent, CAD-GDP ratio of around 2.5 per cent is sustainable. The estimate is based on analysis
of threshold level of India’s net external liability
to GDP ratio to work out sustainable CAD-GDP
ratio in various growth scenarios. With an
increase in deficit beyond this level, financing
could be a constraint and the external sector
vulnerability may rise further. High external
debt, along with a deterioration in the net
international investment position and a moderate
decline in forex reserves also weakened the
resilience of India’s external sector in Q4 of
2011-12. Going forward, the trend in CAD will
largely depend on the global macroeconomic
and trade environment. The trend in capital
flows will depend on global liquidity conditions,
as well as the domestic investment and policy
environment. |